One of the exciting yet risky part of cryptocurrency is trading. It will test your patience, emotions, feelings and how financially stable are you. It is fun especially if you are gaining more profit, seeing a lot of greens with positive gains are overwhelming. Conversely, it will makes you stress once you gained nothing—in short you are in loss.
Now, to make these gains possible, you may need a vast knowledge when it comes to reading chart patterns, the candlesticks and predict the price movement of the market. One of the best things to do is to learn and understand indicators.


In the end of this article, you will encounter the following:
Support and resistance
Bollinger Band
Relative strength index
Support and resistance
The concept of the support and resistance is undeniably great because the traders and price movement of the market are bouncing on these two; the floor and the ceiling. Traders used this analogy to understand it better, the support as the floor while the resistance is the ceiling.
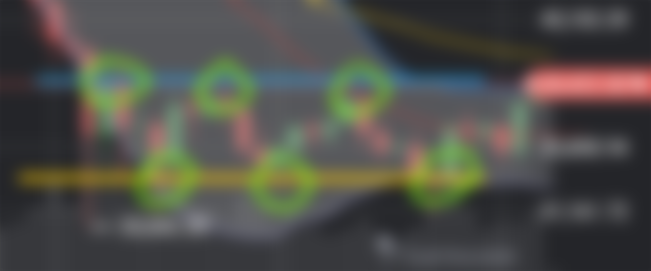

As what you can see on the photo, the blue line represents as the ceiling—resistance because the price of Bitcoin bounced on that area for how many times. Meanwhile, the yellow line considered as the support or also known as floor because the price also bounced on that area.
The support and resistance is powerful and you can master it so you will know if the price will bounce. On the other hand, professional traders also use this to determine if the price movement will create a reversal trend, whether it is an uptrend or downtrend.
Remember, the support and resistance is not always straight vertical and horizontal line, it can also be diagonal that depends on the trend.
To have an accurate idea and visualize the support and resistance, you can read this article: Beginner's guide: What is the Support and Resistance?
Bollinger band
Bollinger band is a technical analysis that was developed by John Bollinger to determine if the price of the coin is oversold or overbought. It can be determined by using the two bands—the upper and lower band and with a Simple Moving Average.
These two bands are called Upper band and Lower band that has a standard positive and negative (+/-) 2 standard deviation while the default moving average is 20-SMA or 20 Simple Moving Average. It can be customized depends on your preference.
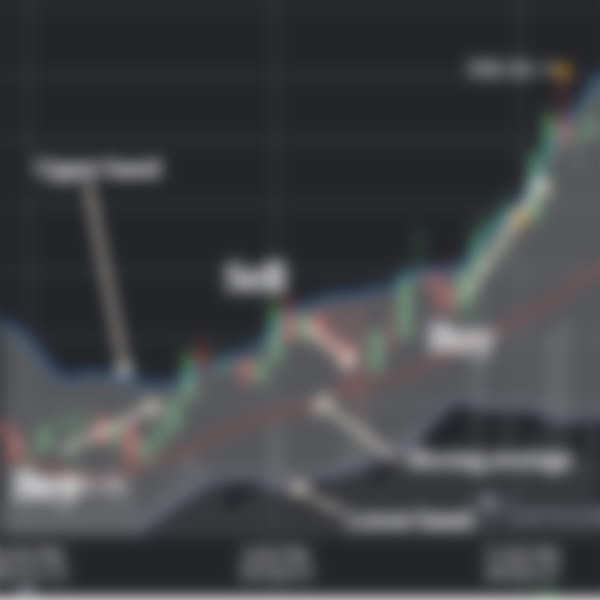
As what we can see on the photo, the blue band is the upper band while the purple one is the lower band and the red line between these two bands is called Simple Moving Average. In this example, the price bounced on the Simple Moving Average and pump until it reached the upper band. It can bounce from upper band to lower band, Moving Average to upper band and Moving average to lower band.
As what you have noticed, the bands and moving average are more likely the support and resistance as well. The price can bounce depends on the trend. In addition, if the two bands are getting close to each other, the traders consider it as low volatility of the market and it is called Squeeze.
To have an idea and visualize the Bollinger band, you can read this article: Beginner's Guide: How to use Bollinger Band?
Relative Strength Index
It is a momentum indicator and technical analysis that will determine if the price of the coin or stock is overbought or oversold. According to Investopedia, “the indicator was originally developed by J. Welles Wilder Jr. and introduced in his seminal 1978 book, “New Concepts in Technical Trading Systems.””
The standard settings is when the price is above of 70, it considered as overbought and possibly have a reversal trend or a pullback. Meanwhile, if the price is below 30 the price indicates as oversold and possibly have a temporary or massive pump.
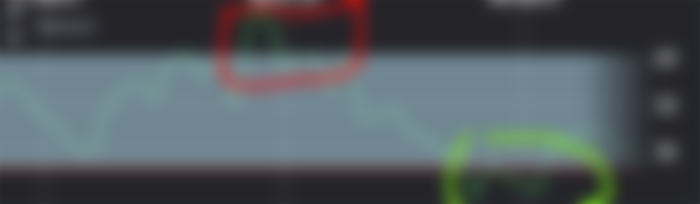

As what you can see on the photo, the price is above the white line (it is 70) and indicates as overbought, as you can see the price suddenly dropped when the price was overbought. Meanwhile, the price was under 30 or the red line indicates an oversold and possibly to have a pump.
To deepen your understanding about Relative Strength Index, you can read this article: What is Relative Strength Index?
Conclusion
These indicators is a great combination to determine the reversal trend, the pullback and predict the price movement of the coin. It can help you on your technical analysis and be a professional trader.
Remember, the market is volatile and even a professional trader can do a mistake especially if the big people and institutions are manipulating the market by simply spreading and making Fear-Uncertainty-Doubt or also known as FUD.
Don't forget to:
Sources:
https://read.cash/@Laurenceuuu/explaining-the-basics-of-support-and-resistance-efe93da9
https://read.cash/@Laurenceuuu/beginners-guide-how-to-use-bollinger-band-f772ef47
Published: June 15, 2021


Laulau namanaaa, mahilo na. Gawa ka naman ng stories ulit 😵. Advance na advance kana sa Crypto, kamusta naman ako stuck ahahaha.