In trading, it is very important to know the basic terminologies and indicators that you can use to have a good entry and exit. Once you know what you are doing and had a great analysis, you do not need to worry about your position.
One of the common terms that you will heard in trading is the Support and Resistance. Based on my own understanding, the support and resistance are the boundaries or barriers where the price of the coin will bounce. It can be represented by trendlines that you can draw to determine the possible bounce of the price level of the market.
To support my statement, let us borrow the importance and purpose of these two terms from Investopedia, “Once an area or “zone” of support or resistance has been identified, those price levels can serve as potential entry or exit points because, as a price reaches a point of support or resistance, it will do one of two things—bounce back away from the support or resistance level, or violate the price level and continue its direction—until it hits the next support or resistance level.”
These two terms are important to know especially if you are starting to trade, most of the traders are using it to know the potential entries and exit that confirmed by other indicators. It is one of the basics but very useful and powerful to gain more profit.
If you want to understand it more, let us discuss some examples so you can read the chart like a pro! (just kidding)
The basics of support and resistance


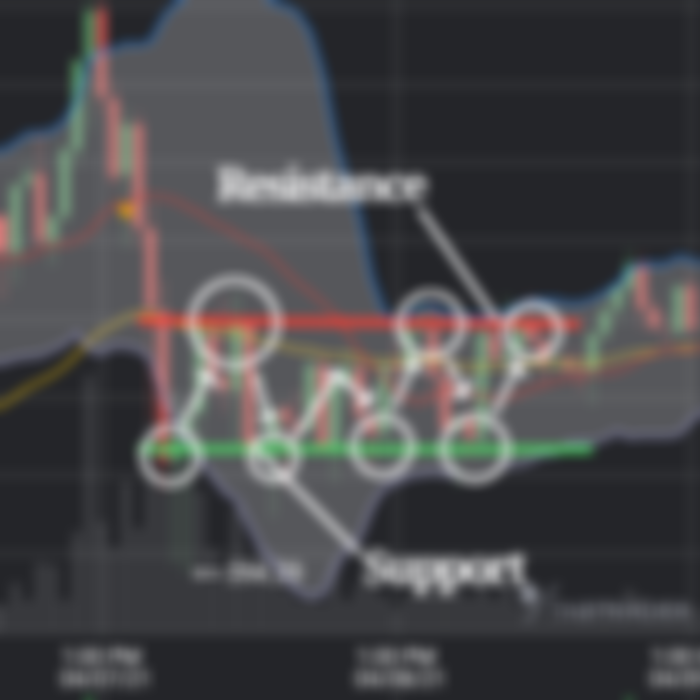
Example 1: In this situation, I drawn two trendlines in upper and lower part of the chart. It represents as the support and the resistance. As you can see on the photo, the red line shows that it is the resistance and the green line as the support. As per Investopedia’s term, it is the floor (support) and the ceiling (resistance).
This is the chart of Bitcoin cash last April 7, 2021. As you can see, the chart bounced on the support after the dip and bounce again on the resistance and repeat if the two trendlines does not have a breakout. The photo will help you to visualize it.
Example 2:
In the first example, you will see that it is a straight chart, on the next example, look on the uptrend that has a support and resistance. Like on the first example, I drawn two trendlines diagonally and it represents as the support and resistance using the same color, red as resistance and green as the support.
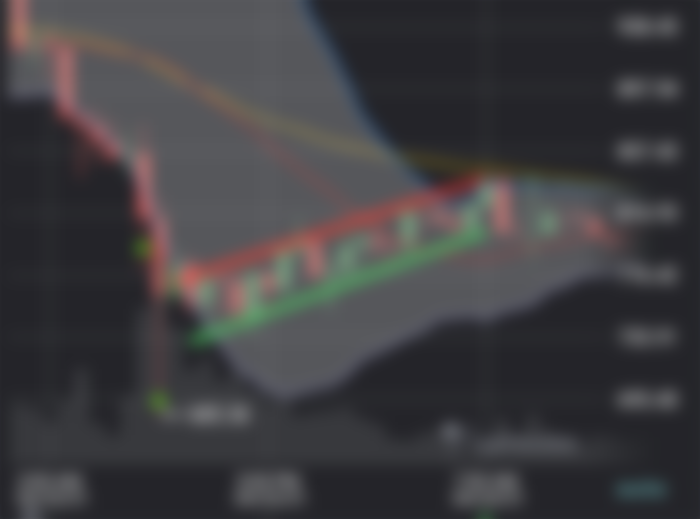

This is the chart of Bitcoin cash last April 23, 2021. The chart bounced on the support again and moved a slight uptrend by bouncing on the support (floor) and resistance (ceiling) repeatedly.


Uptrend and Downtrend
These lines can be an uptrend and downtrend if the price level break the support and other indicators confirmed it, there is a chance that it will be downtrend. If the price level breaks the resistance, then it can be an uptrend.
This photo is the example of possible uptrend, as you can see, it bounced on the support and resistance repeatedly then break its resistance and create an uptrend movement.


The next example is a downtrend movement of the price, the price level bounced on the support and resistance for many times and break the support and create a downtrend movement.


Conclusion
The support and resistance are powerful when it comes to trading, you can use it in your swing trades and scalping. However, there are different indicators that you need to confirm it and take note that this may not accurate. These trendlines are just a guide and can help you in analyzing the price movement.
In the end, you can still do your own research and deepen your knowledge about support and resistance. This is just a simple guide for beginners like me. Always remember to trade at your own risk.
Source:
https://www.investopedia.com/trading/support-and-resistance-basics/
Published: May 18, 2021


Btw, ask ko lang kung anong timeframe ang dapat tingnan pag ichecheck yung trading indicators? 1hour or 4hours?