Certain Nuances of Inflation Commonly Overlooked
After Joe Biden took over the White House, the inflation rate shot up at an alarming rate. Inflation was relatively quiescent in January and February 2021 at 1.4% and 1.7%, respectively. However, by March 2021, people grew concerned as the rate hit 2.6%. Then, it hit 4.2%, 5%, and 5.4% in the next 3 months.
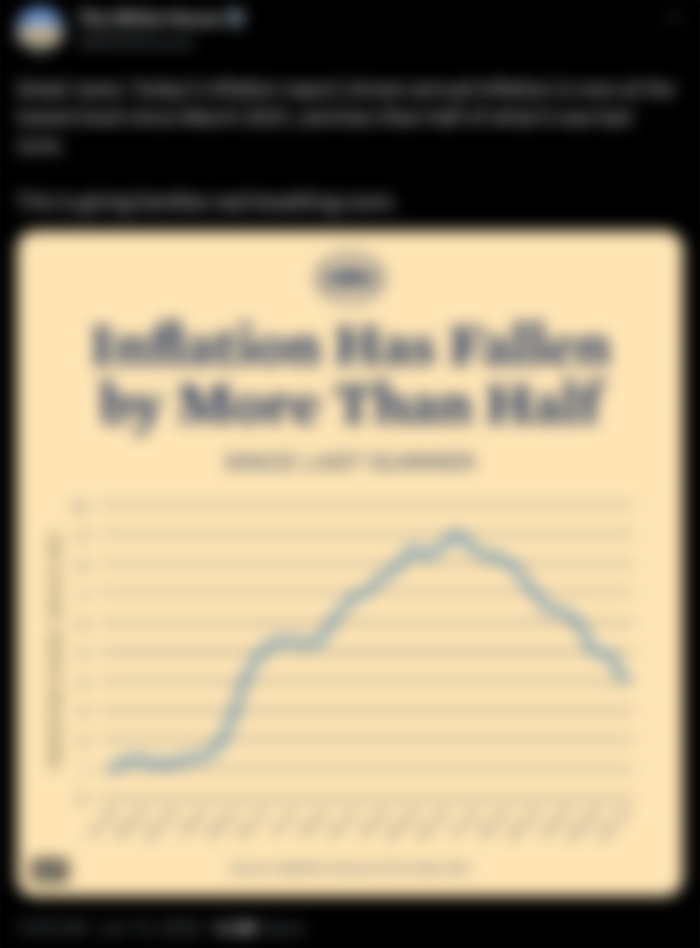
Eventually, the inflation rate hit a peak of 9.1% in June 2022. Since then, it has steadily declined to a 4% rate in May 2023. On June 13, 2023, The White House Twitter account celebrated how the inflation rate has fallen by more than a half and claims that it is giving families "breathing room":

Original tweet. Precise numbers can be found on Statista and YCharts.
However, this is a rather disingenuous way of portraying the statistics and it leaves out a substantial part of the real story.
Rate Reduction =/= Less Inflation
At a quick glance, the downward trend seems to be a good thing. However, just because the rate is declining, it does not mean there is less inflation. How does that work? Well, the consumer price index (CPI) is a year-over-year metric. Heck, The White House Twitter account's graph even says so on the y-axis.
Since the inflation rate is a relative metric, you can interpret it in multiple ways. In May 2023, the rate was 4%, so a good that was worth $100 in May 2022 dollars would be worth $104 in May 2023 dollars. You can also stack the inflation rate over multiple years. For instance, the rate in May 2022 was 8.6%, so if you multiply 1.04 by 1.086, the May 2021 to May 2023 inflation rate would be 1.13 or +13%. If a good cost $100 in May 2021 dollars, then it would be worth $113 in May 2023 dollars. If you go back 3 years, then the inflation rate would become 18.6% (Math: 1.04 x 1.086 x 1.05).
Technically, the "Inflation has fallen by more than half" title is untrue. An accurate title would be "The rate at which inflation worsened fell by more than half".
Technically, the "Inflation has fallen by more than half" title is untrue. An accurate title would be "The rate at which inflation worsened fell by more than half".
Not All Products are Created Equal
The CPI is a weighted average market basket of consumer goods and services. While it is useful in that it amalgamates everything into one number, it is nevertheless an average. Some goods and services fall below average and some fall above average. For example, food, electricity, and shelter, all of which are necessary for basic living, outpace the CPI.


When comparing the CPI to energy, gasoline, and natural gas, the graph initially looks positive because those goods are below average. However, remember that inflation is a year-over-year metric. Take gasoline as an example. In May 2021, 2022, and 2023, gasoline had inflation rates of +56.2%, +48.7%, and -12.2%, respectively. The -12.2% looks nice, but that is a reduction from its May 2022 price which had massive inflation over the year before that also had massive inflation. If I were to calculate the May 2020 to May 2023 gasoline inflation rate, it would be 104% (Math: 1.562 x 1.487 x 0.878).


Conclusion
It is important to read between the lines and know the specific nuances, especially when it comes to something important such as inflation. What I and many other people learned throughout this administration is that it is not here to provide proper information and context. Rather, this administration has a penchant for obfuscation and downplaying, e.g. "Inflation is transitory", "Inflation is a good thing". Considering how inflation is one of the top concerns among Americans, the federal government is just asking for trouble.
Without proper information and knowhow, one's ability to make sound financial decisions will be severely diminished.
This article is also co-published on Odysee, Publish0x, and Steemit.