7/17/2020
I've been doing trading analysis on some coins from Binance/Okex & I found something interesting in DigiByte.
So,Let's start with a little dramatic story.Most of us know there were very long feuds that took place publicly between Binance Founder Mr.(Shady)Cz Binance and DigiByte Founder ('Decentralized' Merchant) Mr.Jared Tate.
So most of us,including Digibyte Holders thought Mr.Decentralized's coin is Finito'd because of his Toxic behaviours on twitter.Especially when he had the founder of Largest Cryptocurrency Exchange on the ropes.We all thought it was over.Soon Followed by the Delisting of Digibyte from Poloniex for rattling (Announcement Merchant) Mr.Justin Sun.
Every Digibytes holders were calling for Jared's head.
Then suddenly BOOM

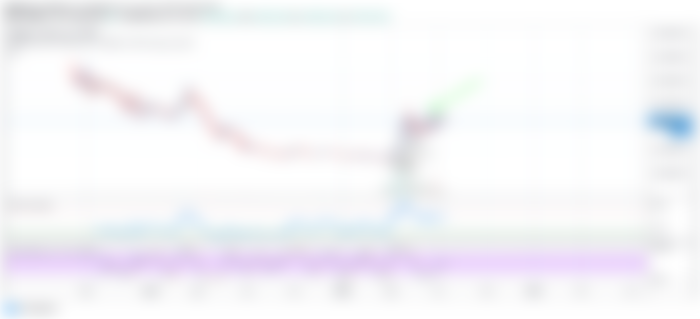
Say wha???Digibyte community's most hated exchange lists them.Someone took CZ's phone and did it?Let's check this out

Coincidence ?I think not.It was being accumulated by DigiByte insiders and Binance's whales then Volume decreased by the time around June 22 where Binance Offical Listing Annoucement was made.But Plebs were so euphoric about it they forgot to check out 'behind the scenes' events.
So,now lets get back to Trading Analysis
What is interesting about DigiByte Chart?
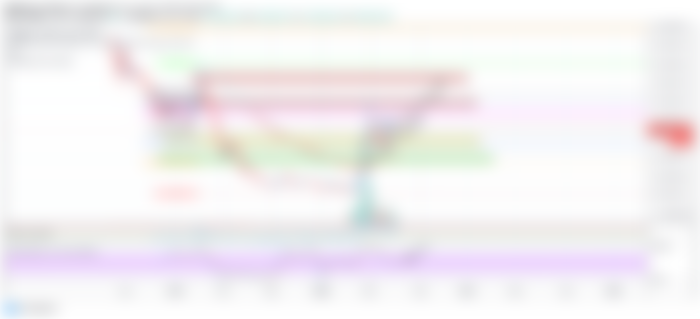
DGB/BTC 1W OKEx

Since the breakout above 50(Red) And 100(Blue) EMA on weekly,it's trying to find support above Yellow box making it 'Cup and Handle' look-a-like chart.Currently it got rejected by 0.5 fibs multiple times so it will probably go back down to yellow box around 190-200 sats where u can accumulate.
Stoch RSI has been cooling down and by the time price reaches yellow box,StochRsi will make a possible bull cross causing the pump from the 190-200 area.
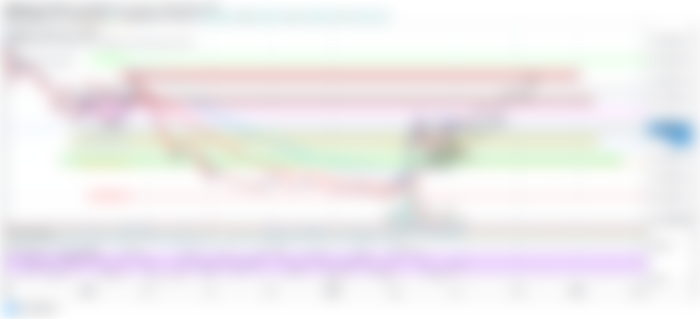
DGB/BTC 3D,OKEx

You can see that ,price keeps bouncing from the bottom trend of the ascending triangle.So we can expect another bounce from the touch of Yellow box which is 190-200 sats zone.Since we have pretty much checked the big timeframe,lets take a look at smalltime frame from Binance chart.
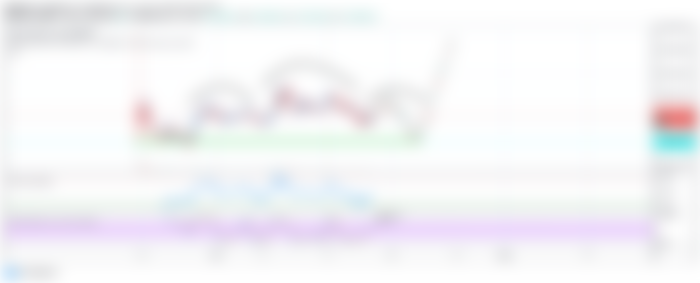
DGB/BTC Binance 4H

https://www.tradingview.com/chart/DGBBTC/rg7Gnsdr-Potential-H-S-DGB/
StochRsi(Pointed arrow) is about to hit the roof with potential H&S(Head and Shoulder) Pattern forming which can cause the dump to Green box which is also 190-200 region.So we can confirm that is our accumulation zone.
After all the cooldown on shorter timeframe ,DGB can breakout on Larger timeframe Patterns just as drawn in Pic 2 & 3.
This DGB/BTC Trade can yield up to 45-70% profits for swingers(190/200-->290-360)
This's just Risk/Reward Plan ,no financial advice
Good luck
If you want more of these setups,follow me on tradingview where I usually posts charts there https://www.tradingview.com/u/tikyikhant/
#DigiByte $DigiByte #DGB $DGB #Decentralized
