Bitcoin Could Retest 10,200-10,500 Again (Full Analysis)

So,I just had an alert of ***BTC/USDT*** going above all **50-100-200 MAs,MACD** becoming bullish while breaking out of **4-hour Bollinger Band.**

So,I decided to check on the larger view again although my caution for Euphoric Crypto market remains the same as I decribed in this article https://read.cash/@Khant/its-time-to-be-prepared-for-crypto-market-correction-717c8d9f So,lets take a look at **1D** chart,
Currently ,We can see a potential trendline break out today with **50 MA resistance** sitting right on **the upper band of Bollinger** which is *****9403***** ***USDT.*** There's another resistance from **23rd June** at (*****9650-9750*****) ***USDT*** region. So,to reach *****10200-10500***** again,we will need to break clean above the resistance from **23rd June.** Using **Stochastic RSI** and **Ichimoku Cloud** on **1D** Chart,

We can see a bounce from **Cloud** happening at the moment with ***Baseline*** (RED) acting as resistance around *****9520.***** ***Stoch RSI*** has crossed bullish giving me bias that we can go and touch *****10200-10500***** soon. Conclusions of Local Resistances area after using **MACD,Stoch RSI,Ichimoku Cloud ,MAs & EMAs** are as follow 1st resistance =*****9403-9523***** **USDT** (Based on **Cloud,50 MA and Bollinger Band**) 2nd resistance = *****9650-9780***** USDT with final resistance before a new trading range =****10200-10500**** **USDT.** So,lets take a look at **1W** chart,

I'm aware that **Trendlines** are ***not*** ***100%*** reliable but I drew them to see every possible scenarios.I've described the reasons for short term **Bullishness** above but I'm sticking to my previous market correction view until it breaks clearly above ***10,500*** **USDT** as you can see **Stoch RSI** has crossed bearish since **June** and it can continue going down .**50EMA (Red)** is giving support at *****8500***** **USDT** and **100 EMA(Blue)** is giving support at *****8100***** **USDT. Fractal** support (green box) is around *****7700***** **USDT.**

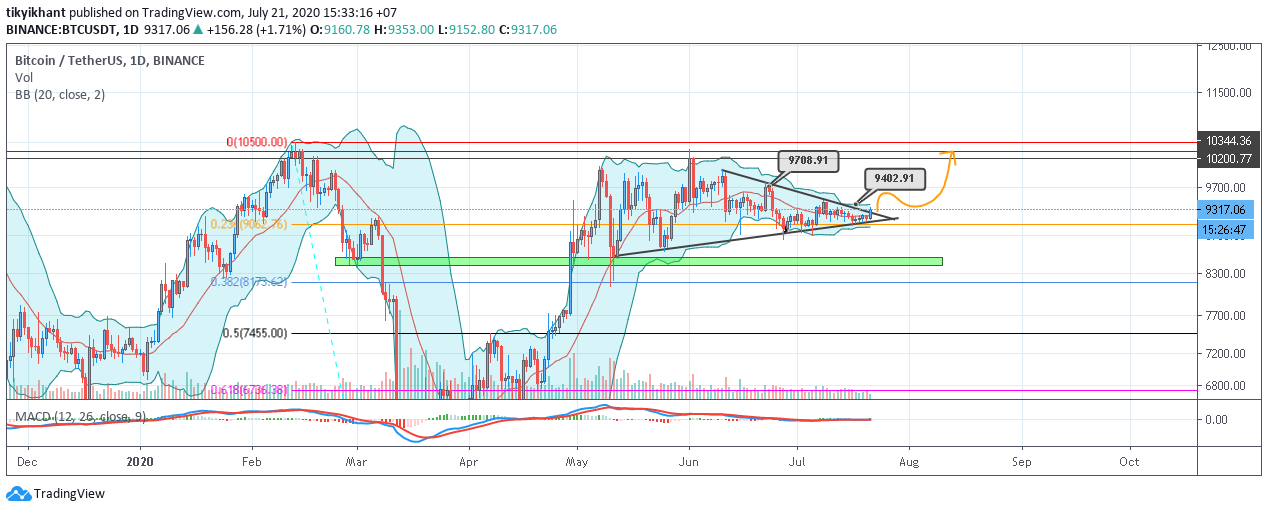
This's the chart from my last article. https://read.cash/@Khant/its-time-to-be-prepared-for-crypto-market-correction-717c8d9f So,here are the support and resistances of *****BTC/USDT***** I marked after using **4hr/1d/1W Charts.** *****Final Conclusions***** **Support=** *****9000***** **( Psychological support)** *****8750-8800***** **(Daily Fractal support)** *****8500***** **(weekly 50 EMA support)** *****8100***** **(weekly 100 EMA support)** *****7700-7800***** **(Weekly Fractal support)** Resistance- *****9400-9500***** **( Daily BB upper band/50 MA resistance/Baseline)** *****9650-9780***** **(Daily Fractal resistance)** *****10,000***** **(Psychological Resistance Zone)** *****10,200-10,500***** **(Weekly Fractal resistance )** **Incase we broke clearly above** *****10,500***** **USDT,new trading range will be** *****10,500-11,600***** **USDT.** *****Clean 1D Chart with Fibonnaci Retracement tool*****

These are my Technical Analysis views for Bitcoin. Please share me ur view. **If you want more of these setups,follow me on tradingview where I usually posts charts** **there** **.** **Read.cash Communities** https://www.tradingview.com/u/tikyikhant/ All About Crypto ;https://read.cash/c/all-about-crypto-0c1c Crypto Trading Analysis/Fundamental Analysis:https://read.cash/c/crypto-trading-analysisfundamental-analysis-d43f Football :https://read.cash/c/football-97db If you want to blog in alternative site to read.cash, Register here https://www.publish0x.com?a=pnelYVLjaK. Still using Laggy Broswers like Chrome/Opera &Firefox,Uninstall them at once and Install Better Browser with AD blocker Brave . https://brave.com/mqv544
1 comment
I want everyone to also read my previous article because History is not good for Bitcoin between July -August.