Support and resistance is an important factor for trading. In this case whether it is cryptocurrency trading or forex trading.
There are different patterns to support and resistance. Depending on which, everyone finds support and resistance areas in their own way.
Let's take a look at the support and resistance areas in general.
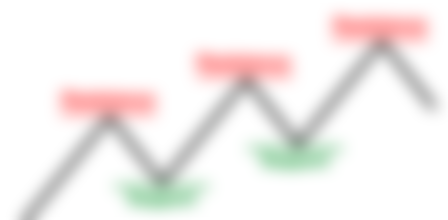

In the picture above you can see which areas have been taken as support and which have been taken as resistance.
When the market moves upwards and backs up from one place then the highest backing position before the market backs down is taken as resistance.
Each resistance area implies a greater presence of sellers.
On the other hand, when the market moves from one place to the other, the area from which the market starts to move upwards is considered as support.
Each support area implies more presence in the buyer.
Thus, as the market continues to move up and down, it will continue to build support and resistance one by one.
There are many ways to trade with this support and resistance. There are two basic methods..
Bounce trade
When the price fails to cross the support level and the new tax starts to go up, buy at that stage.
Price, on the other hand, will sell at that stage when it fails to cross the resistance level and starts moving downwards again.
Break out trade
If the price is able to break the resistance level and go up, then buy at that stage.
On the other hand, if the price is able to go below the support level break, then sell at that stage.
Confused about bounce and break out? No problem, we will try to clarify the matter by going into detailed discussion.
Support and resistance levels
First we need to know that support or resistance levels are not always at the same price.
Many times you may feel that the support or resistance level has broken out. But you will see that very soon the price is returning from that level, that is, the price is testing that level.
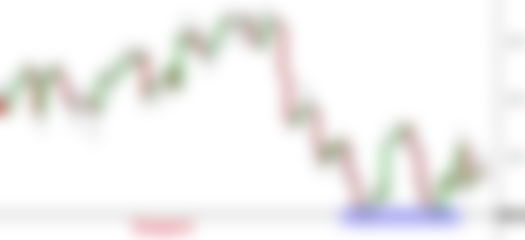

Notice in the picture above. Shown here at a support level. Where the support level price is 1.4700, now here you can see a pseudo which shows that the market went below the support level, several times.
Now at such a moment you may feel that the market has broken the support level. But in reality it is not. Although the market has gone below the support level, it has come close to the support level. This means that the market has tested that support level and then the market closes at the support level.
How do you know if support or resistance levels have broken?
In fact, it is difficult to answer this question accurately. Because in some cases, you may think that the support or resistance level is breaking. But soon you will see that your idea is proving to be wrong.
Let's look at the matter with the example of the picture below.
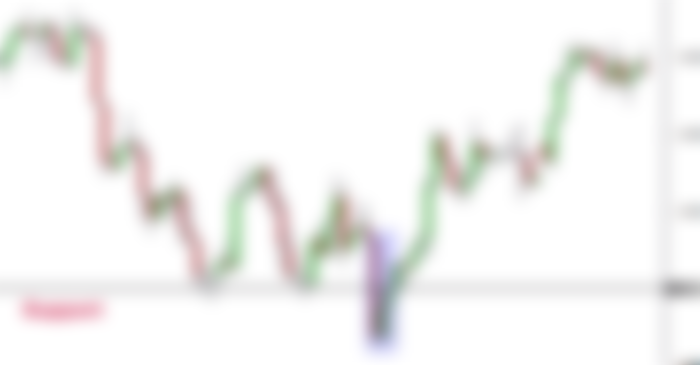

In the picture above 1.4700 is the support level. Here it is seen that a large candle is crossing the support level and creating a new candle below the support level. Now seeing this, it seems that the support level has broken out. And if you order a sale after seeing this, then you must pay.
The picture shows that the market has gone below the level of 1.4700 but has come up again and moved above the support level. And that has made the support level much stronger than before.
This type of breakout is called a false breakout.
Now how do you protect your trade from such false break outs?
In order to find a breakout of any kind, you need to consider multiple levels of support or resistance. By doing this you will be able to catch the breaks.
Falls: You can use line charts to find breaks. Only close prices are shown on the line chart, while high-low prices are also shown on the candle stick chart.
Looking at the high-low price on the candle stick chart can be confusing at times.
Notice the line chart below. Where several support and resistance levels are shown.
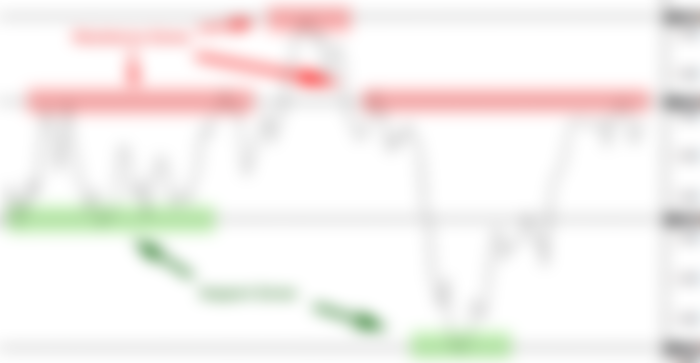

Let me say one thing here. The support level becomes the resistance level depending on the price movement. On the other hand, the resistance level also becomes support.
For example, suppose the support level in the middle of the picture above is 1.2245. As long as the market is above that price, this price will be considered as support level. But when this price breaks and the market continues to go down, this price will be taken as the resistance price.
Some more information about support and resistance:
As mentioned earlier, the support level becomes the resistance level according to the market price and the resistance level becomes the support level according to the market price.
The more times we test a level, that is, a support level, the stronger that support level will be. On the other hand, the same rule applies to resistance levels.
There are two types of support and resistance levels. Such as: Major Support Level (Strong) and Minor Support Level (Weak). Major Resistance Level and Minor Resistance Level on the other hand.
If the market breaks a support or resistance level and moves forward, then the subsequent movement of the market depends; He has broken out any kind of support or resistance level.


Happy day read cash users