The bitcoin price is experiencing tumultuous days. The current price is 31,853.97USD, In last week's analysis I described that we could expect more red this week. Will this continue in the coming weeks? Read on!
Bitcoin price weekly chart
The weekly chart (Figure 1) shows that the bearish "hanging man" candlestick has turned more red this week. In my opinion, the RSI needs to cool down even further. We saw this earlier when the RSI came so high, left in the graph. Targets are worth 70 and towards the 52. This means that the price will potentially give up even more. This process can take another 1 - 2 weeks.
Targets are then again the $29,880 - $30,000, $25,962 - $26,900 and the $23,500 - $24,000 if it goes pretty hard. I don't expect the price to fall below 21EMA and therefore stay above $20,000. The 21EMA now sits at $21,911 and will be about $22,900 next week.
After the dip I see the price continue towards the $48,880 and the $57,406 and the bullrun can be resumed.
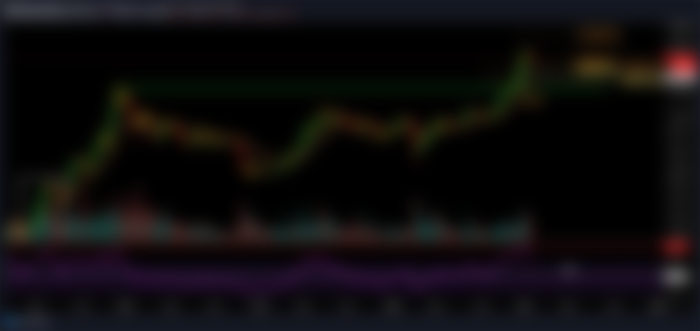

Figure 1: The race is red after last week's hanging man candlestick.
Bitcoin price daily chart
On the daily chart (Figure 2), the price has fallen after two weeks of consolidation. The battle for the triangle was won by the bears.
Bullish scenario
Right now I'm leaning towards bearish continuation. To be somewhat bullish again, the price must rise back above the top green rectangle ($32,000 - $33,000) and then conquer the $40,112.
Bearish scenario
The course here can get a bearish retest and rejection of the triangle. In that case, bears will persevere. The next targets are then the green rectangles between $29,559 - $30,347 and $27,052 - $28,209. The technical target of the symmetrical triangle is $22,673. Whether we fall back so deep is hard to say now, but it's always good to prepare for it. In that case, the daily RSI will be heading for the 30 value, at the arrow. This is a moment where I'm going to get in a lot of trouble.
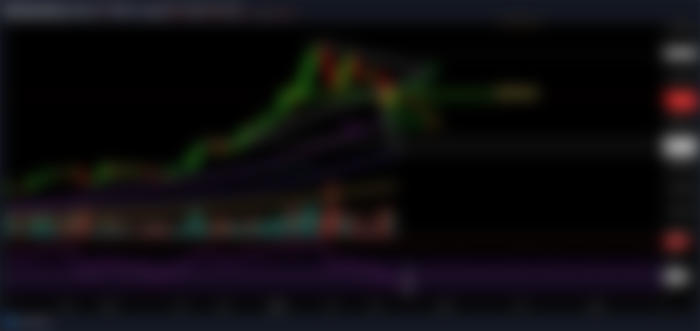

Figure 2: The course has fallen down from the triangle.
Bitcoin price 4-hour chart
The 4am chart (Figure 3) shows a "descending broadening wedge". This is a bullish pattern and is now finding support on the top and the 200MA. As long as this support remains, the price could continue bullish towards the targets at $34,810 and $37,040.
Although it's a bullish pattern, they don't always break out upwards. At loss of the 200MA there is support at $30,750 - $30,500. If that loses as support, it is likely that the bears will push hard towards the aforementioned targets.
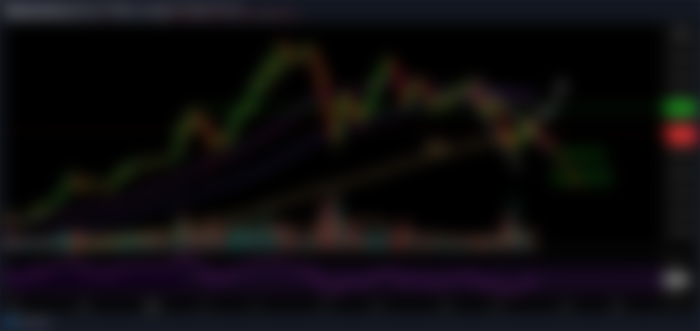

Figure 3: There is a descending broadening wedge playing out.
What will bitcoin do?
Despite the sharp decline this week, the weekly chart still paints the picture that there should be a further correction. If the price can get above $33,000 and make that support then the bottom may already have been and we won't get a deeper correction.
On the 4-hour chart, a descending broadening wedge can help if the bulls persevere. Losing the 200MA on the 4am chart as support is bearish and may further set the bearish scenario in motion.
In the short term I'm still bearish. In the longer term for the next 6 - 12 months I am hugely bullish for bitcoin and I can definitely see the price coming above $50,000.
Happy trading!
John van Meer
The Bitcoin Consultant,John van Meer, has been teaching the general public about cryptocurrency for years through webinars and seminars and online courses.
The newstoo is the online trade course that lets you get to know the right mindset and tools. This allows you to know with confidence when to get in or out of a trade. This allows you to trade more successfully and maximize your winnings and limit your losses. The free introductory course can be found here.
Happy trading!