

Key Bitcoin Takeaways
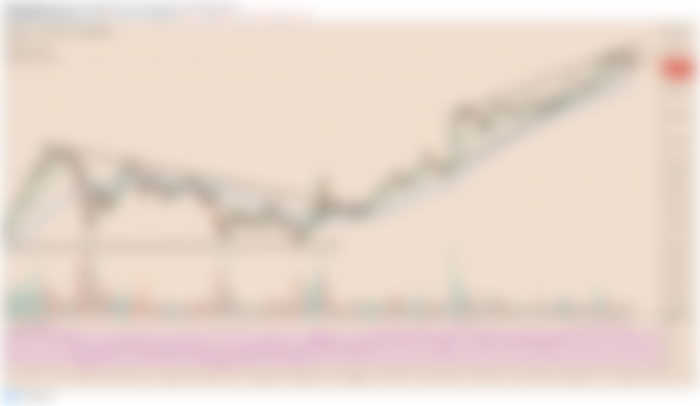
Bitcoin plunged by almost 5.5 percent on Monday after setting up a record high in the previous session.
The one-day drop is the largest since February 10, pointing to extended intraday declines as the European session matures.
Long-term sentiment remains bullish on growing corporate adoption against the US dollar depreciation.
Bitcoin (BTC/USD) sold off heavily throughout the Asian and early European session on Monday after achieving a new record high of $58,367 in the previous session.
The flagship cryptocurrency was down by up to 5.5 percent after the London opening bell, flirting with short-term technical support near $55,550 for an extended bearish breakout move. In doing so, BTC/USD targets the $52,000-54,000 as its next downside target.
Looking from a broader perspective, the pair appeared to have been testing an upward sloping trendline that acts as a price floor to a Rising Wedge pattern. Technically, a break lower risks sending the Bitcoin price lower by as much as the Wedge’s maximum height (which is about $10,000-long)
That puts the cryptocurrency on a corrective course to $45,000—about 20 percent lower from the latest peak.

Nevertheless…
…rising wedges have failed previously while determining Bitcoin’s short-term bias.
There is a massive possibility that Bitcoin locates a support area above $50,000 before it resumes its upward momentum. The reason remains its corporate/institutional adoption against the long-term risks brought by inflation and fiat depreciation.
Tesla, MicroStrategy, Square, Stone Ridge Holdings, and many other corporate firms have added billions of dollars of combined Bitcoin worth to their balance sheets in the last few months.
Crypto economist Ben Lilly noted in his latest report that the bitcoin accumulation spree among Wall Street firms outran the cryptocurrency’s supply. That led to a liquidity crisis, which persisted amid higher exchange BTC withdrawals and upped retail demand.
Mr. Lilly added that investors have flocked into the Bitcoin market as a means to escape the falling US dollar market. He further noted that those investors would not need to sell the cryptocurrency to realize their profits. Instead, they would collateralize their BTC holdings via decentralized finance services to earn yields.
“In doing so, investors can potentially side-step capital gains tax on their bitcoin while enjoying its price appreciation,” said Mr. Lilly. “And when bitcoin is six figures, it begs the question.”
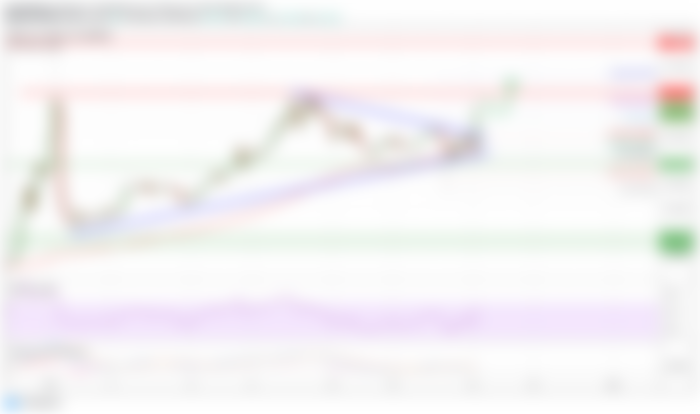

Ripple remained stable above $0.5000 and rallied above $0.6000 against the US Dollar. XRP price tested $0.6500 and it is likely to continue higher in the near term.
Ripple started a fresh increase above the $0.5500 and $0.6000 resistance levels against the US dollar.
The price is now trading well above $0.5800 and the 100 simple moving average (4-hours).
There was a break above a crucial contracting triangle with resistance near $0.5480 on the 4-hours chart of the XRP/USD pair (data source from Kraken).
The pair is trading nicely above $0.6000, and it is likely to continue higher towards $0.6500 and $0.6800.
Ripple’s XRP Price is Gaining Bullish Momentum
Recently, there was a sharp decline in ripple’s XRP price below the $0.5000 support zone. The price even spiked below $0.4500, but there was a quick recovery from $0.4326.
It started a strong increase above the $0.5000 resistance, outperforming bitcoin and ethereum. There was a clear break above the 76.4% Fib retracement level of the retracement level of the downward move from the $0.5842 high to $0.4326 low.
There was also a break above a crucial contracting triangle with resistance near $0.5480 on the 4-hours chart of the XRP/USD pair. The pair rallied above the $0.6000 resistance and it settled above the 100 simple moving average (4-hours).
It spiked above the 1.236 Fib extension level of the downward move from the $0.5842 high to $0.4326 low. It tested the $0.6450 resistance zone and it is now trading nicely in a positive zone.
A clear break above the $0.6450 and $0.6500 resistance levels could pump the price further towards the $0.6880 level. The next major resistance on the upside is near the $0.7200 level. Any more gains could lead the price towards the $0.7500 level.
Dips Limited in XRP?
If ripple fails to continue higher above $0.6500, it could correct lower. An initial support on the downside is near the $0.5840 and $0.5800 levels.
The main support is now forming near the broken triangle and $0.5500. A downside break below the $0.5500 support zone could lead the price towards the $0.5200 zone.
Technical Indicators
4-Hours MACD – The MACD for XRP/USD is gaining pace in the bullish zone.
4-Hours RSI (Relative Strength Index) – The RSI for XRP/USD is now well above the 50 level.
Major Support Levels – $0.5850, $0.5650 and $0.5500.
Major Resistance Levels – $0.6200, $0.6500 and $0.7000.