Update; Free Bitcoin Cash chart analysis; BCH To The Moon.

DISCLAIMER:I am not a financial advisor nor certified analyst. All contents discussed on this blogpost are solely my own personal views and for Trading education /entertainment purposes only. Cryptocurrency Trading is extremely risky where losses can exceed deposits. Do your own research and due diligence. The basis of this trading analysis is purely technical in nature. with that being said, let's get into It 1 Day Timeframe

BCH on the 1 day timeframe has reached the support zone and as expected bounce of towards a positive movement. This indicates a good and bullish movement. we are currently up $580.68. 4 Hour Timeframe
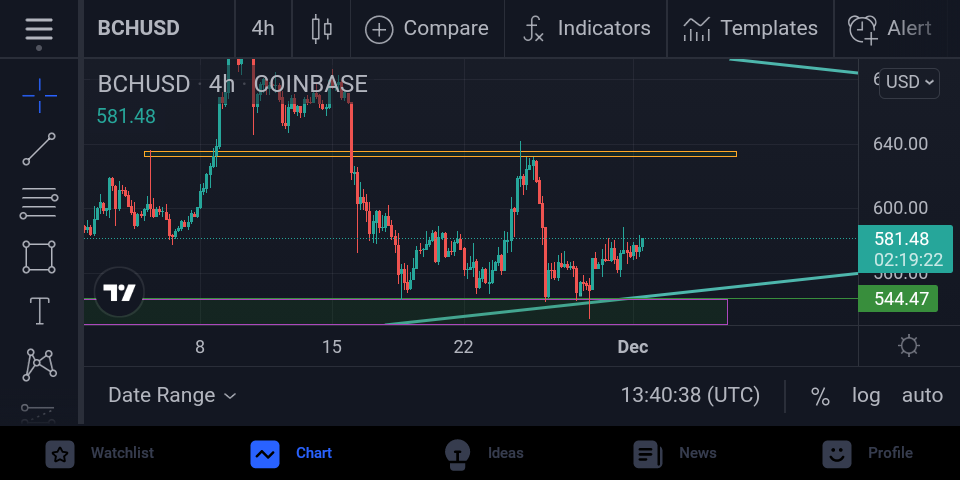
On the 4 Hour timeframe, There had also been a bounce of at the support zone But this time, There's a newly established resistance zone which the candlesticks are gradually heading towards for a profitable price movement. 1 Hour Timeframe

The 1 Hour timeframe indicates that the current candlesticks are moving in an Upward bullish ranging system Though there Is eventually going to be a resistance zone initially as it rises. 15 Minutes Timeframe

The 15 minutes timeframe show's us the candlesticks bouncing occasionally on the support line. And also, It constantly respect's the resistance zone. Though there seem to be a break out on the resistance line which could further lead to a bullish movement. Overall Market Analysis: BULLISH 📈 Don't forget to comment on what you think about BCH price movement.

*peace*..
No comments yet