Bitcoin Cash Analysis #31; Crypto To The Moon.
DISCLAIMER: I am not a financial advisor nor certified analyst. All contents discussed on this blogpost are solely my own personal views and for Trading education/entertainment purposes only . Do your own research and due diligence.
With that being said, let's get into it;
1 Month Timeframe.

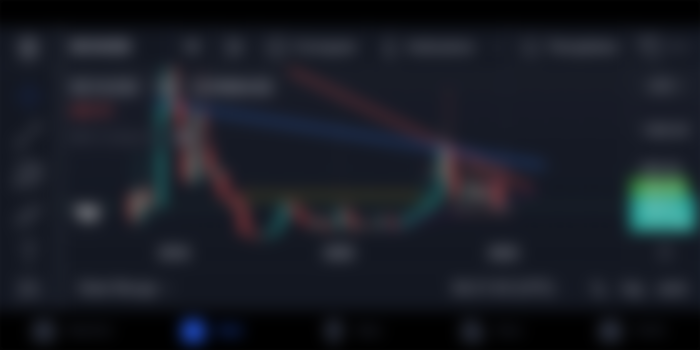
On the 1 month timeframe, we're still on the base level of the support zone and as we are priced $430.91, we struggle to bounce of the support zone and make our way up to the nearest resistance zone.
But the fact that we broke out on the bearish part of the symmetrical triangle, that's actually something to maybe worry about, But we're still hoping it's nothing but just a false break out.
1 Day Timeframe.

I'm sure you must have noticed that in those previous days, the price of BCH has decreased for sometime now from about $456 - $430.68 as of the time I'm making this analysis . If you've been following up with my analysis, you could have known the reason why we experienced some decrease in price as I've already made analysis on it, and guess what, I was right again.
So in my previous analysis, I spoke about the candlestick that was formed and that gradually made its way up to the nearest resistance zone, right. And I also mentioned about it falling as we were based on the resistance zone.
So what happened was simple. As we got to the resistance zone, we couldn't move further in a bullish path anymore. On we reaching the resistance zone, we were forced to move downwards or go on a bearish movement

Well That's It For Today.
Make sure you stay updated on the price movements of your crypto because you'll never know when to buy more or sell more.
Overall: We underwent some little bearish movement as predicted, but not to worry, were already at the support zone which will support our bullish movement.

swap your crypto anytime for free without account registration

Until next time, Peace.


