


The whole all time view of LTCUSD is pretty interesting. The start from 0 in 2016 saw a young bulletin that started with the speed picked up around the begining of 2017. Towards the end of 2017 LTC clocked an all time high of 440~. This price rise was incredible and the highest of all time. This was during the 2017 BTC rise to 19K, which brought the BTC craze to life and the drop back within 10K for two years. It wasn't until 2020 that BTC was out of the 10K-14K trend. The observation here is that the top 6 cryptocurrencies are almost tied together. Although they do not go on bulletins together, the strongest being BTC would be on a bullrun and take all with it. Then like the law suits that follow a lot of greats like XRP, we observe that the few cryptos will be left behind while the BTC and Ethereum go on a bull run.
Soon after Christmas 2017 into the new year on 2018, LTC saw a price dip through to 2019. This was due to the whole Bublé estimation effects and the Chinese New year or rather the Asian new year sell offs. The Asians would sell most of their stocks and whatever they got I the market to buy gifts and give to their family and friends. These friends in turn use part of the gifts to buy into the market. By the looks of the all time chart, this wasn't enough to buy back buying power. Throughout 2018, the power has been in the hands of the bears. Around the mid 2019 the bulls gained momentum to raise the price to around 120 but the bears came crumbling down with it into the 50s. The price stated below 100 all the way towards the end of 2020. The LTC price started picking up as BTC smashed the 20K line of resistance. During the BTC bullrun to the now 60K, which on the BTC is +40K in less than half a year, LTC saw a high rise of about a 100. Although the all time high is over 400. LTC remains teasing the 200 price range. With the upwards of 220,240,260 and the downrange of 180.


My style of analysis is naked chart. I love the least noise. The difference here is the trendlines and the support and resistance lines that I use to be a scope of price movements. What they tell me is that the LTC is most likely to chase golden 400 but for now LTC remains teasing the 200 price. The current line of resistance is the 260 price, the support appears to be 180. From the daily price highs of 220+- and lows of 190+- will have you narrow your focus so that any breakout to the upside or downside would catch you off guard. Just keep that in mind.
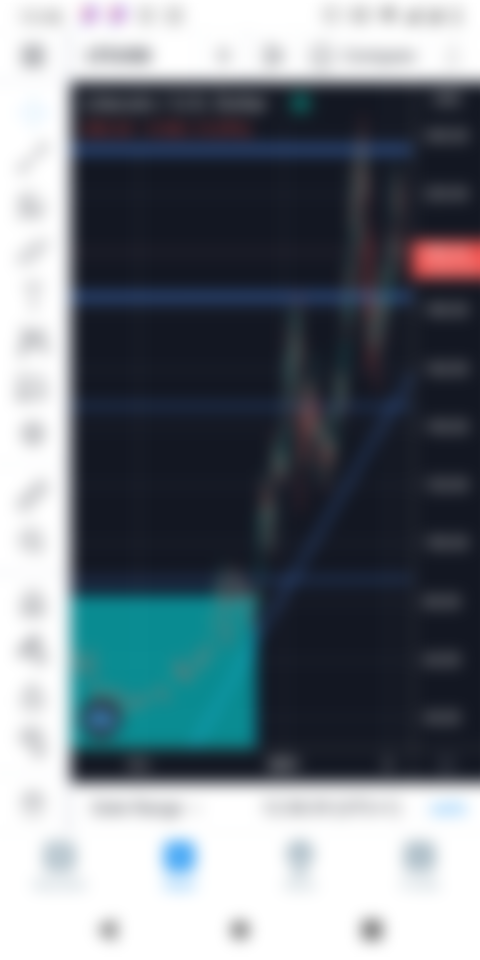

Most of 2020 had LTC in a range. My view on this range are astronomical and astrological but that's another days writing. We can clearly see here that LTC needs to breakout to the upside in order to balance it's long time imbalance and we are buying. It's only a matter of the but for now careful low time observations will alert us on the major outbreaks.


This chart has much clearer lines of support and resistance. Much like the Fibonacci, LTC seem to be retracing in 20 price units. LTC seem to be going to 180 but the target stop is 240-260 before 400. I personally will just wait for my bull runs. A bounce off the 180 last kiss will be the perfect entry.

My interest in LTC grew when I found that LTC has some of the cheapest transfer rates in all the cryptocurrencies. BCH is not bad and doge also does some justice but transfer rates for BTC and Ethereum are just crazy, it's like +20 for all transactions. A careful observation when doing transactions is vital for survival and maintenance of investments.