The Bitcoin (BTC) price has been consolidating since the initial rejection on Jan. 25.
The direction of the short-term Bitcoin trend is not clear, but a bounce toward the $33,700 area seems like the most likely scenario.
Bitcoin Continues Indecision
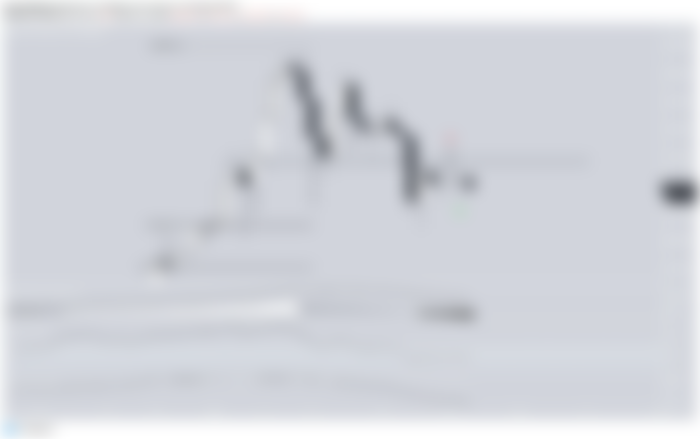
After the rejection on Jan. 25, BTC showed some strength in creating a candlestick with a long lower wick and a slightly bullish close.
Nevertheless, the wicks on each side are a sign of indecision. This suggests further consolidation before a significant movement in one direction.
Technical indicators are bearish and BTC is trading just below the resistance area at $33,700. Conversely, the closest support area is found at $29,000.

Approaching Resistance
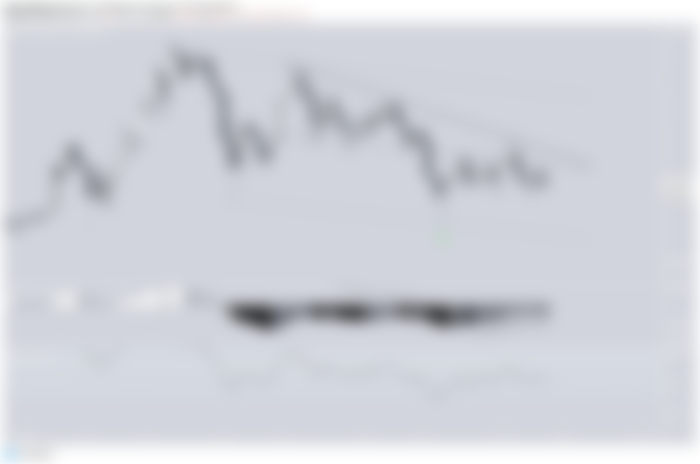
Bitcoin is likely trading in a parallel descending channel of sorts, which is usually a corrective structure. Currently, BTC is facing resistance from the middle of the channel and a possible descending resistance line, which has been validated multiple times up to this point.
BTC would have to move above $33,200 in order to overtake both resistances and decisively break out.
Technical indicators are gradually turning bullish but have not confirmed the possibility of a breakout yet.

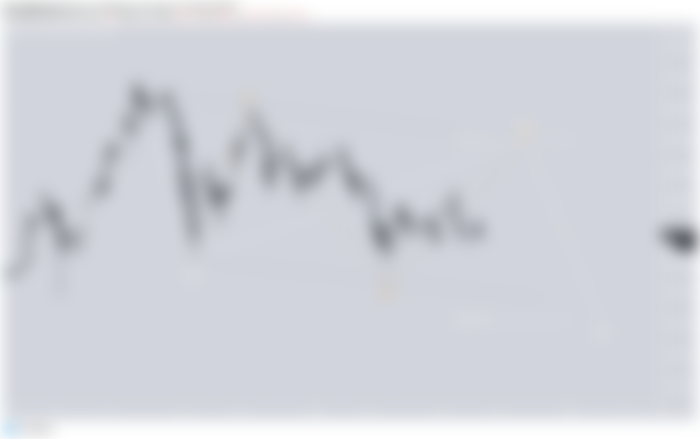
The two-hour chart shows signs of a reversal since the RSI has generated some bullish divergence.
It would make sense for BTC to at least tag the resistance line once more, before deciding on a breakout or breakdown.


BTC Wave Count
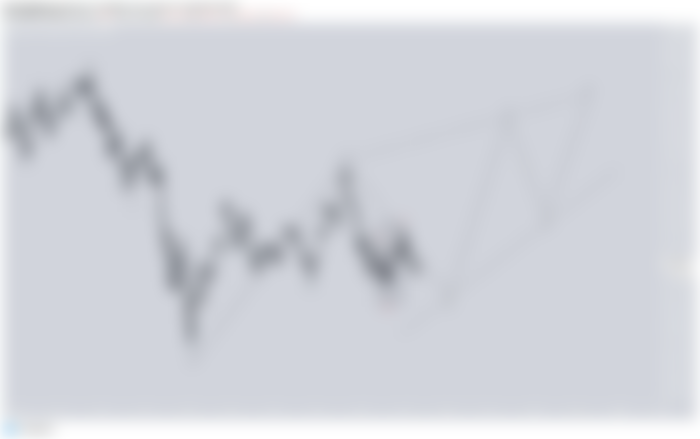
While the long-term count is bearish, projecting a decrease toward $28,000, the medium-term count suggests that another upward move is likely before BTC drops toward the target.
The best-case scenario would have the C sub-wave (orange) increase all the way to the top of the channel at $38,000. However, it’s entirely possible that the sub-wave makes a lower high since the move is still in its early phase.

A part of the movement that is the most easily discernible is the irregular flat from yesterday, which suggests BTC is not yet done correcting.
Therefore, it would make sense for BTC to sweep yesterday’s lows before potentially moving higher once more. It’s very likely that the aforementioned C sub-wave is an ending diagonal.

Conclusion
While the direction of the trend isn’t clear, the most likely scenario suggests that Bitcoin will bounce once more before a significant drop transpires.