Whether you've been following cryptocurrencies since the early days of Bitcoin or you've just landed in the world of cryptocurrencies, you are probably aware of the interesting moves that the cryptocurrency markets have been experiencing lately. For example, Bitcoin has received enormous attention since its price hit a new all-time high of over $ 65,000 on April 14, 2021. However, if you look at the spikes and falls that led up to this moment, as well as what What happened next, you will be able to tell that there is a specific graphic pattern.
If we carefully analyze the operations carried out by both institutional investors and whales, we can know the intentions that they have executed throughout each market cycle. Broadly speaking, market cycles are driven by "smart" money to acquire "weak" money from average investors. To anticipate the movements that great traders will make to provoke impulsive decisions in the market is where the Wyckoff method is useful.
What is the Wyckoff method?
was developed by Richard Wyckoff, an American writer and stock market investor. Throughout his career, he became known for tracking the investment flow of institutional funds and offering guidance to investors and traders to help them avoid institutional influences. His analysis and techniques led him to create the Wyckoff Market Cycle .
The objective of the method is to follow the ebb and flow of the market and anticipate periods of accumulation and distribution. He named the influence of institutions and other large market players as the Composite Operator and posited that the technique helps people to predict and understand what the Composite Operator thinks, as a whole.
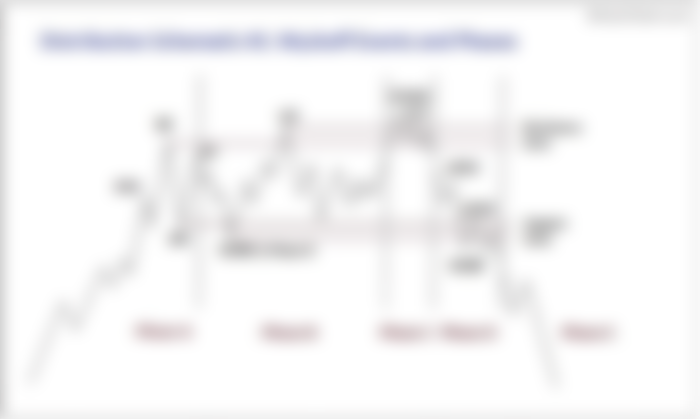
Schematics
The Wyckoff method comprises four schemes. These four phases are the cause of the growth or decline of a market or asset. The phases are: the accumulation phase, followed by the uptrend phase, the distribution phase and the downtrend phase.
The accumulation phase begins with the increase in demand from the Composite Operator. The Compound Trader and the bulls look to increase their positions and then push prices higher. When prices start to rise, the uptrend phase begins and leads to the distribution phase. When a new high is reached, the opposite of the accumulation phase occurs. Compound Traders and market short sellers seek to walk away by selling and making their profits. The sell-off creates a downward capitulation known as a downtrend phase, where the price falls until another build-up phase occurs.
Wyckoff's five-step approach
Within the accumulation and distribution schemes of the Wyckoff method, five different phases occur. Since we've written this article after the first signs of a build-up phase, we'll start there.


Source: Stockcharts.com
Phase A: At the extreme of a large capitulation, there is a distinctive increase in trading volume, indicating preliminary support (PS). However, the efforts of this support do not prevent the trend from reaching a sell climax (SC), and we see large bearish candlestick charts emerging from panic. Automatic purchases and active purchases cause an automatic rally (AR), and traders can take advantage of falling prices.
These two minimum and maximum points of the SC and the AR usually mark a trading range in which the accumulation phase will occur. The end of Phase A occurs after a secondary test (ST) occurs after the AR, which lowers the price again to indicate that the accumulation scheme has not ended.
Phase B: after the secondary test there is a period in which the Composite Trader is better able to accumulate the underlying asset. As the trading range is tested, premature bullish and bearish traps can occur, leaving opportunities for the Composite Trader to take advantage of.
Phase C: The end of phase B may be determined by a definitive bearish trap, designed to scare investors into selling. It is known as a spring, and it can occur before the troughs begin to rise in prices. Just because there is no noticeable bearish trap or spring does not mean that the rest of the scheme will not happen.
Phase D - This is the transitional stage and the last chance for investors and traders to buy at lower prices. As the lows are increasingly priced, there is eventually a last point support (LPS), which constitutes the highest low before the market breaks through the resistance levels.
Support signals (SOS) are made where previous resistance prices used to be, turning them into new support. As support levels rise, a further uptrend eventually occurs, leading to phase E.
Phase E: a clear exceeding of the trading range means a growth in market demand. Investors are encouraged to see that the low accumulation phase is over, and buyers flood the market with confidence, and an uptrend ensues.

Source: Stockcharts.com
The distribution scheme has phases similar to the accumulation scheme, but where many of the same events occur in the opposite direction.
Phase A: Along with the uptrend phase of the cycle comes the preliminary offer (PSY), which shows that the first opportunity to sell at a large profit is near. It is the buy climax (BC), where the Composite Trader and the short sellers sell in bulk for the first time, creating a new resistance line. The price falls until a new automatic reaction (AR) occurs, again pushing the price to a secondary test (ST).
Phase B: similar to that of phase B of the accumulation scheme, in the sense that now is when the Compound Trader will massively sell his investments and obtain profits from the phases of the previous schemes. Again, bearish and bullish traps can occur within the trading range. A push (UT) can also occur, briefly surpassing the BC, and defining a new resistance line.
Phase C: As with the accumulation scheme, this phase may or may not occur. A push after distribution (UTAD) could find a new high in the market. Whether it happens or not, phase D will end up occurring.
Phase D: It is the last point for investors to sell at higher prices before the price begins to capitulate. Typically, a last offer point (LPSY) appears in the trading range, then a buy / sell reaction occurs, and another LPSY is at or below the support line, triggering phase E.
Phase E: The bearish capitulation begins with a clear drop below the trading range as investors sell in bulk, decreasing demands and plunging the price.
How to adapt the Wyckoff approach to cryptocurrency futures
When it comes to using the Wyckoff approach in any type of trade, it is important to remember in the first place that no two cycles are the same. There are too many external factors affecting the markets for an automatic cut-off Wyckoff maneuver to occur every time.
It is crucial to be attentive to the phases of each scheme, specifically where phase A of each scheme occurs. This phase will mark the lowest or highest point (accumulation or distribution scheme, respectively) where you should place your stop-loss order.
The most effective time to place a trade is the accumulation phase E, when an upward trend is taking place. Keeping an eye on past trends is helpful in determining what phase you are in, potentially missing out on a new lPS or LPSY. Keeping an eye on trading volume can also help determine this time.
During the first four months of 2021, the cryptocurrency market went through a distribution phase, as demonstrated by Binance's BTCUSDT perpetual contract (chart above). As an investor, it would have been useful to notice the first rebound, ushering in a potential distribution phase.
This graph matches perfectly with the graph of the previous distribution phase and has each of the phases. In this cycle, it would have been beneficial to mark the support and resistance limits, define the stop loss, and prepare for the bullish spring (where the new all-time high occurred). At this moment of bullish spring, the candlestick charts were not green, indicating that the Composite Trader has started to sell in bulk, and a market correction is about to take place.
In any case, it is vital to keep an open mind about what is happening and which trend follows what, as basic charts are not always a 100% reliable guide. In this case, a thorough analysis is essential.
In summary
Wyckoff's market theory is based on analyzing markets through the eyes of institutional investors. The trader should consider their interests and behaviors in the ultimate goals of institutional traders and how current market behavior reflects their interests and behaviors.
Here's a step-by-step approach to applying the Wyckoff method to your next trade:
Understand and analyze the current market cycle. Is it a bearish or bullish market, or perhaps a sideways one? In trending markets, wait patiently for the next turnaround.
Mark the graph with events according to the accumulation and distribution schemes explained above.
Based on your analysis of the events, determine the phase of the schema.
Analyze volume and price action to study the trail of institutional funds.
Wait for the best opportunities to lengthen (or shorten) the risk / reward wisely, which usually appears in different setups in phases C and D.
Conclusion
The Wyckoff market cycle method is ultimately a more than useful tool for futures traders. Knowing the next movements and trends of the cycle is crucial to establish protective hedges, maximize uptrends and avoid losses for the Composite Trader.
If you do not want to limit yourself to hodl, and you are interested in futures, it is essential that you understand the movements of the market to be successful. In any case, be patient and watch with intention. Good luck merchants!
I hope you like it thanks for your time to read my Post a sincere hug