Best indicators for TRADING


There are ways to make money in the short term, the one we like the most and the indicators are key to making a profit.
▶️▶️▶️▶️SPANISH VERSION IN BLOG◀️◀️◀️◀️
The world of trading at first glance is a complicated environment, but with certain tutorials and good practice, it will be possible to master this attractive world. It has existed for a long time, it is where you can obtain benefits in certain actions that you invest in the commercial field, with the boom of cryptocurrencies it is another common for someone who does not want to stay in just the interests and seek to increase their capital or amount invested.


Of course, there is talk of risk, so you must be careful not to lose everything, that is why there are methods that are not 100% safe but do generate high hopes of profit if used well. Now the matter of when to buy or when to sell, those 2 buttons that involve your "bet" on leverage to see what you want should be used in the best way, whereas novices and even experts have had losses by not acting as it was in due time.
Without further ado, some indicators that one considers to be good when trading. For this reason, we are going to use the BTC/USDT balance from TradingView, which is the most complete for these models:
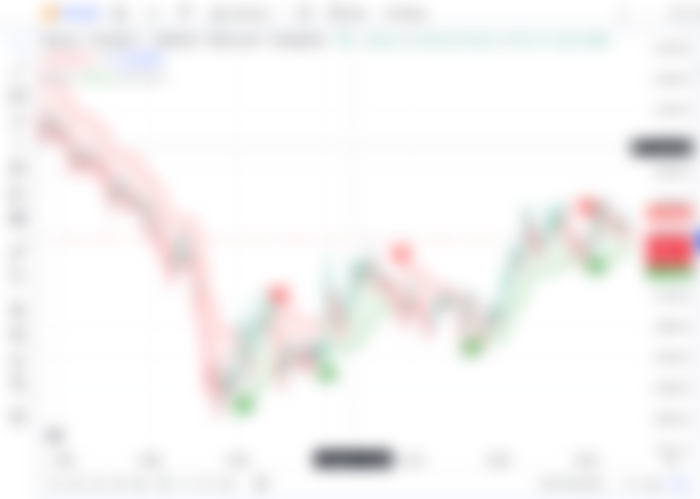
EMA- Moving Average Exponential
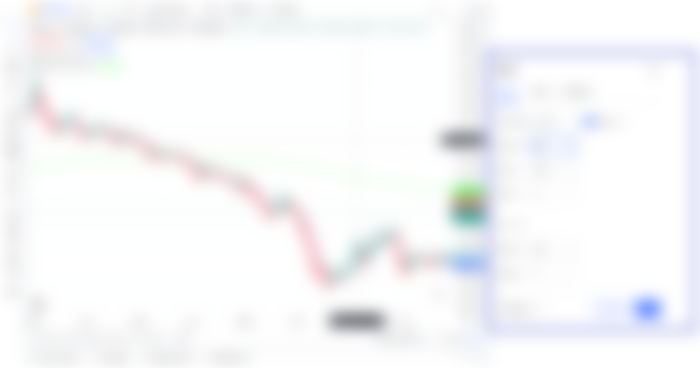

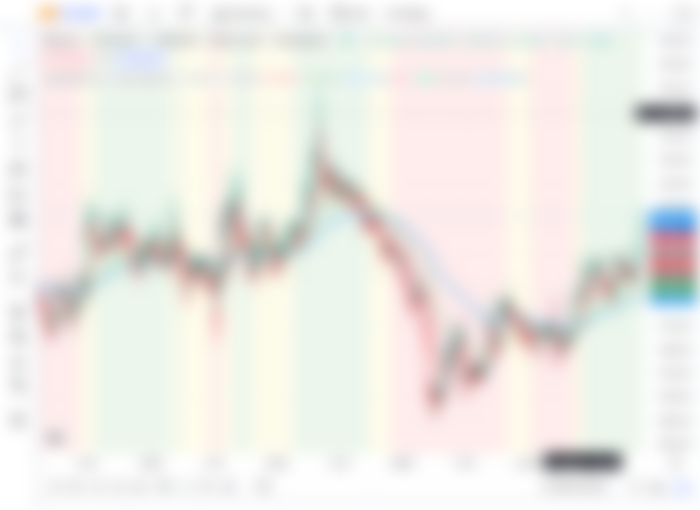
It must be without a doubt the most used by so many traders, its function is to indicate on a graphic line how the market trend is going. To be clearer, on the right, there is an option to configure the EMA where it says length is placed in "500" in the POV that line was placed in GREEN. If the line is above the price it means to sell, if it is above it is time to buy.
RSI- Relative Strength Index
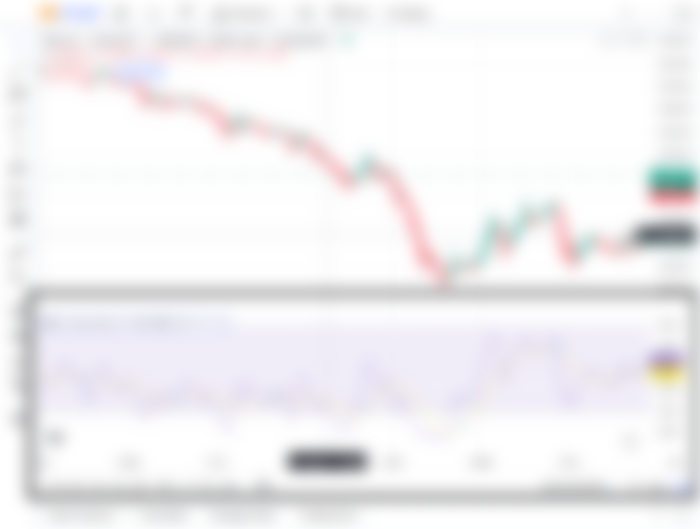
It is another template that helps to know the wave of the trend, but this time it defines when the situation is overbought, what will make the graph rise and when it is oversold, that the lines will go to the bottom. When these points touch the high or low, it means that the trend will go down so the short-term action is to look for what is indicated.
Stochastics
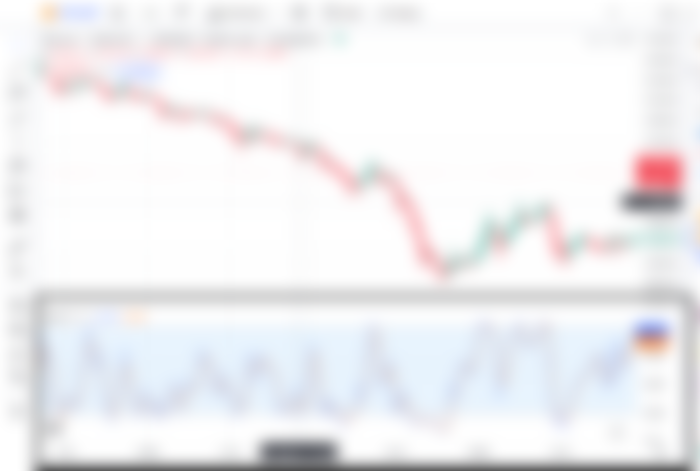

This indicator has similarities to the RSI, but with a much more accurate price analysis to know where the overbought or oversold is. As an advice, wait for the balance to reach 90 (overbought) to trigger the sale and when it is at 10 (oversold) to activate the purchase.
If you like this article, you can help us with your contribution and this inspires us for more content for you😋🤑🤑
Chandelier Exit
The great thing about this indicator is how direct it is to tell you when you can buy or sell, so measuring with the others mentioned to start BUYING or SELLING is the most accurate on the list.
Binary with Temito
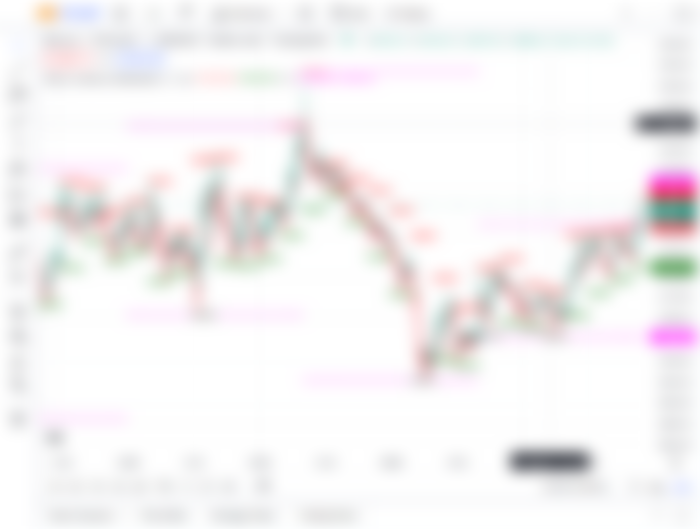
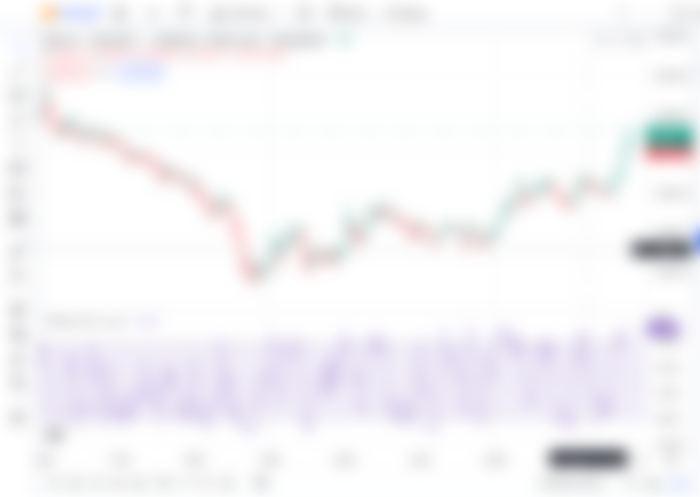
It tells you at a certain time where the support and resistance of the price you are looking to sell or buy are found. You can see both ends in purple to know where that price will be around, as well as in green (buy) and red (sell) the action to be taken.
Scalping Pullback
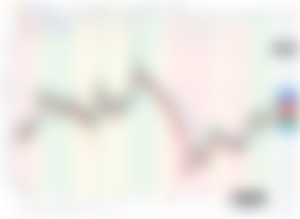
It may turn out to be another alternative to the EMA, it even has an inspiration for this project, where it follows a similar pattern with more variants as you can see in the image, the blue line shows when it is time to buy or sell depends on the skill of the trader.
Williams Percent Range

It does not refer to the Formula 1 team (bad joke) it has functions similar to the RSI where you can see when the purchase or sale reaches its high point for... what has been said in this type of situation, make the opposite option.
STC Indicator
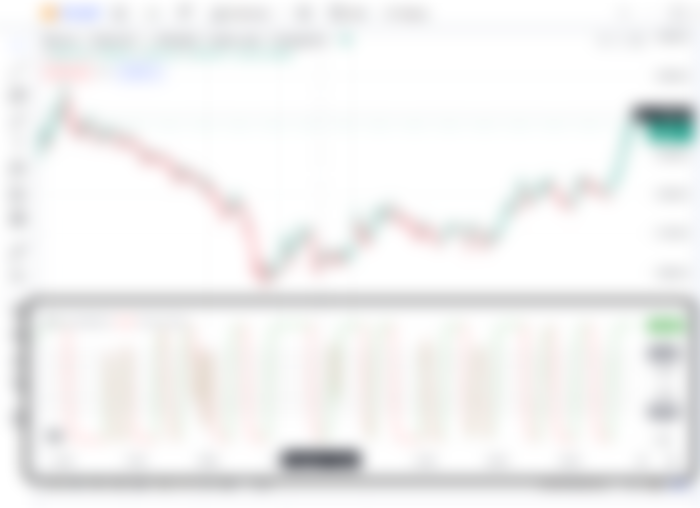
If you like to have a direct option that tells you on linear graphs when to buy or when to sell, the STC is another great option for the occasion, as follows the theme when it is high you should wait for the fall and sell when it is in the Bottom line, it's time to buy.


If you have more experience, you can tell others who seem more suitable for success, so we are open to any opinion.


Looks quite technical but worth having a look at, I generally prefer to hold my assets for the long term but maybe I can have a think about using some of these indicators to do some short term trading too.