Hello Everyone, today I would like to explain how divergences work. Divergences are one of the most important tools because they signal momentum coming into the main trend or indicate a possible reversal when the trend is nearly over. I will just show you a general overview of the different types of divergences.
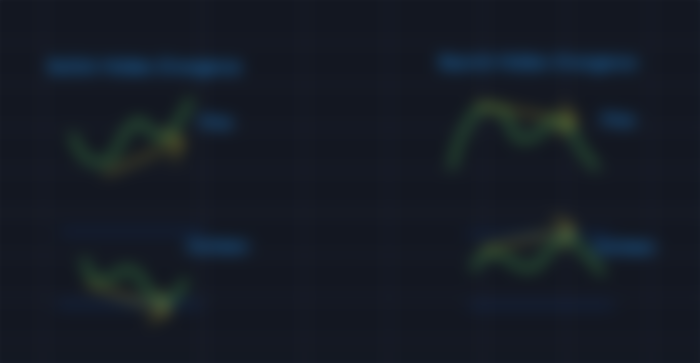
So we have two main types of divergences: Bullish Divergences and Bearish Divergences

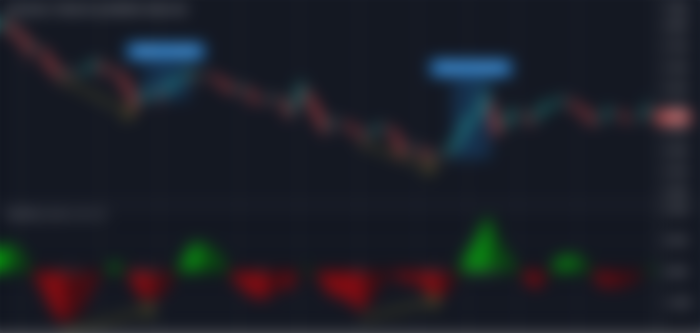
Bullish Divergence is going to be comparing lows in price to lows in the oscillator. What you are going to see is the price continues to go lower and you also see that your oscillator created a higher low. So we are going to see the price action going lower but the oscillator going higher and that's going to give us a kind of upward bounce potential that we are looking for to enter a long. Here is an example:
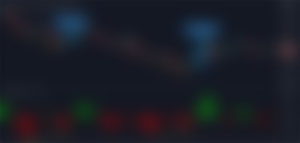
Bearish Divergence is going to be comparing highs in price to highs in the oscillator so if we see the price continues to go higher and your oscillator created a lower high then when you are in an uptrend and you see this that's a great place to take profit. If you in a downtrend this a great place to enter a short position. Here is an example:
So that was the standard version of each one. Now the way where it gets confusing is standard divergences versus hidden divergences.

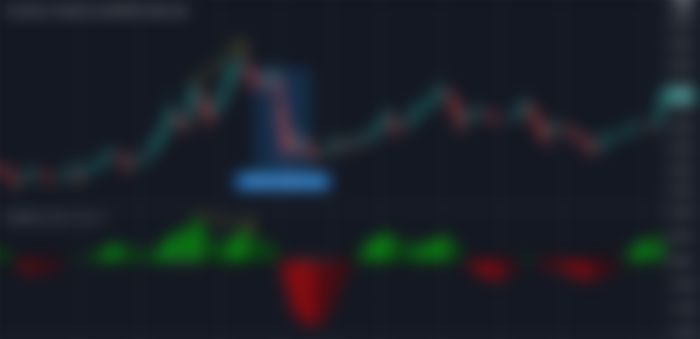
Bullish Hidden Divergence is when the price created a higher low and the oscillator created a lower low. Basically what this is saying is despite even more bearish momentum the bulls are actually able to keep the price at an even higher level which is telling us that price will go even higher. As you can see a hidden divergence is in favor of the trend whereas a standard divergence is a counter-trend. Here is an example:
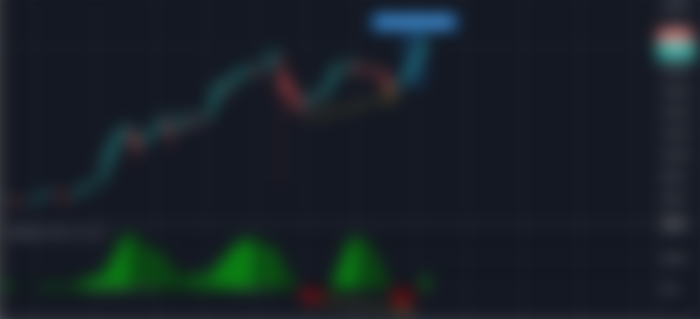
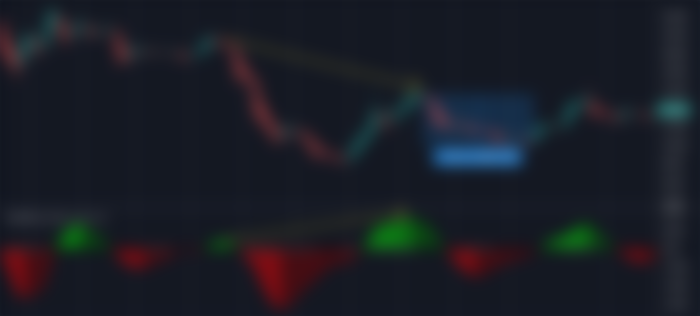
Bearish Hidden Divergence is when the price created a lower high and the oscillator created a higher high. So this is a downward pressure scenario where the price failed to create a higher high and there is even more cell pressure pushing down on the price so basically the market is going down and the momentum is telling us that it is going to keep going down whereas with the standard bearish divergence we were going up, but the oscillator is telling us that we are going to go down. Here is an example:

In the end, I would like to point out that if you are looking for divergences on your chart you should look for them on higher timeframes like 4 Hour, Daily, or even Weekly because the higher timeframe you use the better signals you can get.
For more articles check out my Publish0x account: https://www.publish0x.com/@Fizz-on-my-Jayce
You earned,one subscriber. Hope to read more of this :)