Note
The original article was granted open access licensed under creative commons (CC-BY) where you are free to copy, reuse, modify, distribute, commercial, etc, but required to give full citation:
Authors are Fajar Purnama (me) and Tsuyoshi Usagawa.
Title of the article is Using real-time online preprocessed mouse tracking for lower storage and transmission costs.
Published in Journal of Big Data, Volume 7, Number 27, Page 1-22, 10 April 2020, DOI is 10.1186/s40537-020-00304-x.
Available at https://journalofbigdata.springeropen.com/articles/10.1186/s40537-020-00304-x.
Althought it is already fully available online, I would like to rewrite it in .html and share to as many platform as possible. Who knows if the original site goes down? Also, I have a circumstance to read it all over again and why not rewrite it at the same time to make it more fun. Eventhough the original is licensed CC-BY but the rewritten version I will license as customized CC-BY-SA where you are also allowed to sell my contents but with a condition that you must mention that the free and open version is available here. In summary, the mention must contain the keyword "free" and "open" and the location such as the link to this content.
Abstract
Pageview is the most popular webpage analytic metric in all sectors including blogs, business, e-commerce, education, entertainment, research, social media, and technology. To perform deeper analysis, additional methods are required such as mouse tracking, which can help researchers understand online user behavior on a single webpage. However, the geometrical data generated by mouse tracking are extremely large, and qualify as big data. A single swipe on a webpage from left to right can generate a megabyte (MB) of data. Fortunately, the geometrical data of each x and y point of the mouse trail are not always needed. Sometimes, analysts only need the heat map of a certain area or perhaps just a summary of the number of activities that occurred on a webpage. Therefore, recording all geometrical data is sometimes unnecessary. This work introduces preprocessing during real-time and online mouse tracking sessions. The preprocessing that is introduced converts the geometrical data from each x and y point to a region-of-interest concentration, in other words only heat map areas that the analyzer is interested in. Ultimately, the approach used here is able to greatly reduce the storage and transmission cost of real-time online mouse tracking.
Introduction
We are living in the age of information where information and communication technologies are becoming mainstream [1]. Computers and the Internet have become inseparable from our daily lives. It is now possible to do many things without the need to travel and wait; examples include, long-distance communication through online text, voice and video calls, social interaction via social media, online learning, ecommerce or online shopping, and many forms of entertainments such as online music, online videos, and online games. Most importantly, the Internet has become the primary source of information around the world.
We are living in the age of information where information and communication technologies are becoming mainstream [1]. Computers and the Internet have become inseparable from our daily lives. It is now possible to do many things without the need to travel and wait; examples include, long-distance communication through online text, voice and video calls, social interaction via social media, online learning, ecommerce or online shopping, and many forms of entertainments such as online music, online videos, and online games. Most importantly, the Internet has become the primary source of information around the world.
We are living in the age of information where information and communication technologies are becoming mainstream [1]. Computers and the Internet have become inseparable from our daily lives. It is now possible to do many things without the need to travel and wait; examples include, long-distance communication through online text, voice and video calls, social interaction via social media, online learning, ecommerce or online shopping, and many forms of entertainments such as online music, online videos, and online games. Most importantly, the Internet has become the primary source of information around the world.
Although eye tracking remains a tool for the laboratory, an alternative method has been invented, mouse tracking [7]. Instead of eye movements, mouse tracking tracks mouse movements and other helpful events. The fundamental strategy of mouse tracking is the recording of mouse clicks, mouse movements, and scrolls. Eye and mouse tracking have been implemented in the fields of education [8, 9], reading patterns [10], search engines [11], visual navigation [12], web evaluation and usability [13, 14]. Mouse tracking can be treated either independently [15] or as a correlation to eye tracking [16] in other words, as replacement.
The biggest problem with default mouse tracking (as well as eye tracking) is the huge volume of data generated, which can be categorized as big data [17, 18]. This high volume is due to the use of geometrical data where each event that occurs on each point of the webpage is recorded. If the distance between left and right is 1000 pixels, then a swipe from left to right will generate 1000 rows of tables. However, analyst may not need all of the mouse tracking data that is generated. Therefore, this paper proposes preprocessing the data based on the analyst’s needs. The preprocessing in this case determines the region of interest in other words; which area the tracking should capture rather than capturing each point of interest. Furthermore, the preprocessing is conducted not only online, but also in real-time mouse tracking session.
Related Work
Implementations of eye and mouse tracking
The use of eye [19] and mouse [20] tracking began in the early 20th century, and since then, there have already been many laboratory experiments conducted using these technologies. Today, there are many attempted implementations of eye and mouse tracking, but it is unclear how widespread and long-running they are. For eye tracking, there is no chance of implementation outside laboratory unless one of two requirements is met: (1) affordable and mainstream hardware [6] or (2) optimal usage of web cameras [21, 22] on laptops and/or cameras on smartphones. By contrast, widespread implementation of mouse tracking is already possible because the required hardware is available by default in all computers and smartphones, but the problem is the generation of big data (the same is true of eye tracking as well).
The following are selected attempts at implementation eye tracking:
Adaptive E-Learning via the Eye Tracking (AdELE) frame-work, adaptive, integrated, and real-time eyetracking during e-learning processes [8, 23].
Eye tracking based emphatic software agent (ESA), an eye tracking software that captures the state of awareness of the learners and responds accordingly [24].
Enhanced exploitation of eyes for effective e-learning (e5Learning) [25].
Eye tracking based adaptive and personalized e-Learning Systems (AeLS) [26].
Eye tracking based Eye tracking based programming tutoring system (Protus) [27].
The following are selected attempts at implementation mouse tracking:
A mouse tracking web application developed by Zushi et al. [9] for their own specific learning management system (LMS).
Moodle LMS mouse tracking plugin [28,29,30].
Mouse tracking web browser plugin and client side programming script [31, 32].
Some commercial and open source software programs are as follows:
Open Gaze and Mouse Analyzer (OGAMA), an open-source software designed to analyze eye and mouse movements in slideshow study designs [33].
Mousetrap, an integrated, open-source mouse-tracking package on OpenSesame for laboratory experiments [34].
Known commercial applications: Lucky Orange, Hotjar, Crazy Egg, Fullstory, Ptengine, Heatmap.com, Smartlook, ContentSquare, SessionCam, Seevolution, Capturly, Inspectlet, MouseFlow, Clicktale, and Tamboo [35].
Mouse tracking in web development
The core of mouse tracking in web development is document object model (DOM) which is an application programming interface (API) for Hyper Text Markup Language (HTML) and Extensible Markup Language (XML). It defines the logical structure of documents and the way a document is accessed and manipulated. Supposed a simple HTML page with the codes on Table 1, the DOM structure can be represented on Fig. 1. With the Document Object Model, programmers can build documents, navigate their structure, and add, modify, or delete elements and content. Anything found in an HTML or XML document can be accessed, changed, deleted, or added using the Document Object Model, with a few exceptions. DOM is designed to be used with any programming language. Currently, it provides language bindings for Java and ECMAScript (an industry-standard scripting language based on JavaScript and JScript) [36].
Table 1 A web page code in simple HTML that contains html, head, title, body, p, and footer tags
<html>
    <head>
        <title>Simple Webpage</title>
    </head>
    <body>
        <p>Hello World!</p>
    </body>
    <footer>
        <p>CC</p>
    </footer>
</html>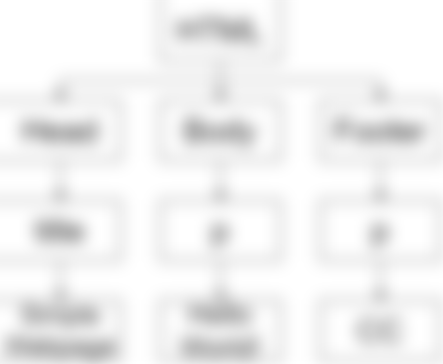
Fig. 1 DOM representation of Table 1. The html tag is the parent with head, body, and footer tag as the children. Head has a child tag title, body has a child tag p, and footer has a child tag p
The implementation of mouse tracking is based on DOM events, specifically mouse, touch, and user interface (UI) events which are actions that occurs as a result of the user’s mouse actions or as result of state change of the user interface or elements of a DOM tree [37]. Our previous work [31] uses jQuery to access the DOM API and receives information that are related to mouse, touch, and UI events. They can be stored into default dynamic variables or in an ArrayBuffer for enhanced performance. The list of events are as following:
Mousedown: when either one of the mouse buttons are pressed (usually left, middle, or right button)
Mouseup: when either pressed mouse buttons are released
Mousemove: when the mouse cursor moves
Mouseleave: when the mouse leaves an element (we only indicate when temporary leaving a webpage)
Mouseenter: when the mouse enters an element (we only indicate when temporary entering a webpage)
Beforeunload: when the webpage almost closes
Scroll: when the webpage scrolls
Touchstart: when a computer device screen is touching
Touchend: when a touch from touchstart is removed
Touchmove: when a touch is moving
Touchcancel: when a touch is interrupted
Resize: when the webpage is zoomed in or out
The information is then processed by adding important labels such as the date of the received information and duration by calculating the difference between the current and previous received events. Finally the information is either stored locally or sent to a server using hyper text transfer protocol (HTTP) post method. Traditionally, the information is transmitted all at once at the end of the session, but in our study [31], we found that it is better to transmit them in real-time without delay. The difference between offline, regular online, and real-time online mouse tracking is shown in Fig. 2.
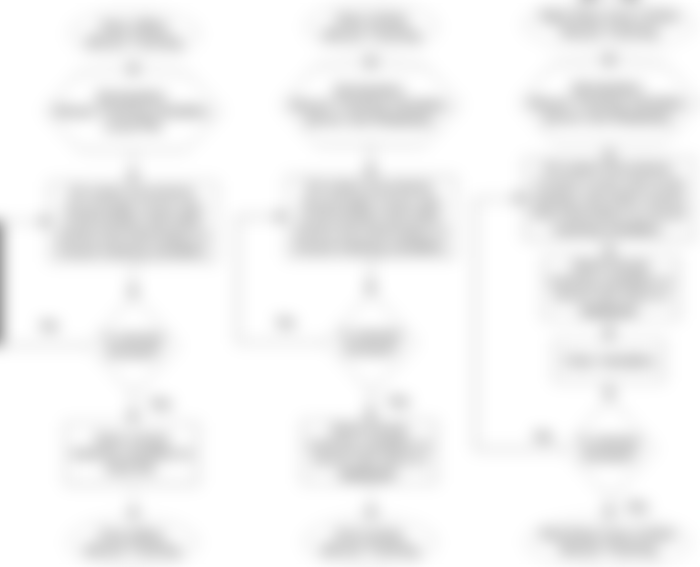

Fig. 2 Flow chart of traditional and current mouse tracking method [31]. The left flowchart is offline mouse tracking, the middle flowchart is regular online mouse tracking, and the right flowchart is real-time online mouse tracking
Default eye and mouse tracking generates big data
Although eye and mouse tracking are not yet mainstream, rumors spread that due to large amounts of data generated, they could not be widely implemented other than at big corporations such as Google and Microsoft, which have gigantic data centers. University network and server administrators are hesitant to implement tracking technologies because they not only generate massive amounts of data, but also eye and mouse tracking are not replacements for existing systems but rather additions. Huang et al. [11] performed a mouse tracking experiment on Bing’s search engine and immediately reduced the sampling rate because the data were too large.
Leiva and Huang [38] believed that a swipe could generate a megabyte of data and the authors further investigated and proved that rumor to be true. While a half-year of Moodle log data with approximately 40 students is only approximately 300 kilobytes (kB) [39], mouse tracking data and other event data generated by approximately 22 students reaches approximately 100 megabytes (MB) in only 2 h [31], and that figure will double if eye tracking is included. Imagine how much data would be produced by a university with a large number of students if mouse tracking were running on its website for years.
According to an article by Adekitan et al. [40], Nigerian University Internet traffic can reach terabytes (TB) in a week and is regarded as big data. The authors’ previous mouse tracking session [31] also reaches the same level of Internet traffic if over 100 students are present. Other than volume, mouse tracking met the other 5Vs criteria of big data [17]: velocity, the amount of data generated especially in real-time which is explained in further sections, veracity; meaning that data loss may often occur due to limited connectivity, which can lead to inconsistent data; variety, which is discussed in further sections and previous work [31]; and value, which is discussed in the next paragraph.
It would be wise to start investing in eye and mouse tracking just as big companies today are investing in big data [41], as the data generated by eye and mouse tracking are valuable. By analyzing big data, interesting information can be derived that gives us the knowledge needed to make optimal decisions [42]. Just as companies study customers’ data to find opportunities to increase their revenues [43], traders analyze historical trading data and current sentiments to find optimal positions [44], researchers study optimal prevention, diagnosis, and treatments in Medicare [45], and planners monitor smart cities [46], researchers can use eye and mouse tracking to identify online viewers’ attention, behavior, their evaluation of web contents, etc.
Reducing eye and mouse tracking data
During high-intensity activities, a user may generate an average of 70 or 70 events per second [47], meaning that 70 rows per second will be generated on a table. The traditional way of reducing the size of these tracking data is by reducing the sampling rate [11]. Furthermore, the sampling rate should be adaptive and not static. In other words, snapshots should only be taken when an event occurs such as when the mouse cursor moves or a click occurs, and snapshots should not be taken during idle sessions. Performing transmission in real-time helps distribute the transmission burden across time, avoiding bottlenecks. In other words, the tracking data are immediately transmitted to the server at each event occurrence rather than transmitting the mouse tracking data all at once at the end of the session. Compression methods can also be utilized as demonstrated in Leiva and Huang’s work [38], but their transmission method is still likely not real-time and is suspected to transmit the compressed tracking data all at once in the end of each session.
On the other hand, the preprocessing technique presented in this paper is designed to work in real-time. Not only does it reduce the data cost but also distributes the transmission burden across the time domain. The cause of the enormous data generation is the geometrical data or tracking of each location where the events occur, in other words the x and y coordinates. Tracking these coordinates provides rich data but sometimes all of that data is not needed. For example, Rodrigues et al. [28] only analyzed the amount of key up, key down, mouse down, mouse up, mouse wheel, and mouse movement to measure students’ stress, and Li et al. [48] only needed the time spent on each page. In such cases, the geometrical data can be omitted.
At other times, geometrical data are needed; however, it is not each precise x and y point that is needed but rather each area of the page (multiple points) [49]. Preprocessing is common in any data analysis to derive useful data prior to transmission and storage of the collected data. However, the preprocessing presented in this work is performed on the client before transmission and storage to reduce the server’s burden. Unlike typical preprocessing which is performed to filter redundant data, the preprocessing in this work is specifically based on the demands of the administrators or analyzers; in this case, preprocessing omits the geometrical data or groups them to represent certain areas. This study is a complete work of one the author’s previous works [50].
Method and simulation
System overview
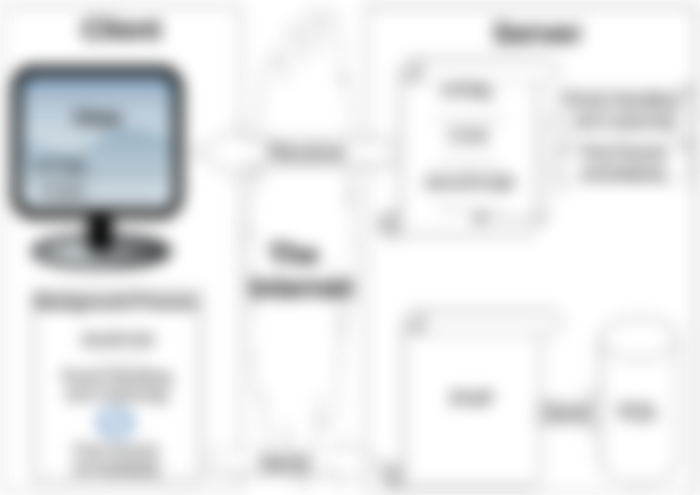
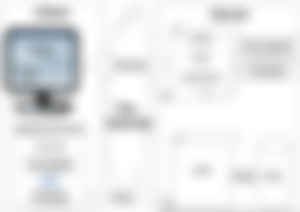
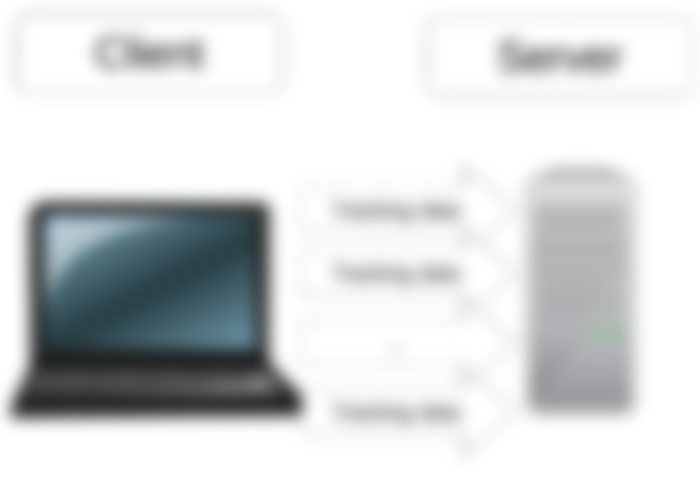
Fig. 3 System overview of mouse tracking data transaction [31]. The framework is divided into two sides: one side is the client and the other side is the server. The client and the server are connected via the Internet. The webpage is in the server consisting of HTML, CSS, and JavaScript. The mouse tracking codes, which are event handling and capturing the command to post its data to the server, are inserted in the JavaScript section. When the client accesses the webpage, it will view the contents that consist of HTML and CSS. The mouse tracking codes within JavaScript are run in the background. The mouse tracking data are sent to the server and processed using server programming language, in this case PHP. Finally, the data are sent to the database; in this case, in SQL
The overall system is the same as in the authors’ previous work [31] with the concept discussed in "Mouse tracking in web development" section. In this section, the implementation of the concept to system is discussed. As shown on Fig. 3, mouse and other event tracking are performed on the client. The tracking codes can be injected internally, for example, as a browser plugin, or externally, for example, where the codes are retrieved alongside the webpage content [HTML and cascading style sheets (CSS)]. Then, the client sends the tracking the data to the server to be stored. The code itself for this work is written in jQuery, which is a simpler coding format of JavaScript for DOM manipulation. The external code can be written as a plugin if desired; for example, the authors wrote a Moodle plugin. The server side can be in any programming language, but in this work, PHP was used, and the database used MySQL. The codes are available on GitHub [32].
Each web framework may developed their own bindings to access the DOM API. However, the most fundamental implementation is still injecting the mouse tracking code into the script section no matter which web framework is used, which is the default option if the web framework did not developed their own bindings. Below is a list of few web frameworks:
NodeJS is browser JavaScript made into server side programming language. Also, NodeJS is written based on the criticism in 2009 about how Apache HTTP server handled huge concurrent user, sequential programming, and blocking functions [51] while NodeJS is asynchronous and is designed to build scalable network application. Additionally, its runtime is built on Chrome’s V8 Engine which implements C++ features such as hidden classes and inline caching to make JavaScript runs much faster [52]. The popular web framework for NodeJS is Express which is a fast, unopinionated, minimalist web framework for Node.js [53]. The choice for implementing mouse tracking code can either be using developed module available on Node Package Manager (NPM), use TypeScript, or the default option. TypeScript is a typed superset of JavaScript developed by Microsoft that compiles to plain JavaScript. The advantage for developers are defining interface between software components, and interactive static checking and code refactoring during development [54]. The default option is to call the scripts in the webpage layout which is usually written in Jade or Pug.
Django is a web framework written in Python that uses model-view template (MVT) [55]. Like Python almost every module is available, Django prides itself as a batteries-included framework, meaning that it comes with many modules unlike other frameworks, it is not necessary for a developer to write a module from a scratch. Although it is powerful for building huge web applications, the difficulty in building huge application doesn’t change when building small applications. For mouse tracking, there is a choice to use Python modules but it is not yet known whether it can interact with the DOM elements in the webpage. Most documentation suggests to use vanilla JavaScript in Django.
Django is a web framework written in Python that uses model-view template (MVT) [55]. Like Python almost every module is available, Django prides itself as a batteries-included framework, meaning that it comes with many modules unlike other frameworks, it is not necessary for a developer to write a module from a scratch. Although it is powerful for building huge web applications, the difficulty in building huge application doesn’t change when building small applications. For mouse tracking, there is a choice to use Python modules but it is not yet known whether it can interact with the DOM elements in the webpage. Most documentation suggests to use vanilla JavaScript in Django.
Django is a web framework written in Python that uses model-view template (MVT) [55]. Like Python almost every module is available, Django prides itself as a batteries-included framework, meaning that it comes with many modules unlike other frameworks, it is not necessary for a developer to write a module from a scratch. Although it is powerful for building huge web applications, the difficulty in building huge application doesn’t change when building small applications. For mouse tracking, there is a choice to use Python modules but it is not yet known whether it can interact with the DOM elements in the webpage. Most documentation suggests to use vanilla JavaScript in Django.
Django is a web framework written in Python that uses model-view template (MVT) [55]. Like Python almost every module is available, Django prides itself as a batteries-included framework, meaning that it comes with many modules unlike other frameworks, it is not necessary for a developer to write a module from a scratch. Although it is powerful for building huge web applications, the difficulty in building huge application doesn’t change when building small applications. For mouse tracking, there is a choice to use Python modules but it is not yet known whether it can interact with the DOM elements in the webpage. Most documentation suggests to use vanilla JavaScript in Django.
ReactJS is a JavaScript library for building UI which are maintained by Facebook and community. Unlike the previous back-end web framework, ReactJS is a front-end web framework. ReactJS have its own mouse event library which is to be injected on each UI [58].
Angular is a complete rewrite to TypeScript based from the same team that built AngularJS. It is a web framework mainly maintained by Google and by a community of individuals and corporations to address many of the challenges encountered in developing single-page applications. It is one of the most popular framework to build web applications on mobile. The mouse events can be added on the components or templates [59].
Three techniques of mouse tracking
Table 2 Event monitoring difference between default mouse tracking, whole page tracking, and ROI tracking. Second to fourth row contains the three different method of mouse tracking, the first column are the events, and the rest marks whether the events are available on the mouse tracking method or not
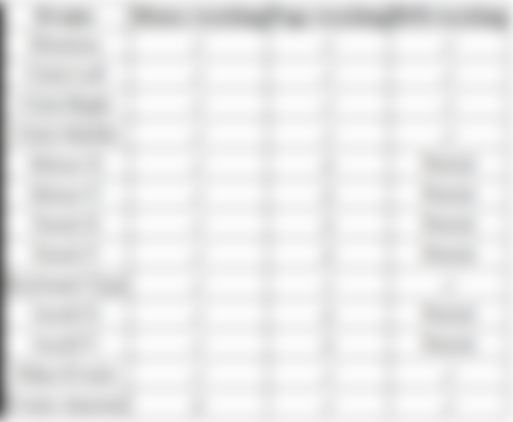
For convenience, the techniques of mouse tracking are divided into three types, as shown in Table 2. They are called default mouse tracking, whole page tracking, and ROI tracking. The default mouse tracking precisely records the geometrical data of the event occurrence such as the horizontal x and vertical y of left clicks, right clicks, middle clicks, mouse movements, scrolls, zooms, and if desired keyboard types. The duration between each event is also measured. Whole page tracking omits the geometrical data and summarizes the number of left clicks, right clicks, middle clicks, mouse movements, scrolls, zooms, and if desired keyboard types that occurred on the webpage. In other words, the amount of activity is measured but not where or when it occurs, and only the total amount of time that the user spends on a webpage is recorded. The most complicated task is ROI tracking, which is a gray area between default mouse tracking and whole page tracking. ROI tracking defines the areas of a webpage to be tracked, for example how many left clicks, right clicks, middle clicks, mouse movements, scrolls, zooms, and keyboard types occurred and how long they occurred on a header, menu, content, footer, etc. This method is ideal because it meets the analyst’s requirements and reduces unnecessary resource costs, but the drawback is the heavy labor required to manually define the areas of each webpage. Automatic area definition is possible to certain degree. One way is by attaching “mouseenter” DOM event listener to every element and using “offset” DOM HTML to return the position of the element. Offset DOM HTML returns the left and top element distance from the outermost of the webpage, and by using “width” and “height” DOM HTML to calculate the element’s size, it is possible to find the bottom and right as well. However, the limitation is that it cannot perform smart labelling where it can only extract attributes, texts, and values of the element. An illustration comparing the three types of mouse tracking is shown in Fig. 4.
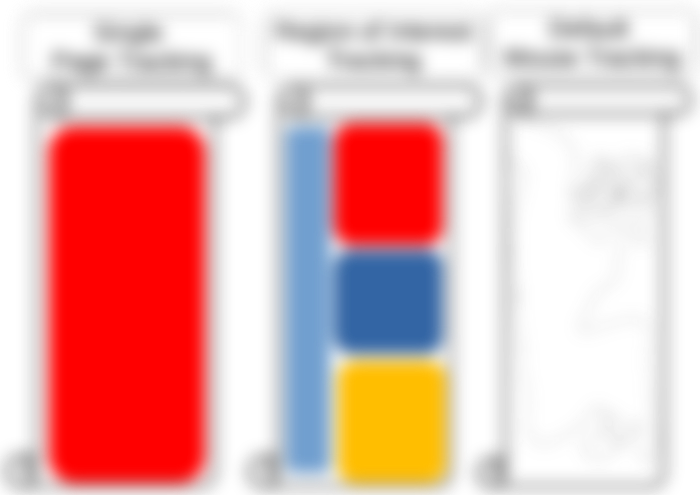

Fig. 4 Whole page vs region of interest vs default mouse tracking illustration. The left scroll illustrates whole page tracking that summarizes the number of events occurring on the whole page; the middle scroll illustrates ROI tracking that summarizes the number of events occurring in defined areas, and the right scroll illustrates default mouse tracking that records every event and the precise point where it occurs, forming a trajectory
Whole page vs region of interest vs default mouse tracking illustration. The left scroll illustrates whole page tracking that summarizes the number of events occurring on the whole page; the middle scroll illustrates ROI tracking that summarizes the number of events occurring in defined areas, and the right scroll illustrates default mouse tracking that records every event and the precise point where it occurs, forming a trajectory
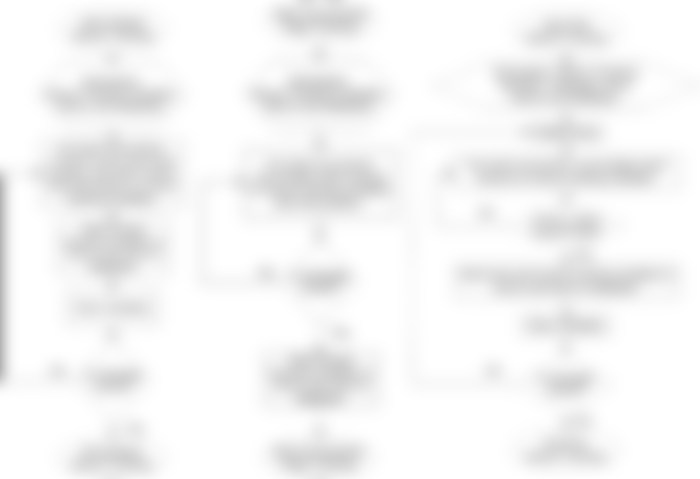

Fig. 5 Three Types of Mouse Tracking Flowchart. The left flowchart is default mouse tracking, the middle flowchart is whole page summarized mouse tracking, and the right flowchart is region of interest mouse tracking
The flowchart for each implementation of real-time and online mouse tracking is shown in Fig. 5. For default mouse tracking, the information on the event is transmitted to the database each time an event occurrs. For example, when a click occurs, the client immediately transmits the information on where and when it occurs. For whole page tracking, the information is summarized as the number of events that occurred, and they are transmitted to the server when the client closes the webpage. The size of the transmitted data is only slightly larger than that of transmitting single click data when using default mouse tracking. Last, for ROI tracking, the information on the webpage area is summarized and transmitted after the mouse cursor leaves the area, and the process repeats on each movement between areas until the webpage is closed.
Simulation
The three mouse tracking method are tested on the client and server. Since the author lacks subjects to perform an implementation, a simulation based on previous mouse tracking data was conducted on the server. The mouse tracking data contain mouse tracking records from two quiz sessions in Moodle. They were conducted on the 3rd of January 2019 between approximately 12:00 and 14:30 Japan standard time. There are 2 sessions, with each session lasting approximately an hour and including 22 students (44 total students participating) from the School of Engineering and Applied Sciences, National University of Mongolia accessing the Moodle server at the Human Interface and Cyber Communication Laboratory, Kumamoto University. The data were preprocessed to exclude nonstudents and webpages other than the quiz page data. In other words, the simulation is purely a mouse tracking data transmission, which excludes most of the process, such as accessing the server and navigating the whole Moodle page. This approach shows lower resource consumption than the previous work [31].
The setup can be seen in Fig. 6 where a laptop functioning as a client is peer to peer connected to a personal computer functioning as a server. The mouse tracking data are converted into page tracking and ROI tracking data based on Table 2. Three sessions were conducted: the first session was the sending of mouse tracking data to the server, the second session was the sending of page tracking data to the server, and the third session was the sending of ROI tracking data to the server. Since the mouse tracking data contain time interval information between the sending of each event, it is possible to capture the scenario almost exactly.
During these sessions, the data rate is observed, and the central processing unit (CPU) and random access memory (RAM) usages are measured on the server. Figure 6 shows that one laptop serves as a client to send the data to the server which is a personal computer. The client is an MSI Laptop with i7-7820 HK 2.9 gigahertz (GHz) x8 32 gigabyte (GB) RAM while the server is an i7-6850 HK 3.6 GHz x12 32 GB RAM personal computer and the peer to peer connection is a 10 megabyte per second (MBps) network.
For the client testing, the author performs the quiz session recorded by mouse recording software GhostMouse in order to replay the exact mouse events for the three mouse tracking types and for different browsers. The testing time are short around a minute due to the limited profiling time of the browsers. The performance which is only the JavaScript total running time of four different browsers are measured:
Chrome version 80.0.3987.132 that uses V8 Engine.
Firefox version 74.069 that uses SpiderMonkey Engine.
Microsoft Edge version 80.0.361.62 that uses Chakra.
Result and discussion
Table 3 Example default mouse tracking data that can be seen in the database table. Column 1–3 are labels added using JavaScript, column 4 is the duration calculated from the difference between dates, and the rest of the columns are data retrieved from the DOM API


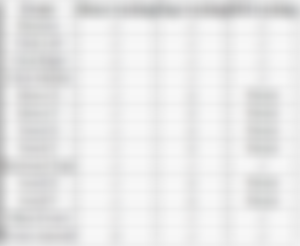
Table 4 Transmission server resource cost of three mouse tracking technique simulations. The first row are the mouse tracking method labels, the second row are the resource metric, and the first column are the statistical metrics


Table 5 Example page tracking data that can be seen in the database table. Column 1, 2 are labels added using JavaScript, column 3 is the duration calculated from the difference between dates, and the rest of the columns are total value of data retrieved from the DOM API


Table 6 Example ROI tracking data that can be seen in the database table. Column 1 - 3 are labels added using JavaScript, column 4 is the duration calculated from the difference between dates, column 5 is the area manually labelled by the administrator and the rest of the columns are total value of data retrieved from the DOM API


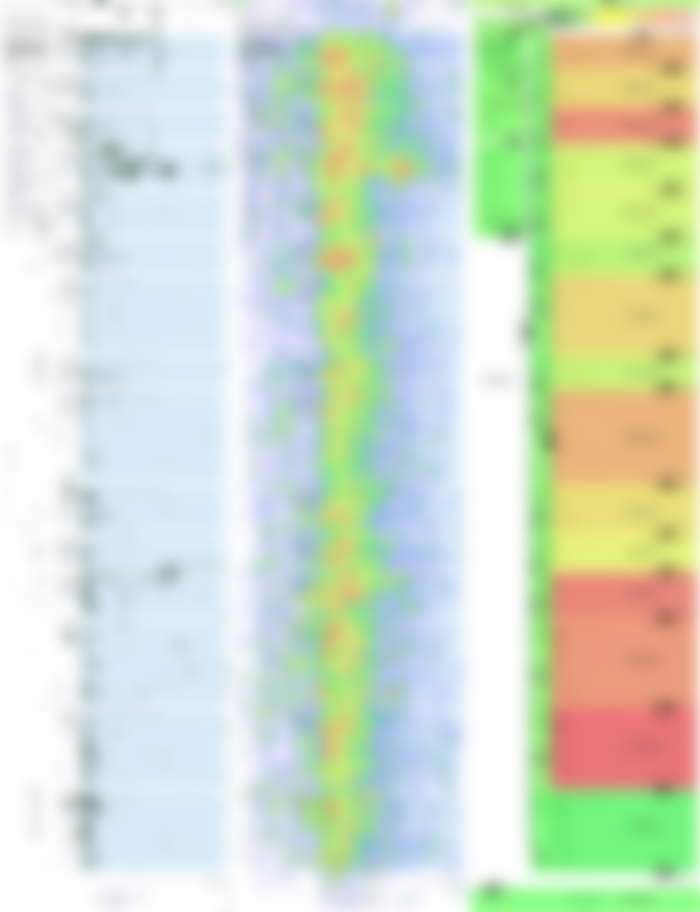
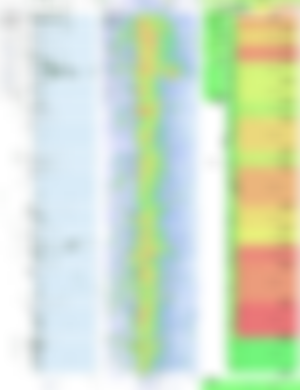
Fig. 7 Visualization of mouse tracking data. Default mouse tracking data can visualize exact points of location, the left image is click visualization and the middle image is a heatmap based on the duration the mouse cursor stays on each point, while ROI tracking can only visualize defined areas and show flows between areas shown on the right image
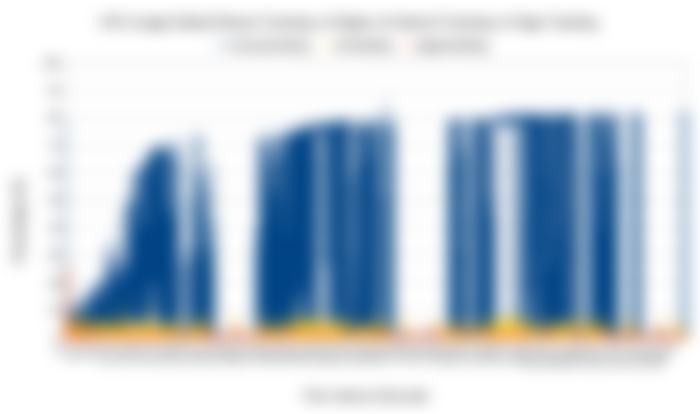

Fig. 8 CPU usage comparison between default mouse tracking, whole page tracking, and ROI tracking. The horizontal axis is the time interval. The vertical axis is the CPU usage in percentage
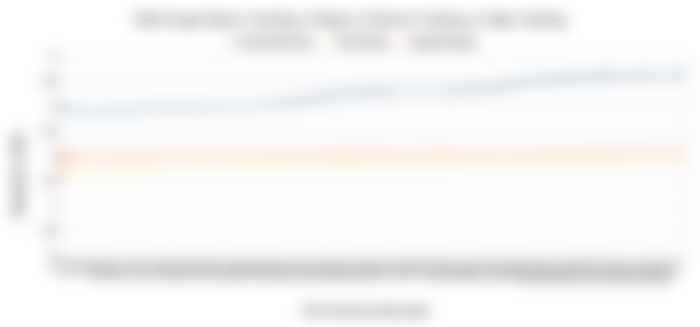

Fig. 9 RAM usage comparison between default mouse tracking, whole page tracking, and ROI tracking. The horizontal axis is the time interval. The vertical axis is the RAM usage in megabytes
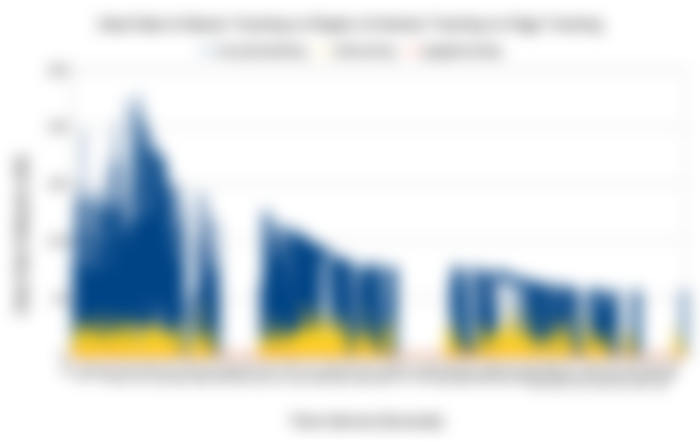
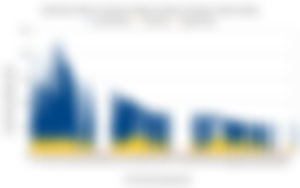
Fig. 10 Data rate comparison between default mouse tracking, whole page tracking, and ROI tracking.The horizontal axis is the time interval. The vertical axis is the data rate in kilobytes per second
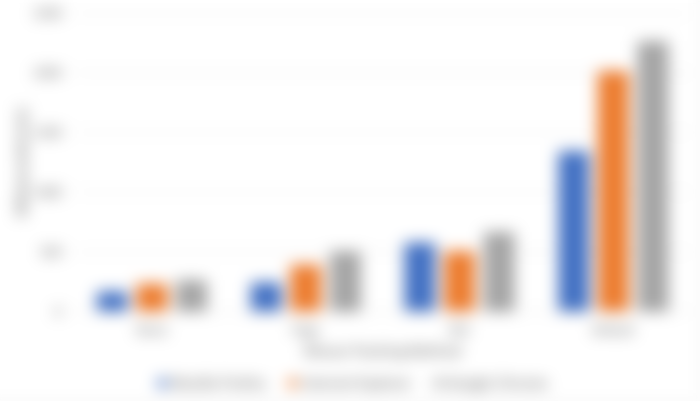
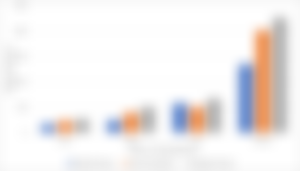
Fig. 11 The total script running time of three mouse tracking demo session by the author. The horizontal axis is the mouse tracking method. The data in order are from Mozila Firefox, Microsoft Edge, and Google Chrome. The vertical axis is the total running time in milliseconds. Among the three browsers Mozilla Firefox performs faster than Microsoft Edge and Internet Explore performs faster than Google Chrome for this work [60]
Default mouse tracking
It is well known that the advantage of default mouse tracking is the detailed and precise data it generates. An example is shown in Table 3. The exact x and y points of the locations of event occurrences, such as left clicks, right clicks, middle clicks, mouse movements, scrolls, zooms, and keyboard types, are recorded, including when and for how long each event occurs. Those geometrical data (x,y) make it possible to reproduce the mouse trajectory shown in Fig. 7, and adding the time information enables the trajectory’s replay.
The rumored disadvantage is the huge transmission and storage cost, and this seems to be true judging from Figs. 8, 9 and 10. For the 22 students in each session, the transmission resource cost statistics are shown in Table 4. The average data rate was 28 kilobytes per second (kBps) and was able to peak to 228 kBps. For the two sessions totalling 44 students, the data size was approximately 100 MB and Table 3 has 286511 rows. The CPU usage was hightly consumptive as well, while the RAM usage was not as consumptive. Even worse, mouse tracking is not a replacement for the existing logging method but rather an addition; in other words, it is expected to add an additional burden to the existing system if mouse tracking is implemented. These data were generated from a 2 1/2 h mouse tracking session; thus, imagine how much resource mouse tracking would consume if it were run on a university scale with thousands of students for 24 h daily. On the client the side, this method also shows the highest total JavaScript running in Fig. 11 among the other methods. It is suspected due to the large amount of HTTP Post to the server.
Webpage summarized mouse tracking
By omitting the geometrical data (x,y) and summarizing the numbers of events that occurred, the data became as small as possible, as shown in Figs. 8, 9, 10 (although they can be further reduced slightly by compression and removal of unnecessary characters and variables). The table was reduced to one row per webpage visit; in this case, Table 3 with 286511 rows was reduced to 26 rows, as shown in Table 5. As shown in Table 4, the data size was reduced from 100 MB to 16 kB. The average data rate was reduced from 28 kBps to 10 Bps. Although there is still RAM usage, CPU usage is slightly visible. Among the three mouse tracking methods mentioned in this work, this technique is the most advantageous in terms of resource cost. On the client the side, this method also shows the lowest total JavaScript running in Fig. 11 among the other methods. It is suspected due to the few amount of HTTP Post to the server.
However, the disadvantage compared to the three mouse tracking techniques is that it provides the poorest information that makes it impossible to create any visualizations, as shown in Fig. 7. The information tells only how many events (such as left clicks, right clicks, middle clicks, mouse movements, scrolls, zooms, and keyboard types) occurred and the length of time that the user spends on the webpage. Nevertheless, the information is richer than traditional logs, as shown in Table 5.
Region of interest mouse tracking
This technique is the best of the three, as the desired information is based on the analyst’s preferences, and there are lower resource costs than in the default mouse tracking shown in Figs. 8, 11. Analysts chooses the areas to be analyzed. In this case, the authors defined the following areas for the quiz session: header, title, menu, footer, and each question section. It can be seen in Fig. 7 that it is possible to create heatmaps of high activity areas, although it is not possible to create precise mouse trajectories as default mouse tracking, but it is possible to capture amounts of movement between areas. The duration is also based on each area. The data size is 5.4 MB with 19062 rows shown in Table 6. As shown in Table 4, the average data rate is 2.28 kBps and the average CPU and RAM usage are 0.87% and 1.85 MB which are lower than in default mouse tracking. Based on the algorithm of this method, the resource cost should be based on the number of defined areas, where the more areas, the larger the resource cost (note that default mouse tracking cost the largest because the webpage has been divided into the smallest possible areas, which are the x and y points of a webpage).
This technique is the best of the three, as the desired information is based on the analyst’s preferences, and there are lower resource costs than in the default mouse tracking shown in Figs. 8, 11. Analysts chooses the areas to be analyzed. In this case, the authors defined the following areas for the quiz session: header, title, menu, footer, and each question section. It can be seen in Fig. 7 that it is possible to create heatmaps of high activity areas, although it is not possible to create precise mouse trajectories as default mouse tracking, but it is possible to capture amounts of movement between areas. The duration is also based on each area. The data size is 5.4 MB with 19062 rows shown in Table 6. As shown in Table 4, the average data rate is 2.28 kBps and the average CPU and RAM usage are 0.87% and 1.85 MB which are lower than in default mouse tracking. Based on the algorithm of this method, the resource cost should be based on the number of defined areas, where the more areas, the larger the resource cost (note that default mouse tracking cost the largest because the webpage has been divided into the smallest possible areas, which are the x and y points of a webpage).
Conclusion and future work
Preprocessing mouse tracking data during real-time and online sessions helps reduce the storage and transmission costs and unexpectedly the JavaScript total running time on the client’s browser as well. The techniques presented in this work are whole page tracking and ROI tracking. Although the amount of reduced data is very dependent, there are fixed theories. The fixed theories are as follows: whole page tracking reduces the mouse tracking data into one row of tables per webpage visit, and ROI tracking reduces the data into one row of tables per area visit. Selecting the right technique can help reduce the storage and transmission costs while still obtaining the necessary data.
Although this concept works perfectly, but there are still problems with execution. Whole page tracking transmits the data only when the user leaves the page, and if the problems lie with the browser, there is currently no way to tell the user to wait before the transmission process finishes. There will definitely be cases where data are not fully transmitted. The problem for ROI tracking are that it cannot perform smart area definition and labelling. Normally, they are performed by humans. Therefore, one solution is to develop an artificial intelligence for this matter in the future.
Availability of data and materials
The datasets generated and/or analyzed during the current study are available in the Mendeley repository titled ’Data for: Implementation of Real-Time Online Mouse Tracking Case Study in a Small Online Quiz’ in ’Pre-processed Mouse Tracking Data’ directory [61]: Tables 3, 5, 6 data are available in file mouse_tracking_mongolia_anonymous.ods [62]. Figures 8, 9, 10 and Table 4 are based on files: cpurammousetracking.txt [63], cpurampagetracking.txt [64], cpuramroitracking.txt [65], mousetrackingsimulationpcapng [66], pagetrackingsimulationpcapng [67], roitrackingsimulationpcapng [68].
Abbreviations
AdELEAdaptive: E-Learning via the eye tracking.AeLSEye tracking based adaptive and personalized e-learning systems.
API: Application programming interface
CPU: Central processing unit
CSS: Cascading style sheets
DOM: Document object model
e5Learning: Enhanced exploitation of eyes for effective e-learning
ESA: Eye tracking based emphatic software agen
GB: Gigabyte
GHz: Gigahertz
HTML: Hyper Text Markup Language
HTTP: Hyper text transfer protocol
kBps: Kilobytes per second
LMS: Learning management system
MB: Megabyte
MBps: Megabyte per second
MVC: Model-view controller
MVT: Model-view template
NPM: Node package manager
OGAMA: Open gaze and mouse analyzer
POI: Point of interest.
Protus: Programming tutoring system
RAM: Random access memory
ROI: Region of interest
UI: User interface
XML: Extensible Markup Language
References
Wikipedia: Information age. https://en.wikipedia.org/wiki/Information_Age.
Bluehost: Web analytics for beginners - presented by bluehost. https://youtu.be/PnVZ7_OA7Qo.
Purnama F, Fungai A, Do TM, Siagian AHAM, Annas A, Susanto H, Hendarmawan Usagawa T, Nakano H. Introductory work on section based page view of web contents: towards the idea of how a page is viewed. In: 11th International Student Conference on Advanced Science and Technology (ICAST), p. 9–11 2016; Kumamoto University.
Pernice KF-shaped pattern of reading on the web: misunderstood, but still relevant (even on mobile). Nielsen Norman Group. 2017.
Holmqvist K, Wartenberg C. The role of local design factors for newspaper reading behaviour-an eye-tracking perspective. Lund Univ Cogn Stud. 2005;127:1–21.
Lai M-L, Tsai M-J, Yang F-Y, Hsu C-Y, Liu T-C, Lee SW-Y, Lee M-H, Chiou G-L, Liang J-C, Tsai C-C. A review of using eyetracking technology in exploring learning from 2000 to 2012. Edu Res Rev. 2013;10:90–115.
Cooke L. Is the mouse a “poor man’s eye tracker”? In: Annual Conference-Society for Technical Communication, 2006;53:p. 252
Barrios VMG, Gütl C, Preis AM, Andrews K, Pivec M, Mödritscher F, Trummer C. Adele: A framework for adaptive e-learning through eye tracking. Proceedings of IKNOW. 2004;609–616.
Zushi M, Miyazaki Y, Norizuki K. Web application for recording learners’ mouse trajectories and retrieving their study logs for data analysis. Knowl Manag E-Learn. 2012;4(1):37.
Drusch G, Bastien J, Dinet J. From gaze plots to eye fxation patterns using a clustering method based on hausdorf distances. In: Proceedings of the 23rd Conference on l’Interaction Homme-Machine; 2011. p. 1. https://doi.org/10.1145/2044354.2044356. ACM
Huang J, White RW, Dumais S. No clicks, no problem: using cursor movements to understand and improve search. In: Proceedings of the SIGCHI Conference on Human Factors in Computing Systems; 2011. p. 1225–1234. ACM.
Manson SM, Kne L, Dyke KR, Shannon J, Eria S. Using eye-tracking and mouse metrics to test usability of web mapping navigation. Cartogr Geogr Inform Sci. 2012;39(1):48–60. https://doi.org/10.1559/1523040639148.
Hsu T-C, Chang S-C, Liu N-C. Peer assessment of webpage design: behavioral sequential analysis based on eye tracking evidence. J Edu Technol Soc. 2018;21(2):305–21.
Arroyo E, Selker T, Wei W. Usability tool for analysis of web designs using mouse tracks. In: CHI’06 extended abstracts on human factors in computing systems; 2006. p. 484–489 . https://doi.org/10.1145/1125451.1125557. ACM.
Navalpakkam V, Churchill E. Mouse tracking: measuring and predicting users’ experience of web-based content. In: Proceedings of the SIGCHI Conference on Human Factors in Computing Systems; 2012. p. 2963–2972. https://doi.org/10.1145/2207676.2208705. ACM
Rodden K, Fu X, Aula A, Spiro I. Eye-mouse coordination patterns on web search results pages. In: CHI’08 Extended Abstracts on Human Factors in Computing Systems; 2008. p. 2997–3002. ACM.
Hariri RH, Fredericks EM, Bowers KM. Uncertainty in big data analytics: survey, opportunities, and challenges. J Big Data. 2019;6(1):44. https://doi.org/10.1186/s40537-019-0206-3.
Barrachina AD, O’Driscoll A. A big data methodology for categorising technical support requests using hadoop and mahout. J Big Data. 2014;1(1):1. https://doi.org/10.1186/2196-1115-1-1.
Rayner K. Eye movements in reading and information processing: 20 years of research. Psychol Bull. 1998;124(3):372.
Mueller F, Lockerd A. Cheese: tracking mouse movement activity on websites, a tool for user modeling. In: CHI’01 Extended Abstracts on Human Factors in Computing Systems. 2001. p. 279–280. https://doi.org/10.1145/634067.634233. ACM
Sungkur RK, Antoaroo MA, Beeharry A. Eye tracking system for enhanced learning experiences. Edu Inform Technol. 2016;21(6):1785–806. https://doi.org/10.1007/s10639-015-9418-0.
Zheng C, Usagawa T. A rapid webcam-based eye tracking method for human computer interaction. In: 2018 International Conference on Control, Automation and Information Sciences (ICCAIS). 2018. p. 133–136. https://doi.org/10.1109/ICCAIS.2018.8570532. IEEE
Pivec M, Trummer C, Pripf J. Eye-tracking adaptable e-learning and content authoring support. Informatica. 2006;30(1).
Wang H, Chignell M, Ishizuka M. Empathic tutoring software agents using real-time eye tracking. In: Proceedings of the 2006 Symposium on Eye Tracking Research & Applications, 2006:73–78. https://doi.org/10.1145/1117309.1117346. ACM.
Calvi C, Porta M, Sacchi D. e5learning, an e-learning environment based on eye tracking. In: Advanced Learning Technologies, 2008. ICALT’08. Eighth IEEE International Conference On. 2008.p. 376–380. https://doi.org/10.1109/ICALT.2008.35. IEEE.
Wei H, Moldovan A-N, Muntean C. Sensing learner interest through eye tracking. Technology. 2009;22:23.
Ivanović M, Klašnja-Milićević A, Ivković J, Porta M. Integration of eye tracking technologies and methods in an e-learning system. In: Proceedings of the 8th Balkan Conference in Informatics. 2017. p. 29. https://doi.org/10.1145/3136273.3136278. ACM.
Rodrigues M, Gonçalves S, Carneiro D, Novais P, Fdez-Riverola F. Keystrokes and clicks: measuring stress on e-learning students. In: Management Intelligent Systems. Springer. 2013. p. 119–126. https://doi.org/10.1007/978-3-319-00569-0_15.
Salmeron-Majadas S, Santos OC, Boticario JG. An evaluation of mouse and keyboard interaction indicators towards non-intrusive and low cost afective modeling in an educational context. Procedia Comput Sci. 2014;35:691–700. https://doi.org/10.1016/j.procs.2014.08.151.
Harrati N, Bouchrika I, Tari A, Ladjailia A. Exploring user satisfaction for e-learning systems via usage-based metrics and system usability scale analysis. Comput Hum Behav. 2016;61:463–71. https://doi.org/10.1016/j.chb.2016.03.051.
Purnama F, Sukhbaatar O, Choimaa L, Usagawa T. Implementation of real-time online mouse tracking on overseas quiz session from server administrator point of view. Educ Inform Technol. 2020;. https://doi.org/10.1007/s10639-020-10141-3.
Purnama F. 0fajarpurnama0/Real-Time-Online-Mouse-Tracking-Animation. https://doi.org/10.5281/zenodo.2589338. https://github.com/0fajarpurnama0/Real-Time-Online-Mouse-Tracking-Animation
Voßkühler A, Nordmeier V, Kuchinke L, Jacobs AM. Ogama (open gaze and mouse analyzer): open-source software designed to analyze eye and mouse movements in slideshow study designs. Behav Res Methods. 2008;40(4):1150–62. https://doi.org/10.3758/BRM.40.4.1150.
Kieslich PJ, Henninger F. Mousetrap: an integrated, open-source mouse-tracking package. Behav Res Methods. 2017;49(5):1652–67. https://doi.org/10.3758/s13428-017-0900-z.
Haije EG. Top 15 heatmapping tools you might want to try. https://mopinion.com/heatmapping-tools-you-might-want-to-try/
Wood L, Le Hors A, Apparao V, Byrne S, Champion M, Isaacs S, Jacobs I, Nicol G, Robie J, Sutor R et al. Document object model (dom) level 1 specifcation. W3C Recomm. 1998;1
Pixley T et al. Document object model (dom) level 2 events specifcation. W3C recommendation, November 2000
Leiva LA, Huang J. Building a better mousetrap: compressing mouse cursor activity for web analytics. Inform Process Manag. 2015;51(2):114–29.
Usagawa T, et al. Efectiveness of e-learning experience through online quizzes: a case study of myanmar students. Int J Emerg Technol Learn. 2018;13(12):157–76. https://doi.org/10.3991/ijet.v13i12.9114.
Adekitan AI, Abolade J, Shobayo O. Data mining approach for predicting the daily internet data trafc of a smart university. J Big Data. 2019;6(1):11. https://doi.org/10.1186/s40537-019-0176-5.
Bughin J. Big data, big bang? J Big Data. 2016;3(1):2. https://doi.org/10.1186/s40537-015-0014-3.
Husain SS, Kalinin A, Truong A, Dinov ID. Socr data dashboard: an integrated big data archive mashing medicare, labor, census and econometric information. J Big Data. 2015;2(1):13. https://doi.org/10.1186/s40537-015-0018-z.
Ahmad AK, Jafar A, Aljoumaa K. Customer churn prediction in telecom using machine learning in big data platform. J Big Data. 2019;6(1):28. https://doi.org/10.1186/s40537-019-0191-6.
Sohangir S, Wang D, Pomeranets A, Khoshgoftaar TM. Big data: deep learning for fnancial sentiment analysis. J Big Data. 2018;5(1):3. https://doi.org/10.1186/s40537-017-0111-6.
Dash S, Shakyawar SK, Sharma M, Kaushik S. Big data in healthcare: management, analysis and future prospects. J Big Data. 2019;6(1):54. https://doi.org/10.1186/s40537-019-0217-0.
Bibri SE. On the sustainability of smart and smarter cities in the era of big data: an interdisciplinary and transdisciplinary literature review. J Big Data. 2019;6(1):25. https://doi.org/10.1186/s40537-019-0182-7.
Rheem H, Verma V, Becker DV. Use of mouse-tracking method to measure cognitive load. Proceedings of the Human Factors and Ergonomics Society Annual Meeting. 2018;62:1982–6. https://doi.org/10.1177/1541931218621449. SAGE Publications Sage CA: Los Angeles
Li L-Y, Tsai C-C. Accessing online learning material: quantitative behavior patterns and their efects on motivation and learning performance. Comput Educ. 2017;114:286–97.
Koh KH, Fouh E, Farghally MF, Shahin H, Shafer CA. Experience: learner analytics data quality for an etextbook system. J Data Inform Qual. 2018;9(2):10. https://doi.org/10.1145/3148240.
Purnama F, Fungai A, Usagawa T. Demonstration on extending the pageview feature to page section based: towards identifying reading patterns of users. In: 7th International Conference on Science and Engineering. Yangon Technological University. 2016. p. 304–307
Ornbo G. Sams teach yourself node. Js in 24 h: sams teac your node 24 h. Indianapolis: Sams Publishing; 2012.
Contributors V. What is V8? https://v8.dev
StrongLoop, IBM. Other expressjs.com contributors: express, a fast, unopinionated, minimalist web framework for Node.js. https://expressjs.com
Microsoft: JavaScript that scales. https://www.typescriptlang.org
Django. The web framework for perfectionists with deadlines. https://www.djangoproject.com
Hansson DH. Working with JavaScript in rails. https://guides.rubyonrails.org/v4.1/working_with_javascript_in_rails.html
Laravel. The PHP framework for web artisans. https://laravel.com
Facebook: synthetic event. https://reactjs.org
Google: one framework. Mobile and Desktop. https://angular.io
u-double-u: SPEED-BATTLE statistics and browser comparison: Windows NT 10.0. http://www.speed-battle.com/statistics_e.php
Purnama F, Sukhbaatar O, Choimaa L, Usagawa T. Data for: implementation of real-time online mouse tracking case study in a small online quiz [Pre-processed Mouse Tracking Data/]. Mendeley Data, v3. 2020;. https://doi.org/10.17632/vznyfcx9xk.3.
Purnama F, Sukhbaatar O, Choimaa L. Data for: implementation of real-time online mouse tracking case study in a small online quiz [Pre-processed Mouse Tracking Data/mouse_tracking_mongolia_anonymous.ods]. Mendeley Data, v2. 2020;. https://doi.org/10.17632/vznyfcx9xk.2.
Purnama F, Sukhbaatar O, Choimaa L, Usagawa T. Data for: implementation of real-time online mouse tracking case study in a small online quiz [Pre-processed Mouse Tracking Data/cpu-ram-mousetracking.txt]. Mendeley Data, v2. 2020;. https://doi.org/10.17632/vznyfcx9xk.2.
Purnama F, Sukhbaatar O, Choimaa L, Usagawa T. Data for: implementation of real-time online mouse tracking case study in a small online quiz [Pre-processed Mouse Tracking Data/cpu-ram-pagetracking.txt]. Mendeley Data, v2. 2020;. https://doi.org/10.17632/vznyfcx9xk.2.
Purnama F, Sukhbaatar O, Choimaa L, Usagawa T. Data for: implementation of real-time online mouse tracking case study in a small online quiz [Preprocessed Mouse Tracking Data/cpu-ram-roitracking.txt]. Mendeley Data, v2. 2020;. https://doi.org/10.17632/vznyfcx9xk.2.
Purnama F, Sukhbaatar O, Choimaa L, Usagawa T. Data for: implementation of real-time online mouse tracking case study in a small online quiz [Pre-processed Mouse Tracking Data/mousetracking-simulation.pcapng].Mendeley Data, v2. 2020; https://doi.org/10.17632/vznyfcx9xk.2.
Purnama F, Sukhbaatar O, Choimaa L, Usagawa T. Data for: Implementation of Real-Time Online Mouse Tracking Case Study in a Small Online Quiz [Pre-processed Mouse Tracking Data/pagetracking-simulation.pcapng]. Mendeley Data, v2. https://doi.org/10.17632/vznyfcx9xk.2
Purnama F, Sukhbaatar O, Choimaa L, Usagawa T. Data for: implementation of real-time online mouse tracking case study in a small online quiz [Preprocessed Mouse Tracking Data/roitrackingsimulation.pcapng]. Mendeley Data, v2. https://doi.org/10.17632/vznyfcx9xk.2
Acknowledgements
The authors would like to express their deepest gratitude to Otgontsetseg Sukhbaatar, Lodoiravsal Choimaa, and their students for participating in the mouse tracking quiz session. This manuscript has been proofread by Springer Nature Author Services.
Funding
Part of this work was supported by JSPS KAKENHI Grant-in-Aid for Scientific Research 19K1225100 and 15H02795.
Author information
Fajar Purnama and Tsuyoshi Usagawa are contributed equally to this work
Affiliations
Graduate School of Science and Technology, Kumamoto University, 2 Chome-39-1, Kurokami, Chuo Ward, Kumamoto, 860-8555, Japan Fajar Purnama & Tsuyoshi Usagawa
Contributions
Both the authors have participated since the beginning of the work. The main author wrote the manuscript, and the co-author revised the manuscript. Both authors read and approved the final manuscript.
Authors’ information
FP is currently a doctoral student at Graduate School of Science and Technology, Kumamoto University. His research area is in the field of educational technology. TU joined Kumamoto University in 1983 right after he received an M.E. degree from Tohoku University. In 1988, he received a Dr. Eng. from Tohoku University. Since 2004 he has been a professor, and he is a member of the IEEE, ASA, ASJ, INCE/J, JSET, and JSAI. He is interested in e-learning contents and systems, and acoustic signal processing.
Corresponding author
Correspondence to Fajar Purnama.
Ethics declarations
Competing interests
The authors declare that they have no competing interests.
Additional information
Publisher's Note
Springer Nature remains neutral with regard to jurisdictional claims in published maps and institutional affiliations.