Author
Fajar Purnama, Alvin Fungai, Tsuyoshi Usagawa.
Note
This is an extended version of the previous paper.
This paper was presented in The Seventh International Conference on Science and Engineering (ICSE) at Yangon Technological University, Myanmar, on 9th December 2016 but was not published online and distributed thus the copyright remained with me "Fajar Purnama" the main author where I have the authority to repost anywhere and I hereby declare to license it as customized CC-BY-SA where you are also allowed to sell my contents but with a condition that you must mention that the free and open version is available here. In summary, the mention must contain the keyword "free" and "open" and the location such as the link to this content.
The original is available at Reasearch Gate.
The presentation is available at Slide Share.
The source code is available at Github.
Abstract
The Internet made it easier to access information almost anywhere at anytime. With all sorts of analytics such as pageview, behaviorist can see how users browsed the web. However there is a limit to how much data pageview analytic can provide. Pageview can answer what, when, and where a webpage is viewed but cannot answer how a page is viewed. Simply saying it cannot show the reading pattern of a user on a page. Therefore this work proposes to extend the tracking capability of the pageview feature where the monitoring is done as far as the sections of the page. The demonstrated web application developed consists of Javascript which provides the main feature of reading pattern tracking, Java to store the data into the database which later on can be used for analytics, and these were tested on a simple HTML page. The web application can show the date accessed to a particular section and the duration spent on that section by the user. It can also provide data that shows the reading pattern of a reader which in the future can be used for analysis by other researchers.
Introduction
The invention of the Internet had greatly change how people access, share, and store information. Before, people have to take a long walk to the library to read books, and attend seminars to learn from others. Today many people shares information on the Internet which is practically accessible almost anywhere at anytime with all each person needed was a computer device connected to the Internet. Not long afterward, online analytics or another name web analytics was introduced where we can see what visitors do on our webpage. One of an online analytic is pageview that can show the number, the duration, and variation of people reading the webpage. Conventionally, it can be seen how popular a book is by surveying how many copies were sold and how many have read them, but through online there is no longer restriction to place and time, and with the help of computers it is possible to get data that could determine the behavior of the readers.
The field of education was also influenced by these technologies that sparks popular terms such as e-learning, online course, and learning analytics. Our colleges implemented e-learning on their respective universities and their research [1] [2] was able to determine whether the lectures and students were ready to use it, and their data can suggest the next course of action in order for the university to fully utilize e-learning. Another research in [3] studies about online discussion forums where they state that the design of the online course determines how active the students will be. Their data shows that assignments and quizzes decreases idleness and lurkers, and increases more active students. A research in [4] distinguished the learning patterns of those who fails and passes an online course, for example what materials students read, what exercises they attempted, and how often they perform online discussion before attempting an online exam.
Their research contributes to the quality of education, but there are still limits of how far their data can envision since they consist only of contents viewed, discussion posted, assignments submitted, quizzes attempted, and scores which cannot determine their detailed reading patterns. When reading a person can either read everything in detail, skim through the page, or semi-skim reading only the headlines then read in detail if that person finds it interesting. A common a example is when researcher browse to publish manuscripts where they first only reads the title, then the abstract if the title is eye catching, next skim through the manuscript by reading the introduction, figures, and conclusion if the abstract is interesting, finally they read in detail if they find it important to them. Simply the answer of what, when, and where the contents are viewed is in hand, but how the contents are viewed still remains a question. To answer this question it is necessary to extend the pageview feature alike by extending its monitoring to as far as each section of the page/contents.
This is one of many related learning analytics and online analytics work that introduces to a web application that can track the reading pattern of a user. It consists of a Javascript and Java tested on an Hyper Text Markup Language (HTML) page. However the objective of this work is only to demonstrate the simple Javascript, and web API created since it has not been tested on popular websites today. Though it is only tested on simple HTML, it can demonstrate recording of date accessed and the time spent by user on a particular section, which the idea is quite new today.
Related Work
One of the very basic that all users on the Internet know is browser history which hold records of the date and time of websites that they visited. Software developers developed more advance tools. A Chrome Browser plugin called Timestats [5] shows statistical and timeline analysis of the websites users visited showing their browsing behaviors such as how long they have been browsing for the day and which website was frequently visited presented in graph and pie chart alike. Relic Browser [6] was able to record user clicks and scrolls, and if desired, typings on keyboard which all of them can show how users responded to a webpage. Another application called CA App Real Browser Monitoring [7] which can playback some browsing based on the events recorded, this is very close to what this work wants to achieve.
On another side there are applications developed by researchers from learning analytics field. One of our colleges [8] [9] developed an open textbook analytic tool that can record students’ actions for example page flipping, bookmarks, links clicked, notes created, and time spent on chapters and pages, [10] is also quite related but on e-magazines stating that it is able to show reading habits. On our perspective they desired to achieve a section based monitoring similar to this work but they used pages like on electronic textbook to divide contents into sections, however this work intends to monitor deeper than that. The closest and might be better to this work is Finger Trail Learning System (FTLS) [11] that records the mouse cursors trails. However it forces the users to trail on each characters on a text in order for it to appear and be highlighted, while this work does not force the users to do such but just browse normally. The authors made an introductory work on [12] but only highlight the main idea, on this work a detailed discussion will be made.
Web Application

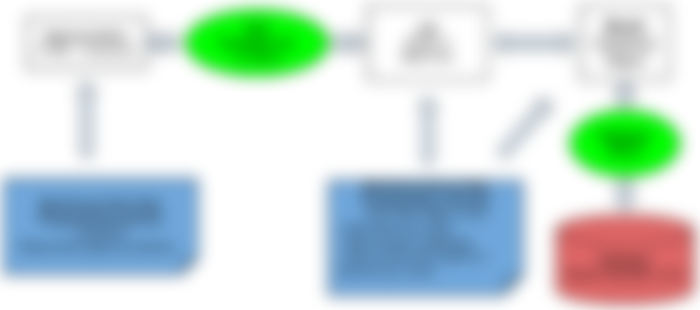
Fig. 1 The Web Application Architecture, the client side is the representation interface which is an HTML page embedded with Javascript a client side programming language to capture the reading pattern of the user. The server side is the web API written using server side programming language to retrieve the captured data from the client and put them on the database. The web API can also show the data that is already on the database.
Architecture Overview
TThe web application architecture can be seen on Fig. 1 which consists of representation interface, web application programming interface (API), and a database. The representation interface tracks the reading pattern of a user on this case the date and duration on a section which is state of the art of this work. The web API is quite common that retrieves the data recorded by the representation interface, stores it on the database, and may process the data to show the statistics. Together they form a complete web application which the structure is quite standard and simple but may require additional feature depending on the implementation. Next subsections explains in details the method of the representation interface and the web API but the full source code can only be viewed on the link [13].
Representation Interface
Listing I Concept of Tracker Code
1: <form id=“sect” action="thewebAPI"
2: onmouseleave="submitFunction(sect)">
3: <div id=”sect” onmouseenter="startCount(sect)"
4: onmouseleave="stopCount(sect)">
5:
6: <input type="text" id="date<sect>" name="date">
7: <input type="text" id="duration<sect>" name="duration">
8:
9: Section Contents
10:
11:  </div> </form>
The main idea is mostly on the representation interface where the user reading pattern is captured. This can be achieve by embedding client side programming language on this case Javascript is used on the content. Listing I shows the concept of applying tracker code to a section content of a webpage. On line 9 represents a certain content of a webpage and clad it in a tracker code to capture the date and duration when a user is reading the content. For this work the mouse cursor is used to indicate which section the user is currently reading. On line 3 the variable “onmouseenter” on the “div” tag indicates to record the date and starts the timer through the “startCount(sect)” customized function when the mouse cursor enters the section and its contents. On the other hand “onmouseleave” variable indicates to stop the recording when the mouse cursor leaves the section through the "stopCount(sect)" customized function. The time function is based on [14] with modification of resetting the timer when stop counting, get system’s date when counting, and add the variables to use array where here the functions use the parameter “sect” that will have different value for each section in order to separate the data recorded for each section. The “onmouseleave” on line 2 inside the “form” tag indicates to submit the date and time spent on that section data to the web API when the mouse cursor leaves the section. To submit them, line 6 and 7 is necessary as for the standard writing of “form” on HTML.
Listing II Tracker Code Insertion Algorithm
Input: parent_node : parent node in html body;
section_node : parent node as section identifier;
parent_node_name : the name of the parent_node; parent_node_length : total number of parent_node;
defined_section_node_name : name of the node section_node;
define_section_node_length : total number of section_node;

1:    i = 0; j = 0;
2:    create tracker_code(i);
3:    insert tracker_code(i) before parent_node(j);
4:    j = j+1 /*go to next parent_node because current parent
5:   node is now tracker_code*/
6:    while parent_node_length > define_section_node_length+1 do
7:     /* This process repeats until all parent_node  is clad with
8:     tracker code */
9:     if parent_node_name(j) == defined_section_node_name do
10:       i = i+1 /*move to next tracker_code*/;
11:       create tracker_code(i);
12:       insert tracker_code(i) before parent_node(j)
13:     j = j+1;
14:   end if
15:   move parent_node(j) into tracker_code(i) as child
16:   /*the number of parent_node decreases and “j” is currently
17:   pointing to the next parent_node*/
18:  end while
On the introductory work [11] was to insert the tracker code manually as on Listing I which will work on any webpage, while this work introduces a method to insert the tracking code dynamically using document object model (DOM) HTML with the algorithm shown on Listing II, though it is only tested on a simple HTML page which contains no other than “html”, “head”, “body”, “h1”, “p”, and “br” tags. Most HTML today is more complicated and may need extra method for it to work.
The tracking code is all on Listing I except for line 9 and the goal is to insert them automatically. For a simple HTML the body usually contains nodes/tags “h1” for heading, “p” for paragraph, “div” for sections, and etc. First, one of them have to be chosen as a section identifier called a section node. Second create a tracker code as many as the existing section node (on the algorithm is one additional because the starting node is usually not a section node). Third put the respective section node and its following nodes into their respective tracker code (the first section node and its following until the second section node into the first tracking code, then the second section node and its following until the third section node into the second tracking code, and so on).
Web API
The web API’s job is to retrieve the tracking data (date accessed and time spent) of a section by the representation interface and store it into the database. Since capturing the tracking data uses a client side programming language, it is still stored on the client side, and therefore the client must handover the data to the server. The “form” tag Listing I is to submit the data to the server, and the server must be prepared with a server side programming language which on this case Java is used. The first thing the program needs to do is to be able to read the parameter values “date” and “duration” from Listing I line 6 and line 7, and store it in a variable. The second thing is to make a connection to a database server, create a database if it is not created already, create a table, and store the values into the table. For the database server uses MySQL on this work. Afterwards another web API can be created to mine this data, present it like the ones on [5] which is beyond the scope of this work.
Demonstration

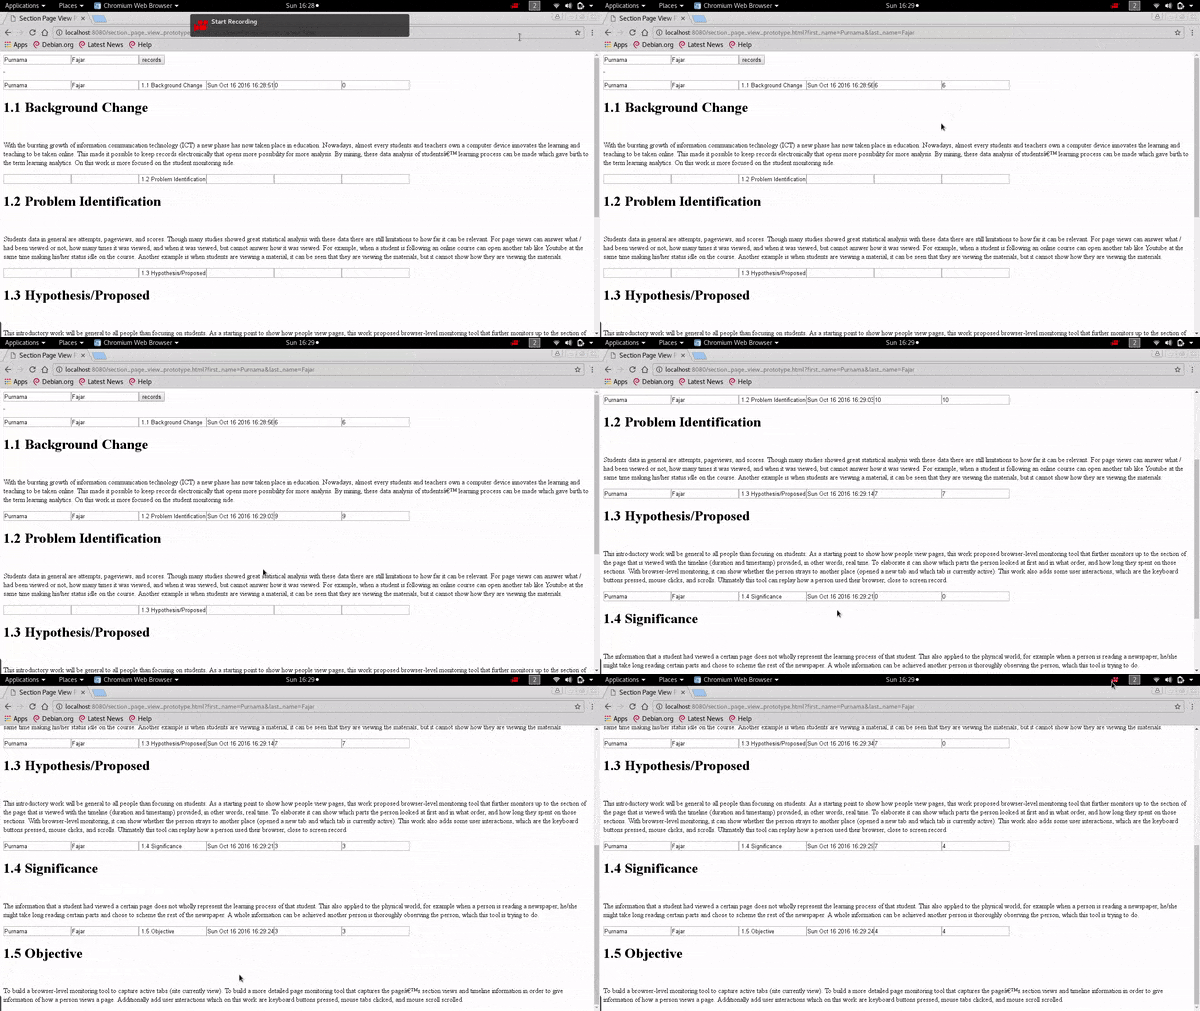
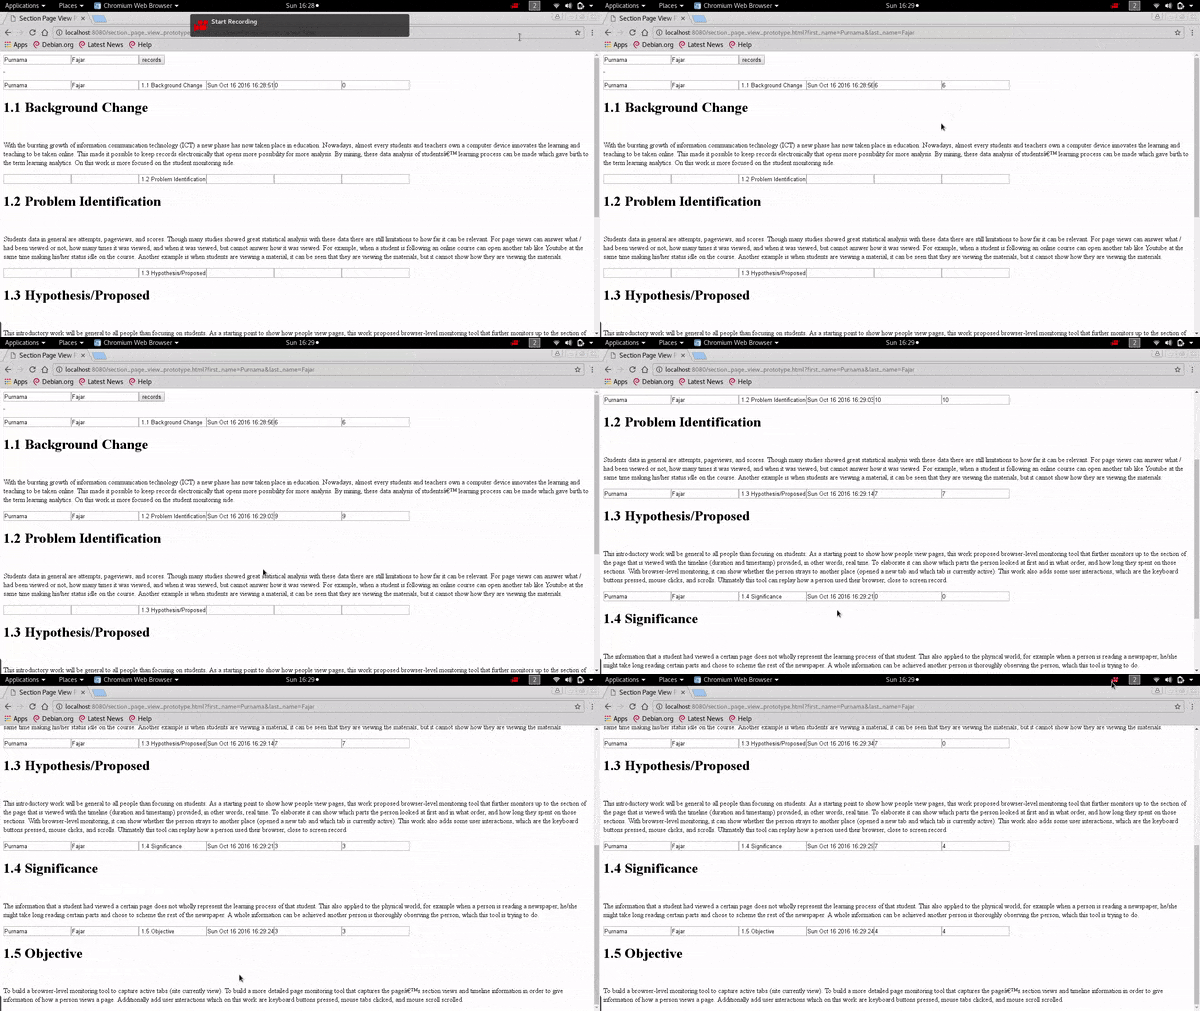
Fig. 2 Demonstration that date and duration appears for the first section when the mouse cursor enters the first section of the page. Currently it shows that the mouse cursor had stayed on the first section for six seconds, note that the boxes in second section is still empty. The first two boxes are the name of a user, the third box is the section, the fourth box is the date, the fifth box is accumulated duration, while sixth box is discrete (not demonstrated here). Fig. 3 Demonstration, showing that the timer on the first section stops when the mouse cursor moves to the second section after six seconds have passed. The user’s name, date and timer appears, and it is shown that the mouse cursor stayed on the second section for ten seconds.
The demonstration was intended to embed a source code but it is not possible here, so only the screenshots on Fig. 2 and Fig. 3. The HTML page normally consists only of headers and paragraphs. Once it is applied an external Javascript source, it is inserted the tracker code and for this demonstration it is shown timer count on that page. The first and second box contains the first name and last name of the user, followed by the third box the section’s name extracted from the header’s text. Once the mouse cursor enters the first section as on Fig. 2 the date pops on the fourth box, and the timer on the fifth box and sixth box (fifth box was design for accumulated timing and sixth box for discrete timing which is not demonstrated here). Next when the mouse cursor moves to the next section, the timer on the previous section stops and the timer on this section starts as on Fig. 3.
The page will submit the six data based on the six boxes everytime the mouse cursor leaves the section to a web API. The web API stores it on a database, and another simple web API can be created to show the data. An example output can seen on Fig. 4 where a raw output is shown from the database’s table. From the data can be said that the user starts reading from the first section of the context for 6 seconds, then moves to the next section and read there for 10 seconds, then moves on again. Normally when the duration is short, the user is skimming through the page, but when the duration is long, the user is focused on that section. Compared to using page view this data can show more information about user’s reading patterns.

Fig. 4 A sample result from a web API showing the contents of the table within the database which are data captured by the representation interface. It showed the user Purnama Fajar have read the first section on the specified dates for six seconds, then reads the second section for 10 seconds and so on.
Conclusion and Future Work
The web application was able to demonstrate recording the date accessed and time spent on a section of an HTML page by a user which can be used as an extension to pageview feature. The data obtained from the web application was able to show more reading pattern information and other researchers on related fields may use this on their analysis and may find new answers.
Though the concepts were shown on this work but were not implemented yet on a real situation/webpage which leaves this for a future work. Further evaluation issues such as appearance, compatibility, and resource consumption issues still needs to be addressed.
Acknowledgment
Part of this work was supported by JSPS KAKENHI Grant-in-Aid for Scientific Research 25280124 and 15H02795.
Reference
S. Paturusi, Y. Chisaki, and T. Usagawa, “Assessing lecturers and student’s readiness for e-learning: A preliminary study at national university in north sulawesi indonesia,” GSTF Journal on Education (JEd), vol. 2, no. 2, pp. 1–8, 2015.
H. T. Sopu, Y. Chisaki, and T. Usagawa, “Use of facebook by secondary school students at nuku’alofa as an indicator of e-readiness for e-learning in the kingdom of tonga,” International Review of Research in Open and Distributed Learning, vol. 17, no. 4, pp. 203–223, 2016.
D. Nandi, M. Hamilton, J. Harland and G. Warburton, “How Active are Students in Online Discussion Forums?,” In Proc. Thirteenth Australasian Computing Education Conference (ACE 2011)., pp. 125-134.
M. Wen and C. P. Rosé, “Identifying Latent Study Habits by Mining Learner Behavior Patterns in Massive Open Online Courses,” In Proc. 23rd ACM International Conference on Conference on Information and Knowledge Management., pp. 1983-1986.
timestats. [Online]. Available: https://chrome.google.com/webstore/detail/timestats/ejifodhjoeeenihgfpjijjmpomaphmah. [Accessed 10 October 2016]
timestats. [Online]. Available: https://chrome.google.com/webstore/detail/timestats/ejifodhjoeeenihgfpjijjmpomaphmah. [Accessed 16 October 2016]
New Relic Browser. [Online]. Available: https://newrelic.com/browsermonitoring. [Accessed 16 October 2016]
Real Browser Monitoring. [Online]. Available: https://asm.ca.com/en/feature/realbrowsermonitoring.html. [Accessed 16 October 2016]
D. Prasad, R. Totaram, and T. Usagawa, “A framework for open textbooks analytics system,” TechTrends, vol. 60, no. 4, pp. 344–349, 2016.
D. Prasad, R. Totaram, and T. Usagawa, “Development of Open Textbooks Learning Analytics System,” International Review of Research in Open and Distributed Learning, vol.17, no. 5, pp. 215–234, 2016.
R. S. T. Lee, J. N. K. Liu, K. S. Y. Yeung, A. H. L. Sin and D. T. F. Shum, “Agent-based Web Content Engagement Time (WCET) Analyzer on e-Publication System,” In Proc. 2009 Ninth International Conference on Intelligent Systems Design and Applications., pp. 67-72.
K. Maruya, J. Watanabe, H. Takahashi and S. Hashiba, “A learning system utilizing learners’ active tracing behaviors,” In Proc. Fifth International Conference on Learning Analytics And Knowledge., pp. 418-419.
F. Purnama, A. Fungai, T. M. Do, A. H. A. M. Siagian, A. Annas, H. Susanto, Hendarmawan, T. Usagawa, H. Nakano, “Introductory Work on Section Based Page View of Web Contents: Towards The Idea of How a Page is Viewed,” submitted for publication.
Section based page view. [Online]. Available: https://github.com/0fajarpurnama0/Section_Based_Page_View. [Accessed 10 October 2016]
Window settimeout() method. [Online]. Available: http://www.w3schools.com/jsref/met_win_settimeout.asp. [Accessed 10 October 2016]


