Bitcoin Cash Hourly Chart Buy Signal
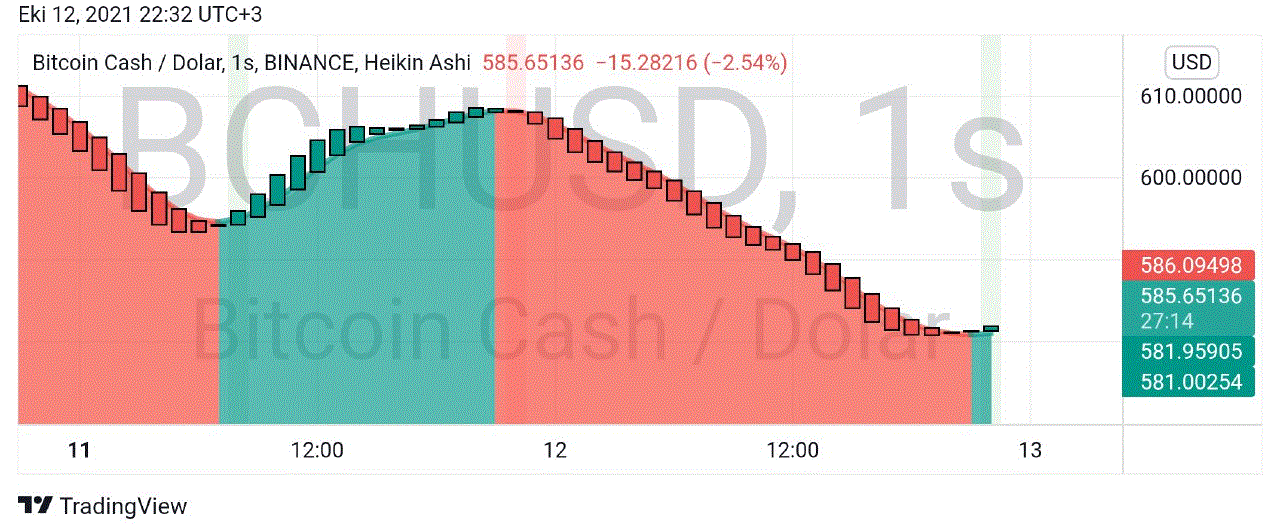
A buy position has just formed on the 1-hour chart for BCH and is slowly starting to move up. One of the reasons why the movement is slow is that it is not strong yet as it has just started, while the other reason is that the big time charts are in a sell position.
The target of the hourly chart is now at $601. Achieving this target depends on staying above the $584 and $567 levels. If the chart moves down, the first level of support will be the $567 level.
Bitcoin Cash 4 Hourly Chart Sell Signal
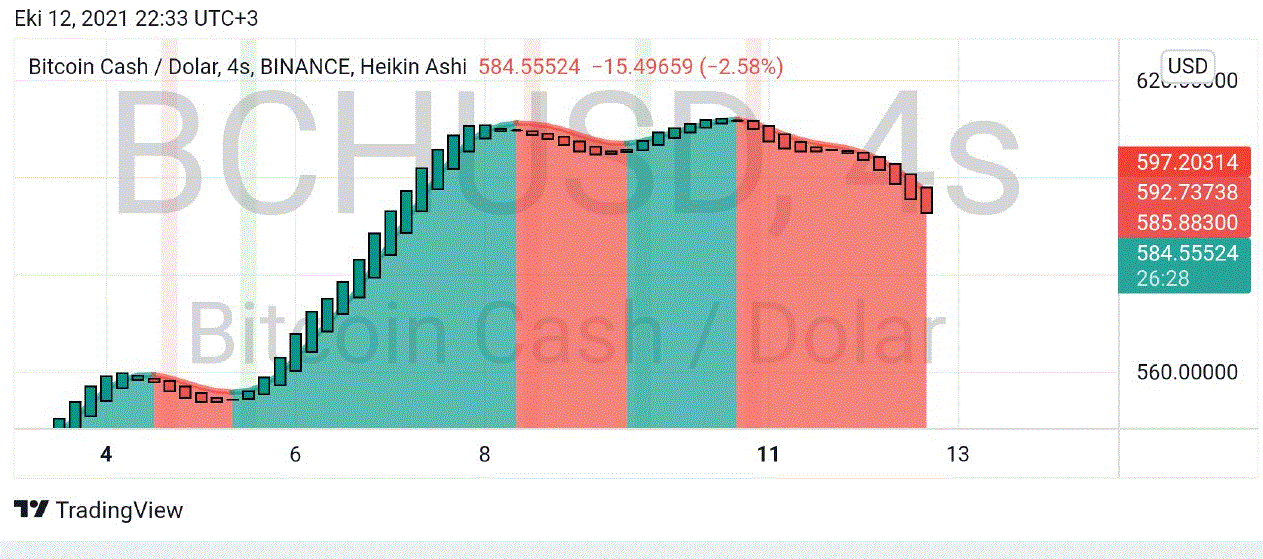
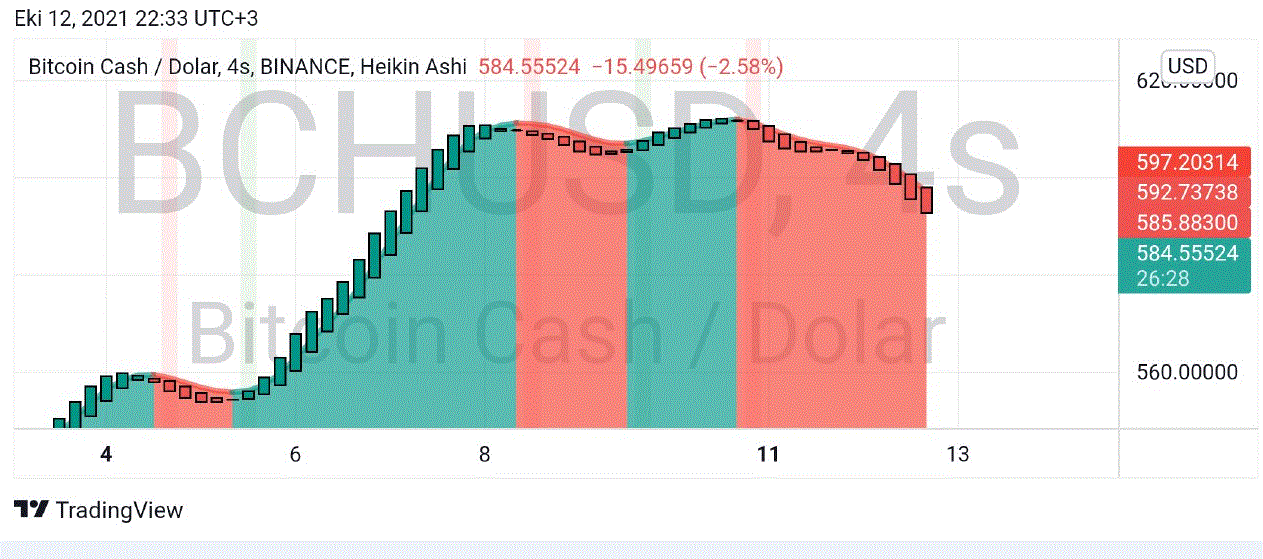
There was a buy position on the BTC/USD 4-hour chart until 2 days ago. However, this chart has been in a sell position for the last 2 days. However, its direction will be upwards as long as BCH manages to stay above the $585 level. The first level of resistance ahead of BCH is $597. If it manages to break this resistance and stay above this level until morning, there is a potential to test the $625 resistance.
Bitcoin Cash Daily Chart Buy Signal
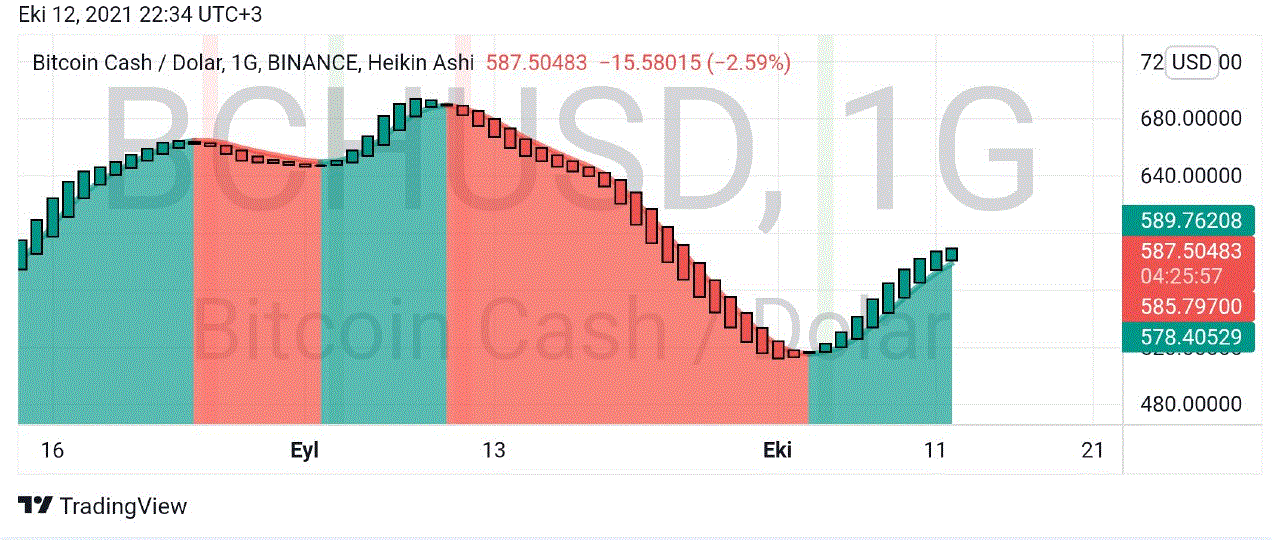
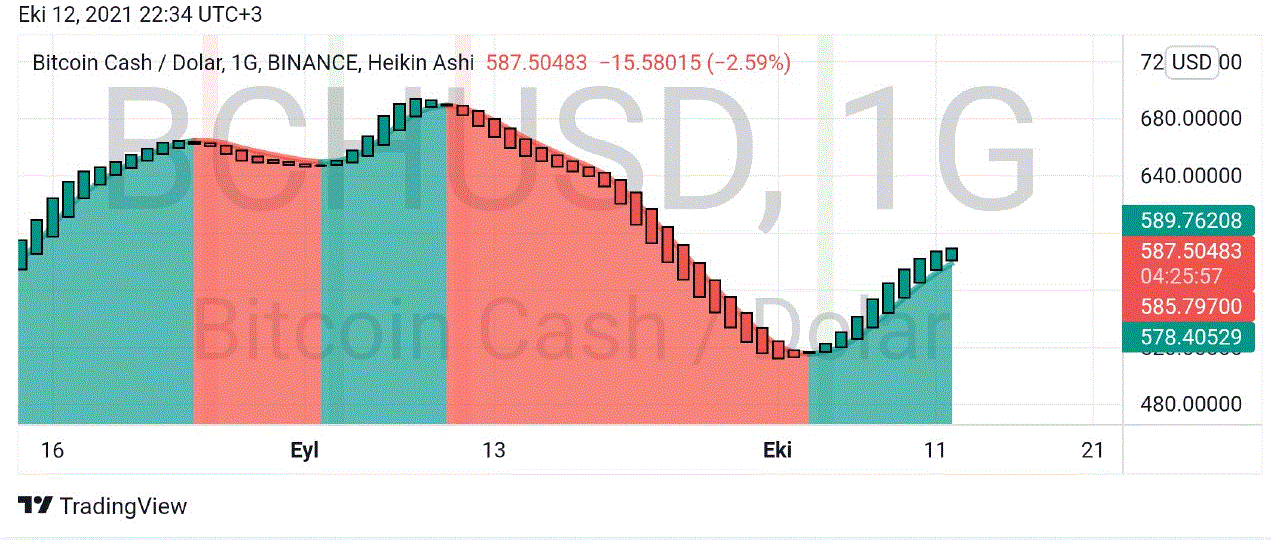
Perhaps the best news for BCH is that the daily chart is still in the buy position. If the direction of the 4-hour chart is up until the morning and then it can go to the buy position, the daily candle that will open tomorrow will be more solid.
However, its sell position on the 4-hour chart looks pretty stubborn. If the 4-hour chart can stay above the $589 level until tomorrow morning, the risk of a sell position on the daily chart will decrease. If the daily chart turns down, the first level of support is $561. If it falls below this level, there is resistance at $465.
Bitcoin Cash Weekly Chart Sell Signal
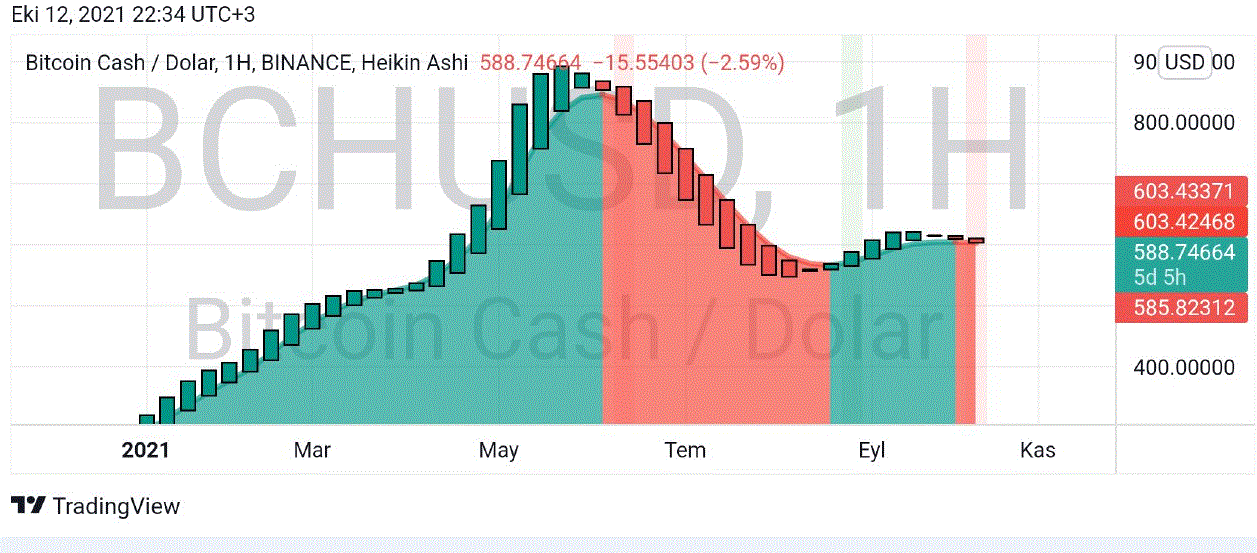
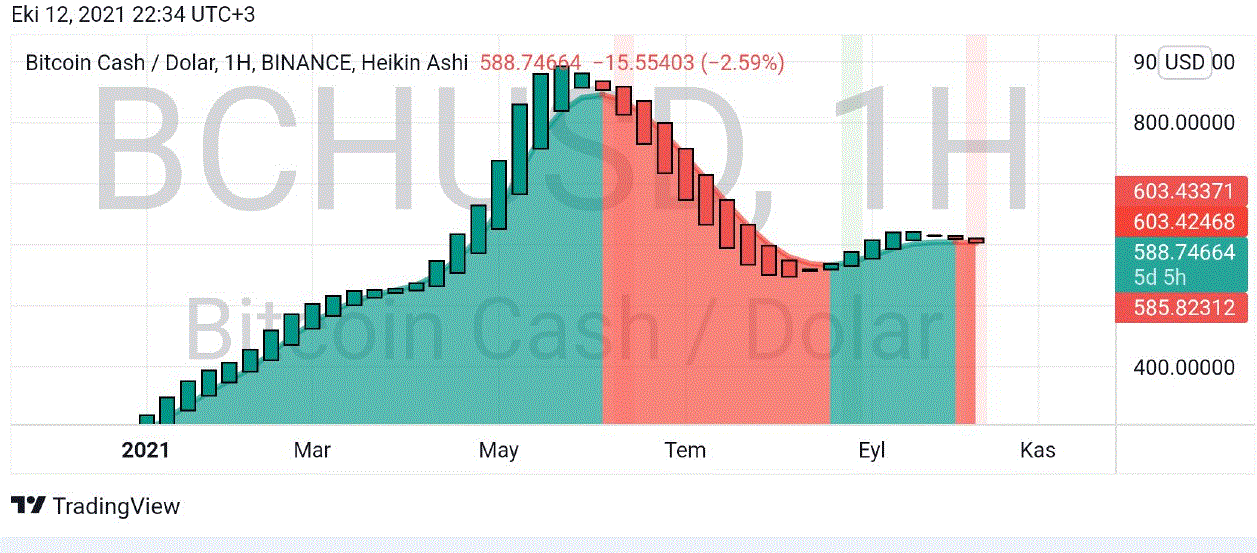
The weekly chart maintains a sell position making it difficult for other small time charts to head up. This is a very normal situation actually. It is normal for the small-time charts to struggle to go up while continuing. BCH has entered a major downtrend that started 22 weeks ago.
BCH must rise above the $604 level again for a rebuy to form on the weekly chart. In order for BCH to succeed, the daily chart must maintain its buy position. If that doesn't happen, the first support level pending below is $382. If things change and a buy weekly position is formed, then it can easily rise to the initial target of $825. Of course, this does not seem so easy to do.
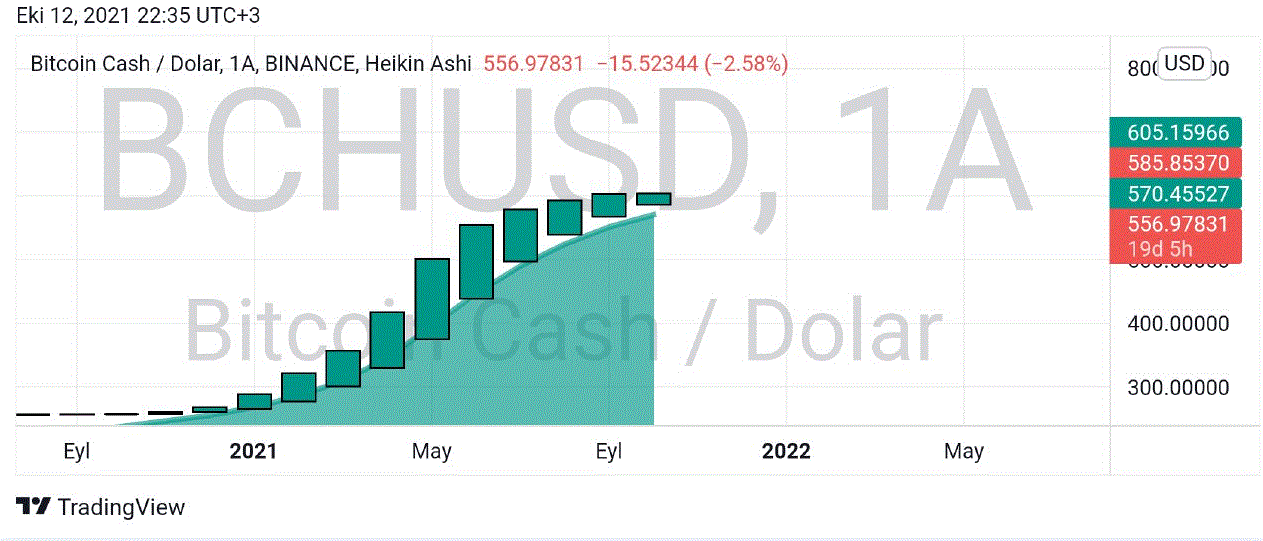
Bitcoin Cash Monthly Chart Decision Stage
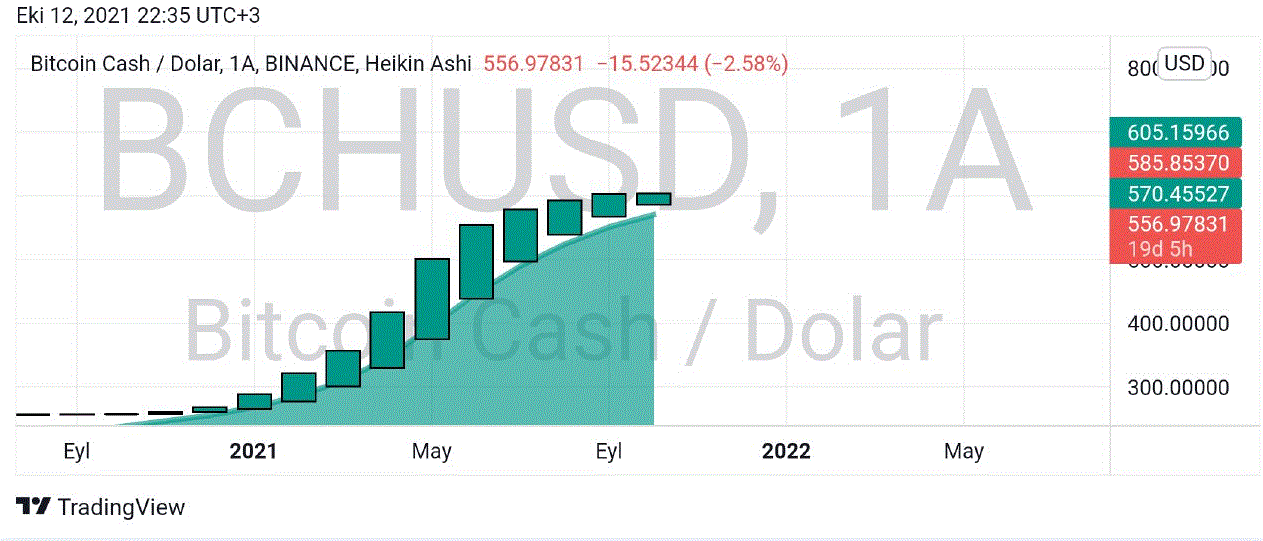
Although this position on the weekly chart creates great danger, it is not without its positive sides. If BCH can stay above the above mentioned resistances throughout October, the direction of the monthly chart will be upwards. However, this seems unlikely at the moment because Bitcoin has started a new bearish movement. Like other altcoins, BCH may also be negatively affected by this situation.
The critical level on the monthly chart is $555. It is very important that it stays above this level throughout October. If a downward move starts, there is a possibility of it going down to $112 level unfortunately!
In addition to all these, it is worth noting that the support and resistance levels given on both weekly and monthly charts are valid for the long term. It may be misleading to act by thinking that these levels will occur in the short term.
It is not investment advice.

Hello im new bie here..