The momentum in the crypto market continues to look strong. Bitcoin breached $19,000 again yesterday after seven straight weeks of impressive gains – the highest it’s been since December 2017. There’s now only one weekly resistance left before bitcoin is ready to push past its all-time high and into uncharted territory. The real bitcoin volume is now also at the highest level we’ve seen since December 2017, and Wednesday’s volume of $5.5 billion even surpassed the previous 2020 top from 13 March.
Elsewhere, both XRP and Ethereum are also on a roll. XRP had an incredible weekend and is up almost 140% over the past week, while Ether jumped over $600 on the back of news that it’s finally ready for launch of Phase 0 of Ethereum 2.0.

Bitcoin correlations, meanwhile, are seeing a change this week. The BTC-XRP correlation has more than halved over the past week. In addition, investors seem to have lost interest in the stock market’s influence on bitcoin right now, as the correlation to S&P 500 keeps decreasing.


Price analysis


An incredible week saw the bitcoin price rise well above both $17k and $18k, which only leaves the weekly resistance at $19,400 – the final resistance level before its ATH. When will this stop? With the current momentum for bitcoin, it wouldn’t be surprising of the price continued up in uncharted territory above $20,000. If the price does retrace from the current level, the lower $16k area could be a possible support level.
Highest spot volume in 2020
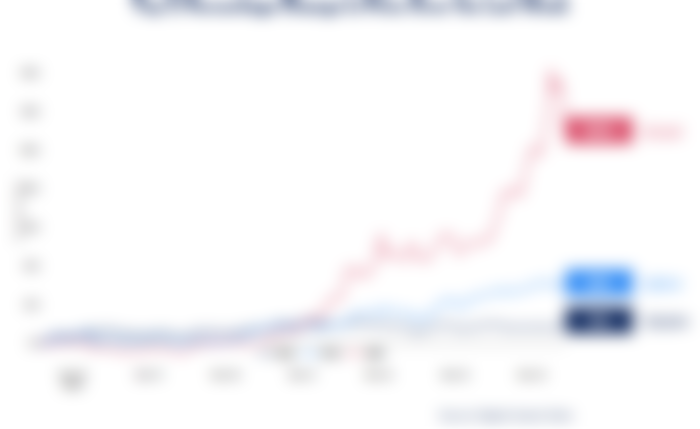
The 7-day average daily real bitcoin volume continued to increase last week. Wednesday’s volume was the highest in 2020 with $5.5 billion traded – even higher than we saw on 13 March, when $5.05 billion changed hands on the leading spot exchanges. The 7-day average daily volume is at $3.5 billion, which is the highest we’ve seen since December 2017.


Market sentiment hits another yearly
high
The Fear and Greed Index pushed all the way to 94 last week – the second-highest value ever. The index has only been higher once, when it touched 95 last summer. The Index is currently at 88 and remains in the upper section of the “Extreme Greed” area.


Volatility stays high
The short term and the long-term volatility are fairly equal this week at around 3%. This means that we have seen daily movements of around 3% over the past month on average. In comparison, this was down around 1% in October and the last month has seen much bigger price movements.


Progress of ETH 2.0 staking:
Threshold reached
We continue to follow the progress on the Ethereum 2.0 staking. With massive inflows over the past couple of days, the threshold has now been reached and ETH 2.0 is ready for Phase 0. We’ve gone from below 100,000 ETH at the beginning of last week, to more than 600,000 ETH – 115% of the required amount. The first phase (Phase 0) is set to launch as planned on 1 December. We can expect to see the new Beacon Chain and the network’s shift from proof-of-work (PoW) to proof-of-stake (PoS).


To the moon🚀