Gonna keep this one short.

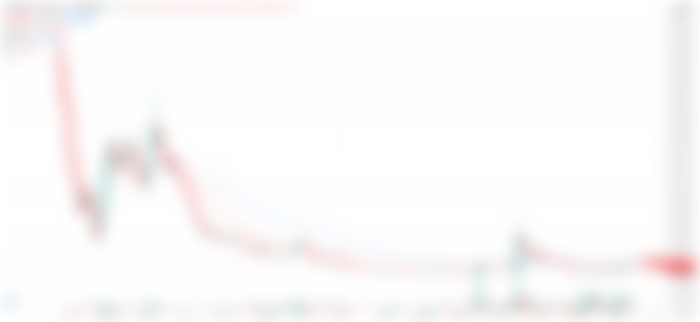
The OMG/BTC weekly chart shows OMG is near the bottom of its price range, barely above its all-time low in 2020. Following the massive 2018-2019 bear market in which most altcoins retraced 90-95% (or more), OMG indeed bottomed out and has formed a large basing pattern over the past 2+ years and is finally starting to form the right-side U pattern.
While OMGUSD has appreciated quite a bit (from 0.42 to now $9.75), this is mostly a peripheral gain due to BTC's rapid appreciation. However, as USD continues to inflate and devalue, measuring against BTC tends to be a better measure for value gained and lost. Therefore, OMG has rallied only slightly against BTC so far and has a ton of upside potential on the OMG/BTC chart. In fact, if you look closely, you can see OMG has only recently broken above the 50 and 200 Week EMAs before pulling back to find support at the 200 Day EMA. This retracement is likely an excellent medium-long-term accumulation price level to capture a huge percentage of OMG's gains in this bull market, which look to be kicking off soon.

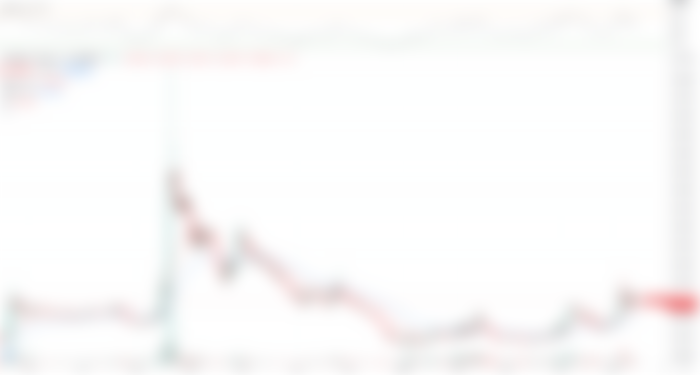
In fact, if you look at the OMG/BTC daily chart below, you'll see OMG has crossed above the 50 and 200 Day EMAs, putting OMG in a short-term uptrend on the daily chart dating back to late March 2021. However, the first higher low occurred in late February 2021, leading us to believe a bottom is officially in and OMG has reverted back to an uptrend.

