Yield Curve Steepens So We Are In The Clear, Right?
The last few months have seen the yield curve steepen dramatically, up 35bps from August's -5bps spread in 2s10s to over 30bps today - the steepest since October 2018.
Great news right? Wrong. While investors buy stocks with both hands and feet, we take a look at how risk assets perform after the curve flattens and/or inverts. According to backtests from Goldman, while risky assets in general can have positive performance with a flat yield curve, risky asset performances tend to be lower. This is consistent with Goldman's base case forecast combining low (but positive) returns from here given the lack of profit growth and a less favouable macro backdrop.
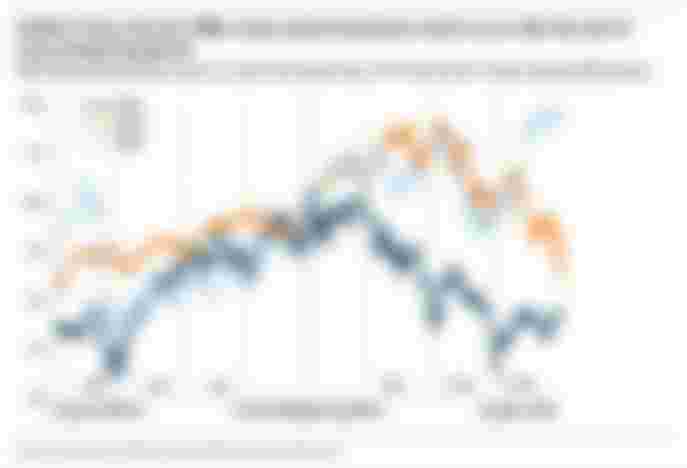
What is far more notable is that since the mid-1980s, significant stock drawdowns (i.e. market crashes) began only when term slope started steepening after being inverted.

And remember, the yield curve’s forecasting record since 1968 has been perfect: not only has each inversion been followed by a recession, but no recession has occurred in the absence of a prior yield-curve inversion. There’s even a strong correlation between the initial duration and depth of the curve inversion and the subsequent length and depth of the recession.
So, be careful what you wish for... and celebrate; because as history has shown, the un-inverting of the yield curve is when the recessions start and when the markets begin to reflect reality.
