Hello dear friends in the community,
The intention of my posts here are to point out glaring financial-specific indicators that we come across over time that would help you identify factors & arithmetics which influence the financial performance of Proof-Of-Work Digital Currencies.
The underlying volatility of the cryptocurrencies could easily be attributed to many factors, but we would like to think that volatility in prices of our favorite cryptocurrencies are influenced in large part by the global exchanges and wash trading strategies of the algorithmic processes put in place to maintain a price level suitable to the market-makers.
As a financial analyst and seasoned professional coming from the conventional investment finance community, I'd like to note some pertinent metrics that could help you form a better picture about evaluating financial performance of Bitcoin Cash $BCH vs Bitcoin Core $BTC financial instruments.
We keep track as part of our CRYPTOKEN team a myriad of internal statistics - many aspects of our fundamental analysis are incorporating both market data performance along with the network statistics of the aforementioned blockchains, for easier comparison between BCH and BTC.


The following graph is provided by the Token Analyst dot io data provider and it clearly shows that all the leading exchanges are unwavering in their accumulation of the BitcoinCore $BTC cryptocurrency, which we must take into consideration as we try to maintain a risk-adjusted balance of our holdings.
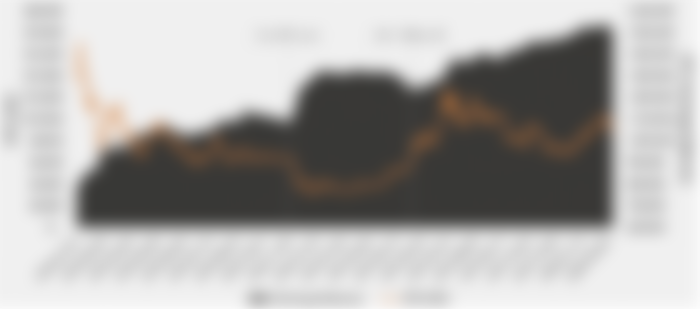

For any single Investment Bank on Wall Street (USA) or Bay Street (Canada) that has been involved with brokering underlying financial instruments and syndicated securities for their client base, any securitized financial instruments from both liquidity and pricing standpoint always depended on the value of the underlying collateral. A similar analogy can be extended to the cryptocurrency space as we can see clearly from the chart I. above that market makers have been very explicit in purchasing BTC holdings on constant basis each month.
Most exchanges along with Binance have rather sophisticated programms in place to protect their asset holdings and are often introducing price support levels in the market via stacked trading walls in order to protect the inventory of their large BTC stock pile. It is also worth mentioning that these very same in-house trading processes / algorithms are often drivers of any bull market we might see in the cryptocurrency space, and not necessary driven by the organic demand by the end users. The underlying volatility in cryptocurrencies helps lead to more trading which leads to more profitability.
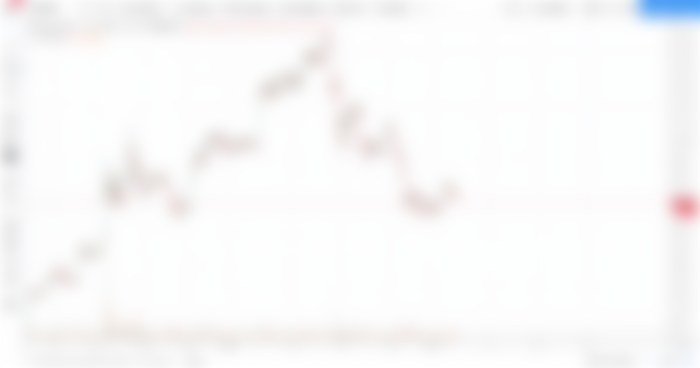
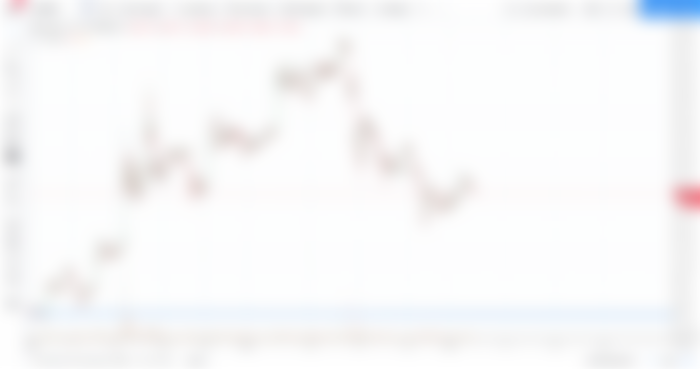
However if we take a quick look at both USD and BTC relative spread of Bitcoin Cash since the beginning of the year (in financial terms we call this YTM or year-to-date performance), we can see that in USD terms BCH has gained a substantial +65.81% and +29.69% in BTC terms. Not too shabby! (chart II and chart III)


I would like to attribute possibly the relative outperformance of Bitcoin Cash vs Bitcoin Core in the aggregate amount of BCH coins sent in USD terms. Fw we quickly reference the Bitinfocharts graphic below (chart IV) you can see that the cumulative amount of on-chain transactions have been increasing ever since the beginning of the year from some 200 mln USD to over 900 mln toward end of February:


We of course would like to propose some additional technical indicators that will help users evaluate the relative price appreciation of BitcoinCash in absolute terms, and as we saw earlier the algorithmic trading by the global exchanges will always introduce some price variability for all cryptocurrencies including Bitcoin Cash.
One of our trading suggestions is that once a coin realizes a 3 month stronghold, the traders to simple convert part of the balances into stablecoins and secure those capital gains by purchasing HonestCoin : BCH with a full USD peg.
I will have a follow up article on Read.cash on technical trading and more fundamental analysis, but in this I note wanted to merely introduce some financial topics on the relative performance of Bitcoin Cash vs Bitcoin Core - so users can become more accustomed to certain indicators such as Price / Total Coins Sent in USD terms. A similar analysis is often compiled on stock market indices to better cope with risk-adjusted returns forecasting and assist investors derive a picture on the follwing metrics such as Dividends to Price, or Cash Flow to Price trading multiples. Until next time, I am happy to hear if you enjoyed our brief discussion here, we are happy to provide some financial analysis on Read.cash going forward!
Yours, CRYPTOKEN_board.