About 3 years ago, Bitcoin (BTC) began its most important phase of bullrun that brought the value of the asset to over $20,000 and had that period identified as the "crypto bubble".
The situation of those events made it very easy to criticize the crypto mentioned as a mere momentary bubble, even common to that of the Dutch tulips, rather than go into an explanation of the phenomenon or at least try to understand what the next collapse was.
So today, with hindsight, we will do just that: analyze the data in our possession and reconstruct the reason for the collapse, providing an explanation that can come closer to reality.
We all know the deflating nature of bitcoin and many are aware of the asset price chart that shows the correlation between the bull and bear phases taking into account the halving of the asset, which is expected to be repeated even after the next halving, in less than a month.
Obviously no one can predict whether there will be a new bullrun phase with the halving, also because the current situation is very different from what was expected during the previous halving.
A comparison with Bitcoin Cash
To do this analysis we will take as reference some parameters such as BTC block size, fees and market dominance, and we will compare them with a similar blockchain, i.e. Bitcoin Cash (BCH), taking as reference the same time frame, i.e. the peak of December 2017.
It 's clear that over time the capacity of the block on the bitcoin blockchain, limited to 1Mb, has taken about 7 years to become saturated and that this is very related to the price that has followed the asset over time.
At the time of the peak, in fact, this limit affected the progression of the bullrun and also affected the cost of fees because at that very moment, when the block was saturated, priority was given to transactions with higher fees.
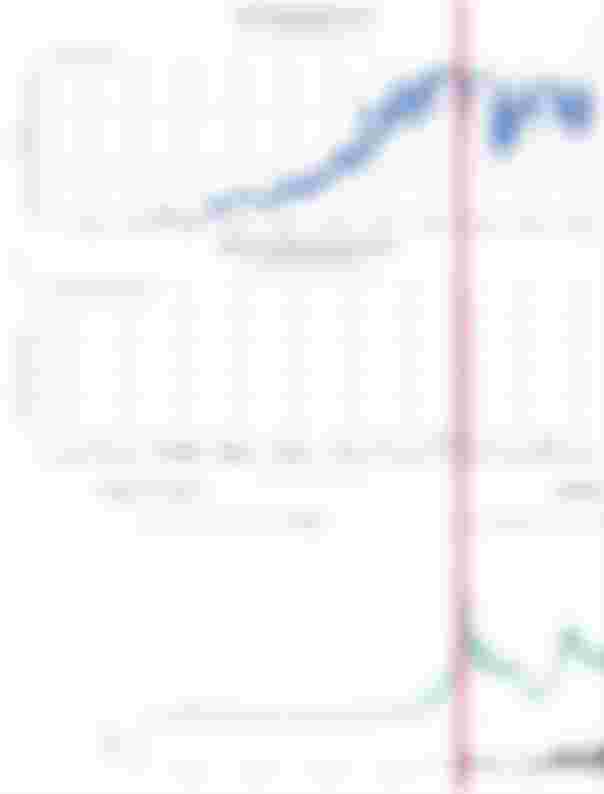

Crossing the various charts we can see how the combination of price and limit factors of the block affected the price of the fee, but this also had an effect on the bitcoin value itself that for technical reasons did not allow the bullrun to continue.
Analyzing instead the size of the blocks on Bitcoin Cash, we can see how much theoretically would have been needed for bitcoin to handle all the transactions.


It's amazing to see how bitcoin has barely 32% dominance, while the most incisive cryptos were Ripple (XRP) and Bitcoin Cash (BCH) which meanwhile has seen the block size grow to almost 5Mb.
In conclusion, we can only take note of the data and therefore of what happened in the past to try to predict if and when the next bitcoin bullrun could happen: if a similar situation occurred we could see once again the same causes that led to the stop of the bullrun i.e. the block saturation, but this is just a hypothesis that we could observe in the next month when the new halving will happen.