A simple way to read market chart
This type of reading chart is only base in my research and understanding in market cycle flow.
First step we need to do is look a crypto token pairings in your platform that was had at least 0.25% up to 20% ratio of changes fluctuation. it much better if we choose an altcoin that was in had correlative movement in Bitcoin or Ethereum for at least 40-60% correlation movement so on that way you will had a better grasp on its market cycle for this day or week. well to be honest what we I will teach now is at least had 20% of strategy from Elliot wave and the rest was from some community group and VIP trader.
The goal of this strategy is to uncover some potential direction according to the present analyze and data of the present market cycle. if you made a correct insight according to this strategy it could make you a massive profit from just few days or week.
Now lets start to uncover all details of the strategy to analyze the data of the market.
Step 1. know the 24h and 1 month All time high price and all time low price
because on this manner we can set our target price goal and opening price since we can category the bear price limit and bull price limit for a certain time market cycle.
with the 24h ATH price and ATL price we can start to analyze and little by little uncover the market movement for a week or even for a month. since according to Elliot wave once the change price movement of the first three 12h candlestick had same ratio or just a little bit different in % change movement it will means of a good wave of market cycle such as XYZ pattern of 3-5-3 or ABC pattern of 3-3- 3 as long it will not reach the ATL or ATH for the month it will keep the movement wave with an obvious manner.
the 1 month ATH and ATL will be your starting line or end line to check the full cycle of the market.
STEP 2 . check the total supply market and total volume for 6h and 12h.
why we need to check the Total supply market and volume? so we can have a good base data for what the market direction will be. 30% of the market price is base on this data. while the other % was come from promotion, news effect , and project development of the token.
The 12h total supply was said had the biggest impact for the market price movement for entire week. which is supplying the first 42 waves of the 4h timeline market which is had a total of 168 price move for 1h time line. while the 6h volume is the one supporting the price movement of the 672 waves cycle for 15 mins time line chart and its totally wrecking or supporting the 2016 wave price market for 5mins time line.
if the next 6h total token supply is much greater on first 6h total supply of the then it means the price is in bearish. which is supported by the data of the present 12h is higher than total supply of yesterday supply in token then it will be a good indication of bearish. but once the 6h token supply is lower than the first one then the total 12h supply in token in present is lower than yesterday supply then its indicate of bullish movement. (take note this is only affected the next 2 days market cycle.
Step 3 . keep watch the 5mins and 15 mins timeline then support your insight from 4h and 12h timeline.
The market movement is easy to analyze and get produce a good insight once you check the last three candlestick on the 12h chart of last weekend . while you observe first the first 2 candlestick in 4h chart if its moving had +2 to 10% or -2% to 10% change in price. if its in over +2% change then it had a 40%-60% of chance to bullish but if its over-2% then it had a chance to move in bearish. It will great supported by the next first 2 candlestick in 15mins chart. was same on your first 4h candlestick or if the 5mins candlestick is moving by ratio of over 3-5 % change price. you can confirm the first half market cycle of the week by this observation since the transition or market cycle is always in 80% transition or moving in the different direction from last week price market cycle while 40% assurance of market cycle movement for correctional move.
here are example how to read some chart and analyzing it.

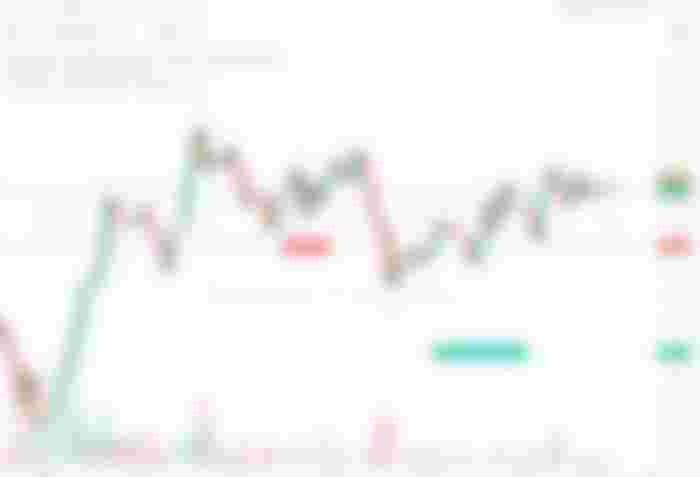
first lets check the 12h chart and put a target price for long and short and see what is the much shorter range from opening price of the last candlestick. also lets check the trending move of the market for the past few weeks. you see in chart that the trend is short but the last 4 candlestick is in bullish movement now we will check in 4h chart if this 12h bullish will keep up or it will already switch.
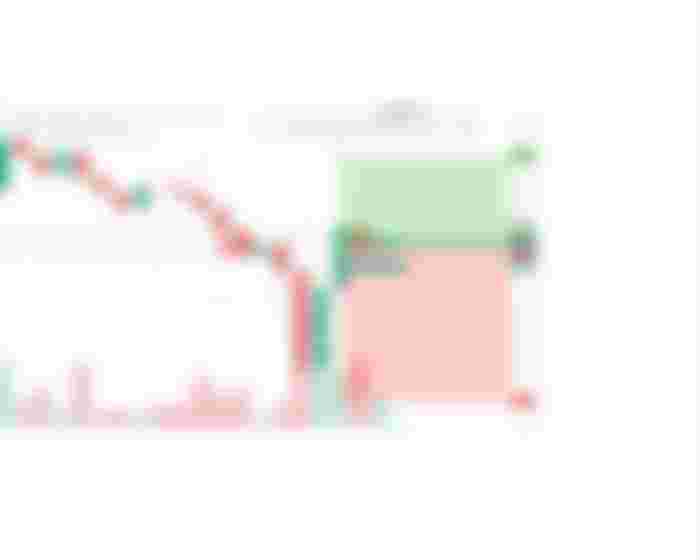
from the picture below of the chart 4h as you can see the bullish movement is already clearly exhausted and its already done in one full market cycle so there is a big chance that it will drop soon. lets check now the 1hr chart next
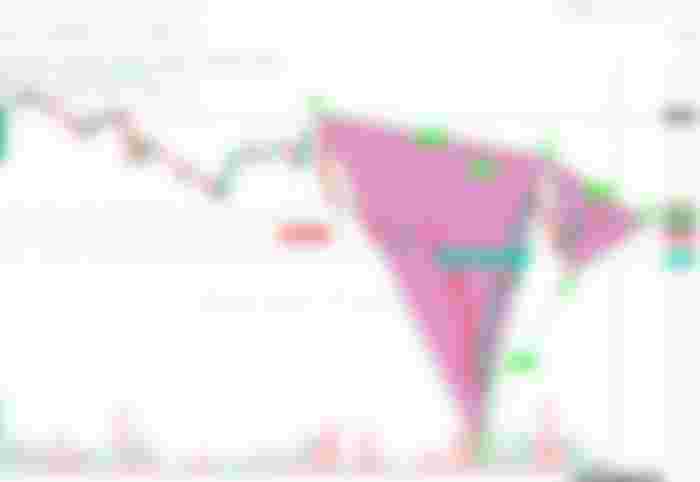


as you can see on chart image the momentum of bearish is forming already and all the candlestick of bullish that you see was already in little change means the pressure of the those who is shorting is greater and in anytime it will do a biggest movement for its momentum to form a bearish market. now we just only need a perfect entry price so we will go in 5 mins chart to look a pin candlestick as our signal to entry. take note what you need to wait is only a 1 candlestick of short that had -2% change to secure that it was already start of bearish.