 @thebrownpound
Stonk Chart: Oliver Kell $TSLA Trade 2020 Oliver Kell is the US Investing Champion last year with a juicy return of >900% 🚀🚀🚀. Insane! I reviewed one of his best trades, $TSLA 🚗. Oliver's focus is on momentum stocks and his entries and exits are based on the following: 1️⃣ Reversal Extension 2️⃣ Wedge Pop 3️⃣ Base and Break/EMA Crossback
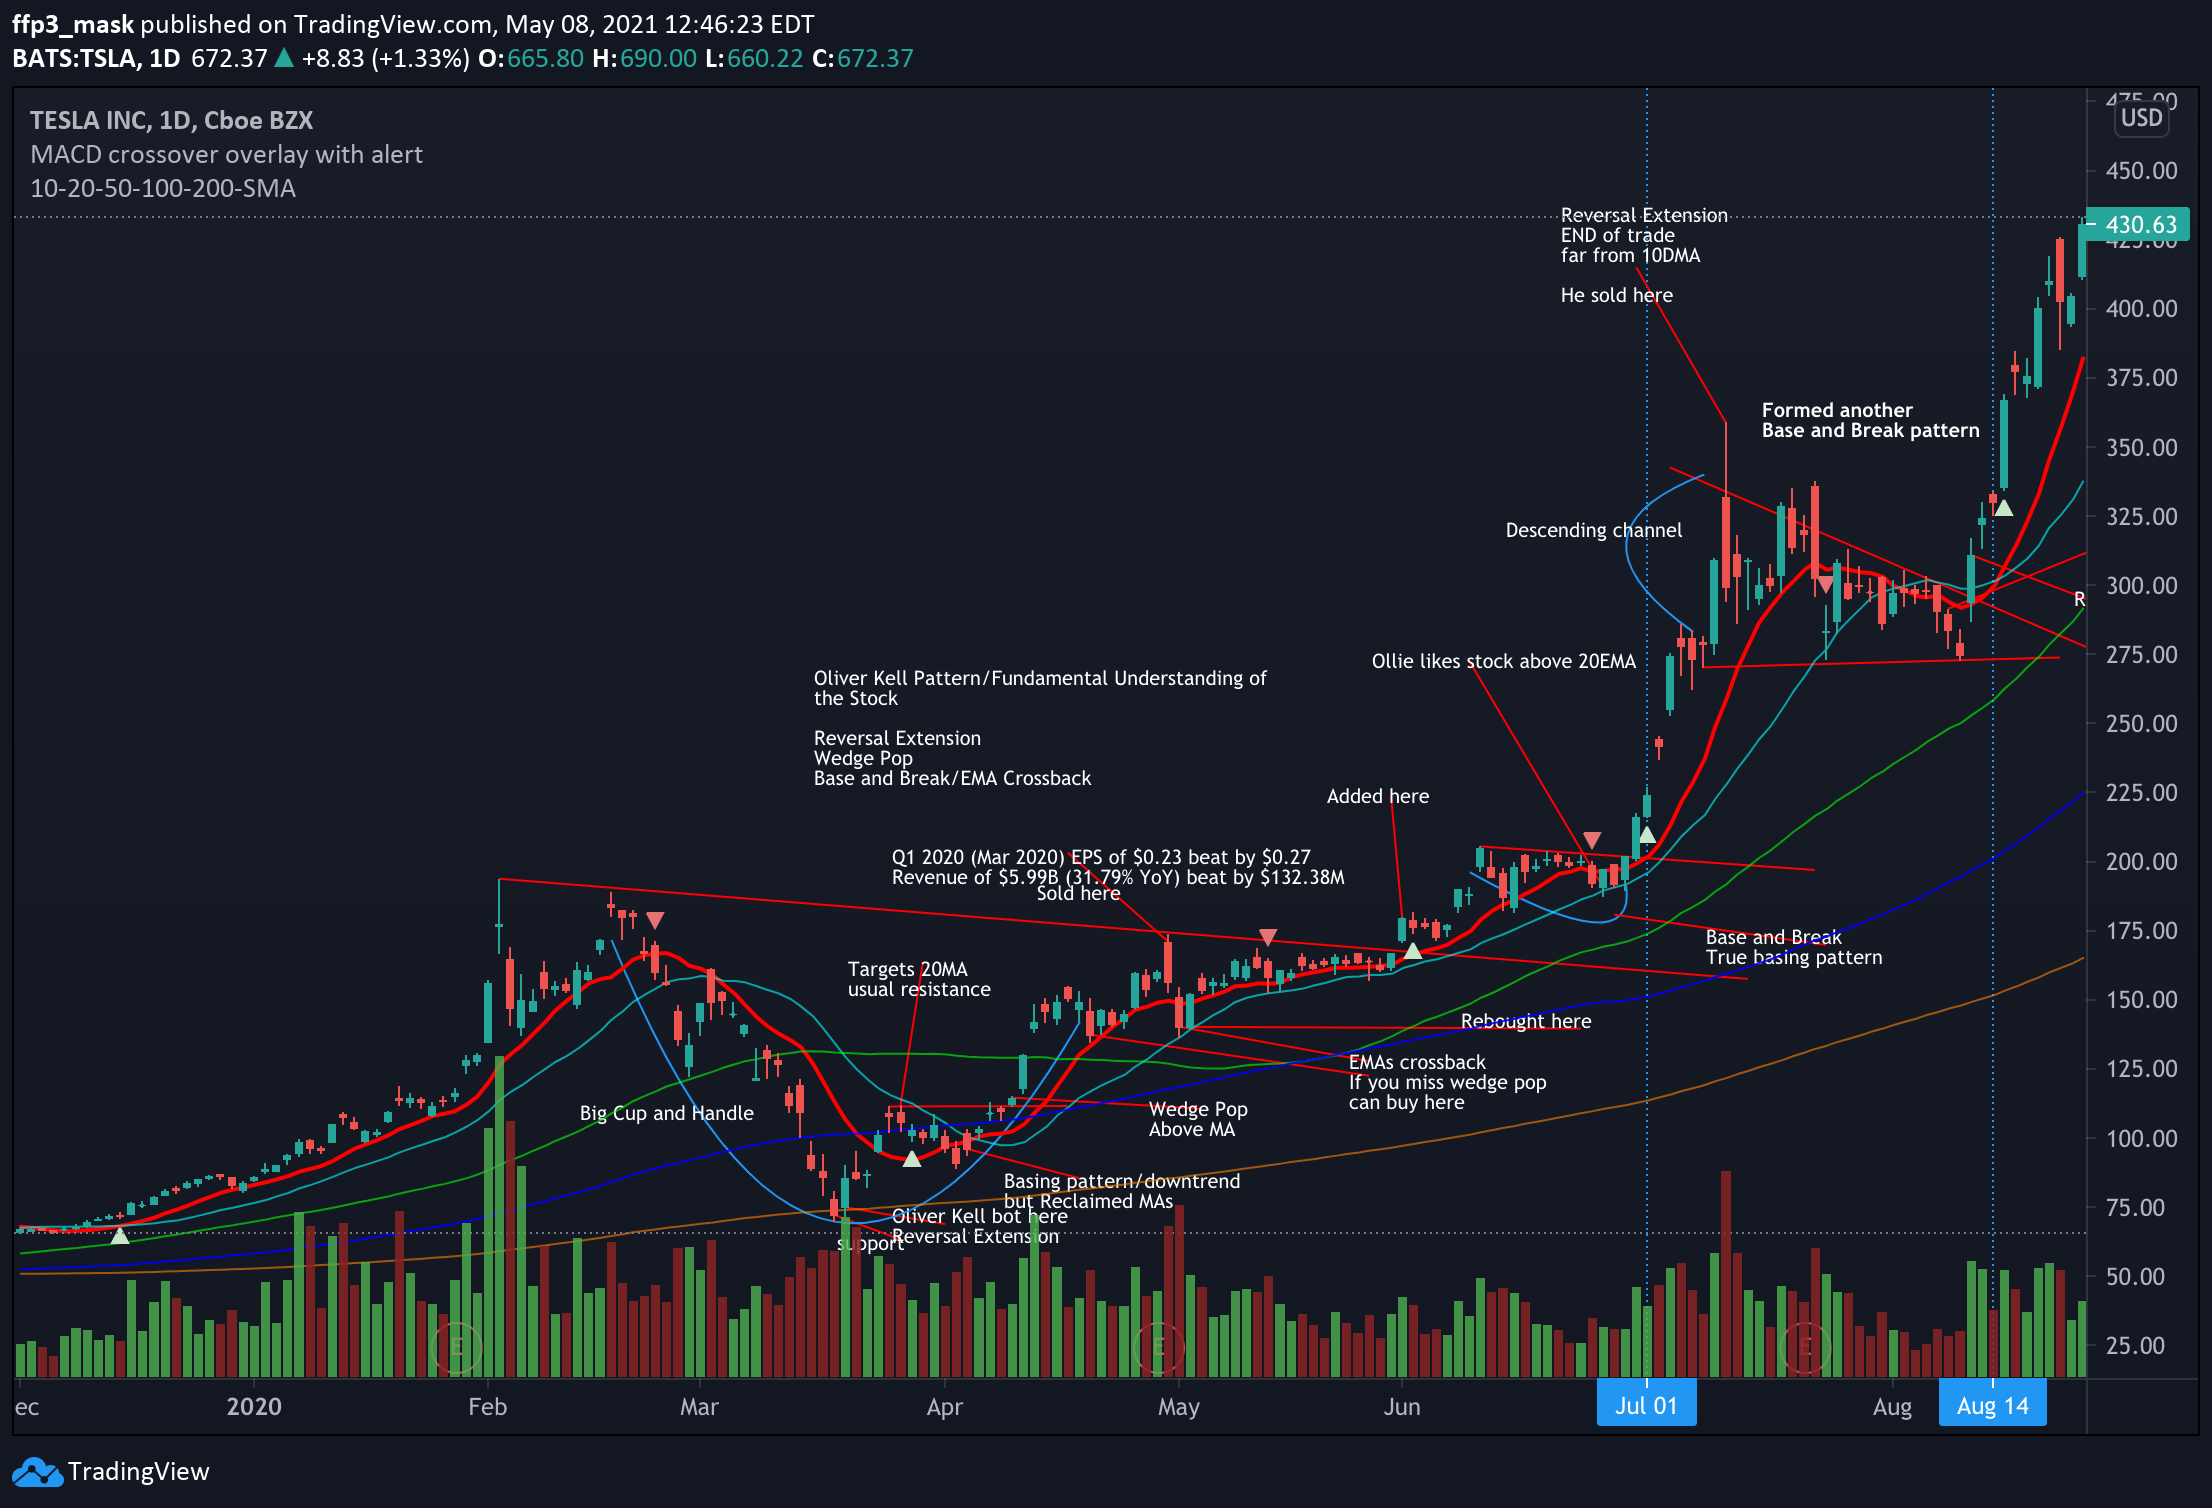
Bought March 19 on 50MA support. Stock showed strength despite market weakness. He sold at 20MA, stating this is were the resistance usually is to the upside. Bought April 9 on pop (break-out). Sold on earnings. Bought May 1, EMA crossback. On the chart this is a 20MA support. Added June 1 - pop. Ended trade July 13 - fully extended from 10MA.
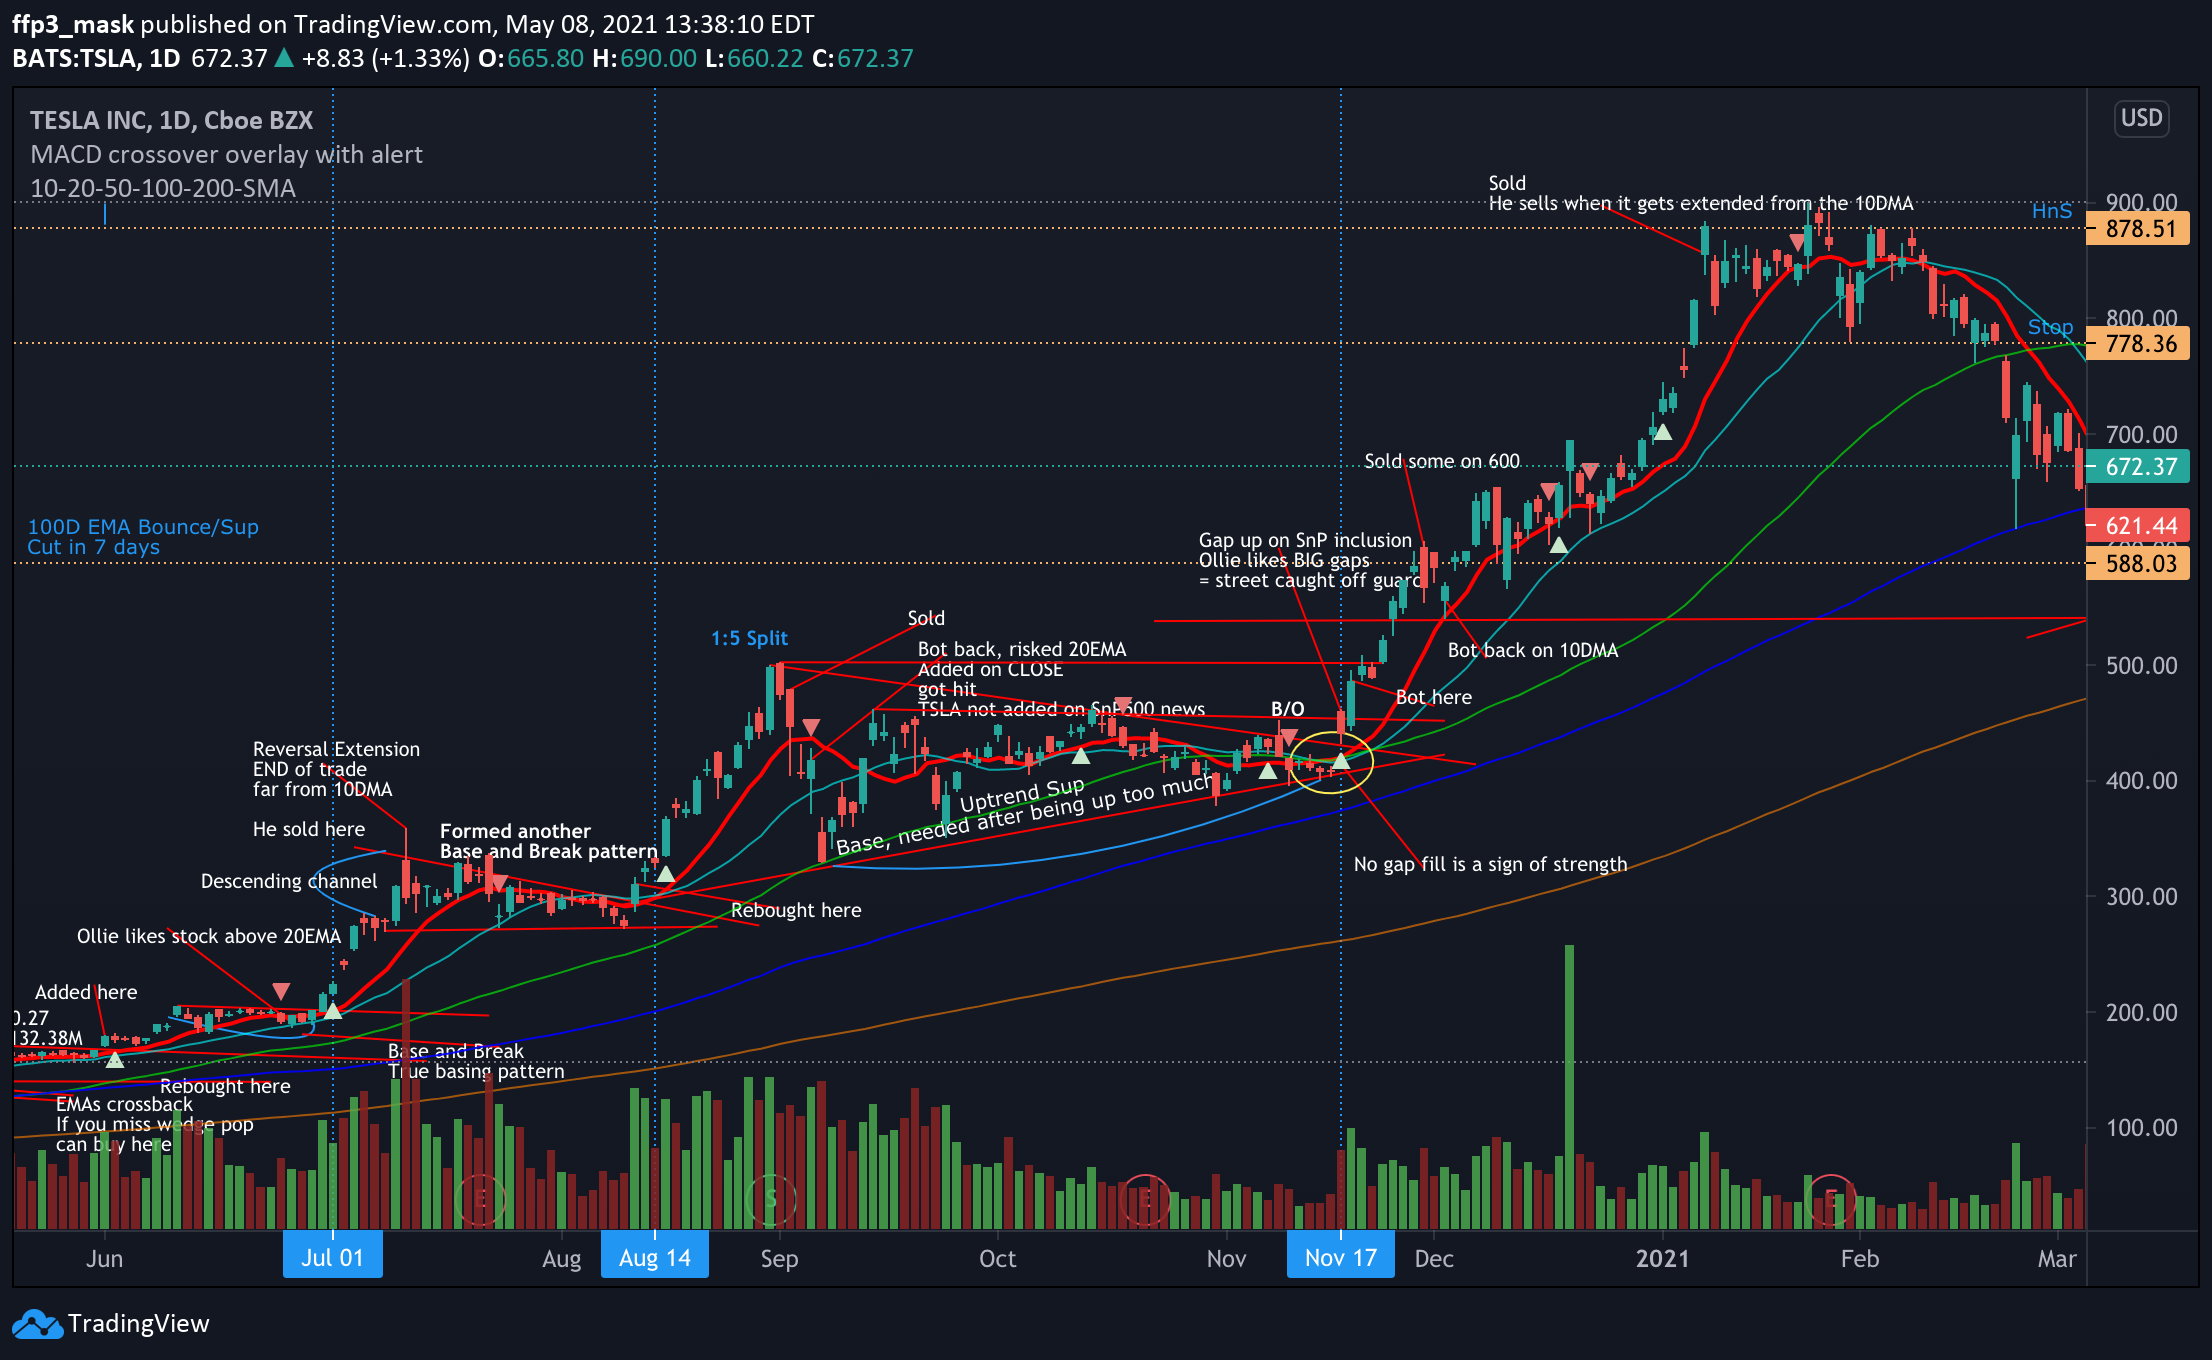
Bought August 12 after end of base pattern (pop). Exited September 2. Re-bought September 4, got hit after news that Tesla was not going to be on S&P500. November 18, bought on episodic event (inclusion to S&P500). Sold November 30. Bought back December 2 on EMA crossback. Ended trade on January 3, 2021. What can we learn from his strategy? ✅ Entries on breakout (wedge pop) ✅ Re-entries on MA support (rising) ✅ Sells when extended from 10MA ✅ Follows stock relative strength and story /END.TBP
No comments yet