 @stewbits22
more from that month
@stewbits22
more from that month
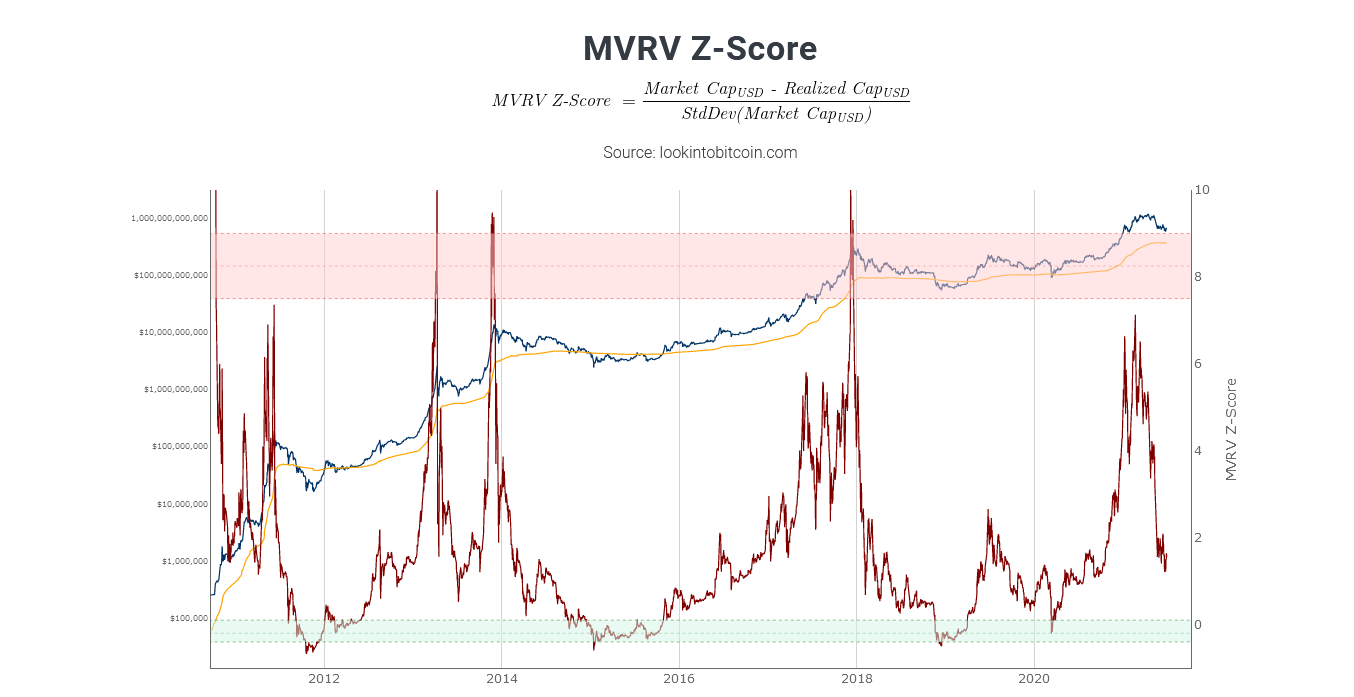
The MVRV - Z Score How would you like an indicator that knew when trading firms moved large sums of money for buying or selling specific stocks. Well thanks to the transparent nature of the blockchain we can do this for Bitcoin. Introducing The MVRV - Z Score It uses blockchain analytics to determine if Bitcoin is over priced or under priced. It uses three metrics 1. Current Market Cap 2. Realised Value. An interesting calculation that works out the market cap according to the price of each bitcoin when it was last moved. This Market Cap called Realised Value only exceeds Current market cap in very bearish markets. 3.Z Score is the plot of standard deviation between Current market Cap and Realised Value. When there is extreme divergence in the SD values this will point to over valued or under valued conditions. It is interesting to note that the Realised Value has a stepped appearance very similar to the stock to flow chart. I think of it as fair value with market speculation and emotions stripped out. On the chart shown the Z line plots the Standard Deviation, when it enters the pink box it shows the market as being at the highs and when it enters the green box the market is at the lows. Please see the following link for more in depth analysis. https://medium.com/adaptivecapital/bitcoin-market-value-to-realized-value-mvrv-ratio-3ebc914dbaee
No comments yet