 @hooiyewlim
more from that month
@hooiyewlim
more from that month
Bitcoin at a Crossroads: Will It Reclaim $100,000 or Is the Bull Run Over?
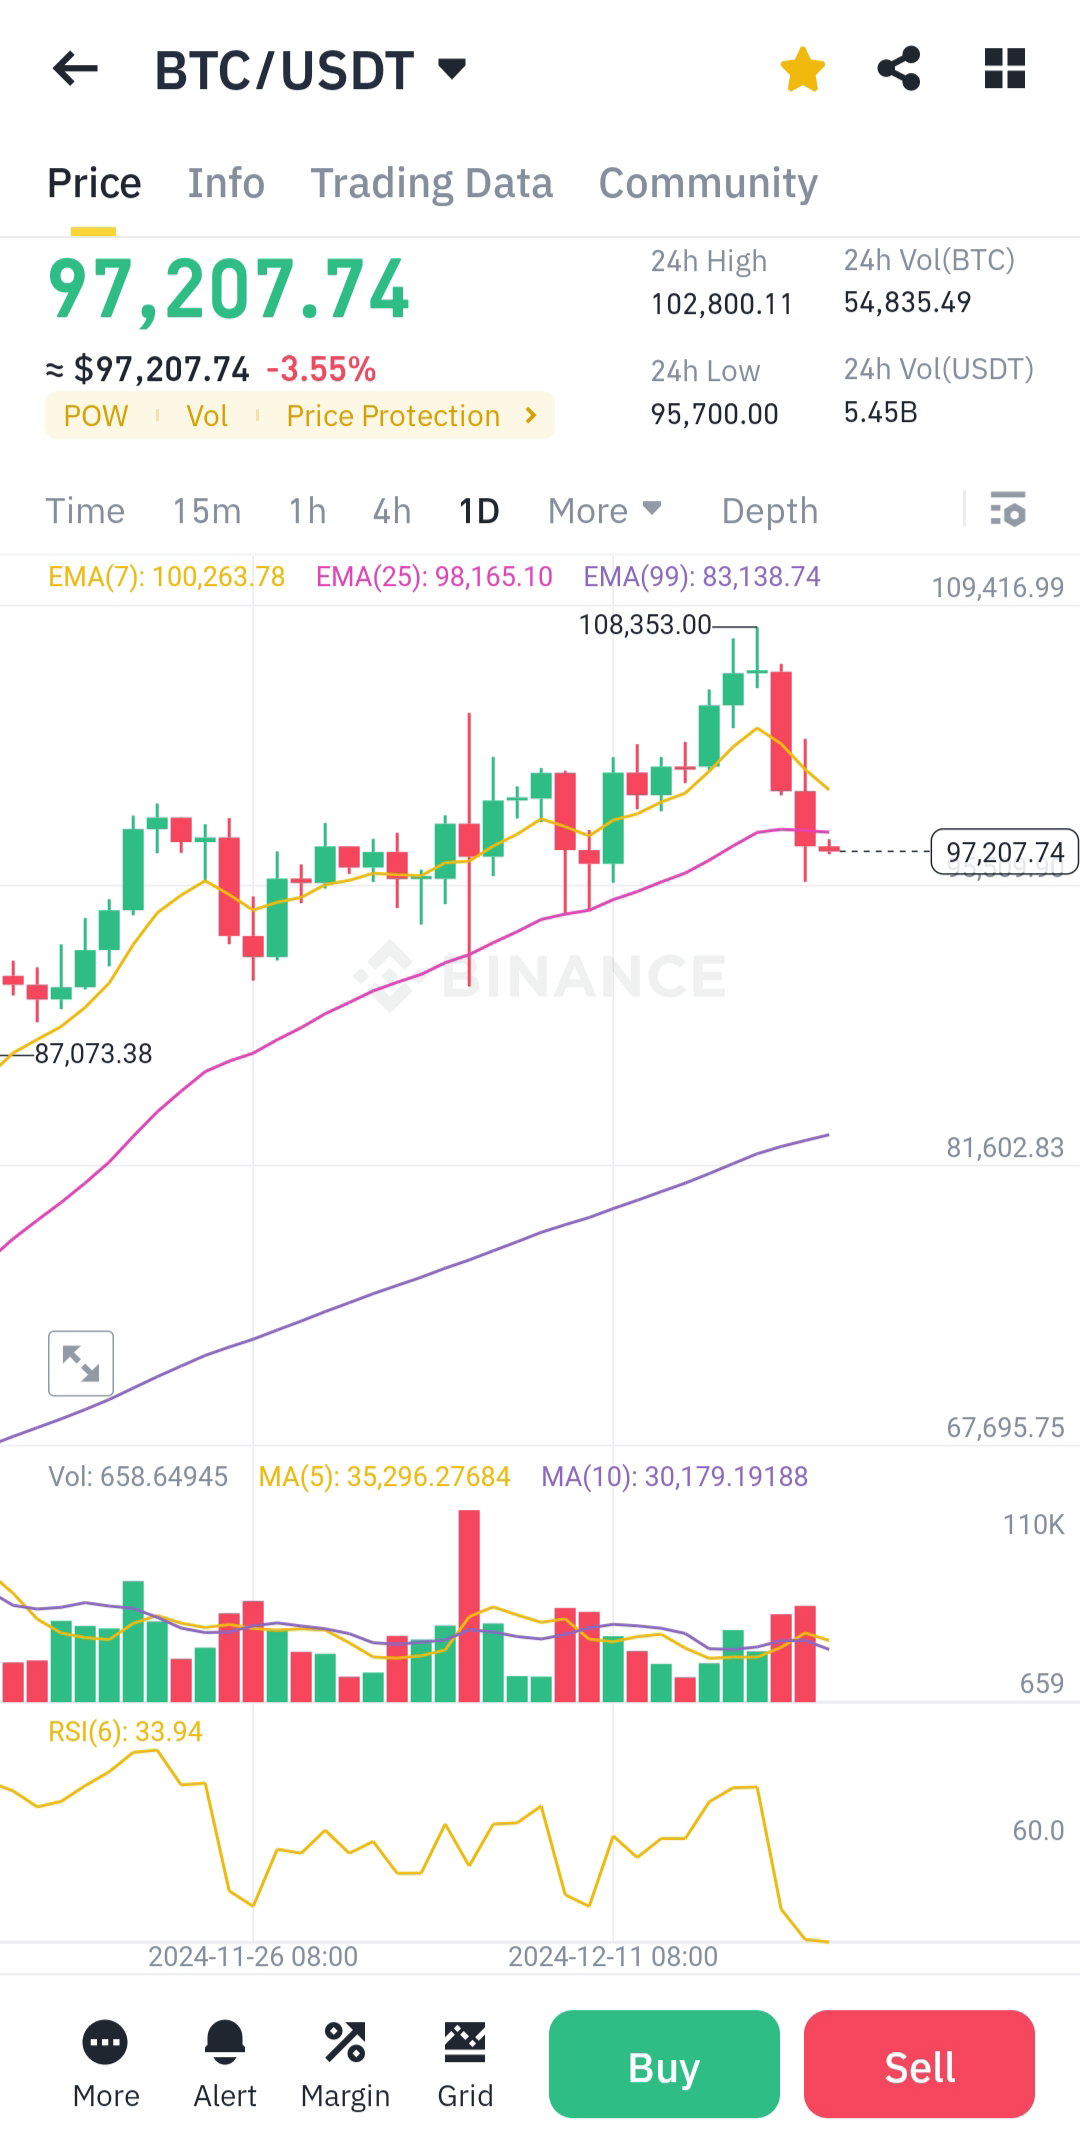
Look like BTC take a heavy beating last 24 hours, it went from $108,000 to now near $97,000. Let's see what the chart say about BTC. Here is the technical analysis of BTC/USDT 1. **Price Movement and Trend** Current price: $97,207.74 (-3.55%). 24-hour range: High of $102,800.11, low of $95,700.00. The price has dropped below the EMA (7) ($100,263.78) and EMA (25) ($98,165.10), suggesting bearish momentum in the short term. 2. **Exponential Moving Averages (EMA)** EMA (7) is above EMA (25), indicating that the short-term trend was recently bullish but is weakening as the price approaches EMA (99) ($83,138.74). The price currently tests EMA (25), which may act as temporary support. If it breaks below, we could see further downward movement toward EMA (99). 3. **Volume Analysis** The volume is moderate, with no significant spike indicating massive buying or selling pressure. The lack of volume during a pullback suggests potential for further downside unless buying increases. 4. **Relative Strength Index (RSI)** Current RSI (6): 33.94. The RSI is near the oversold zone (below 30), indicating selling pressure but also the possibility of a short-term bounce if buyers step in. 5. **Candlestick Patterns** Recent red candles show strong selling pressure, with wicks indicating attempts by bulls to defend key levels but failing to sustain upward momentum. 6. **Support and Resistance Levels** **Support:** $95,700 (recent low). $83,138 (EMA 99 and major support zone). **Resistance**: $100,000 (psychological level and EMA 7). $102,800 (24-hour high). **Conclusion** The current chart indicates weakening bullish momentum, with the price breaking below short-term moving averages and RSI nearing oversold levels. The failure to hold $100,000 could signal that the bull run is under threat unless there’s a strong rebound supported by higher volume. **Will BTC go back to $100,000?** If the price holds above $95,700 and bounces back with increasing volume, a retest of $100,000 is possible in the near term. However, failure to maintain this level and a further drop toward EMA (99) at $83,138 could signal the end of the current bull run, at least temporarily. A decisive move above $100,000 is required to confirm renewed bullish momentum.
No comments yet