 @hooiyewlim
more from that month
@hooiyewlim
more from that month
Bitcoin's Bearish Breakdown: Will Support at $93,500 Hold?
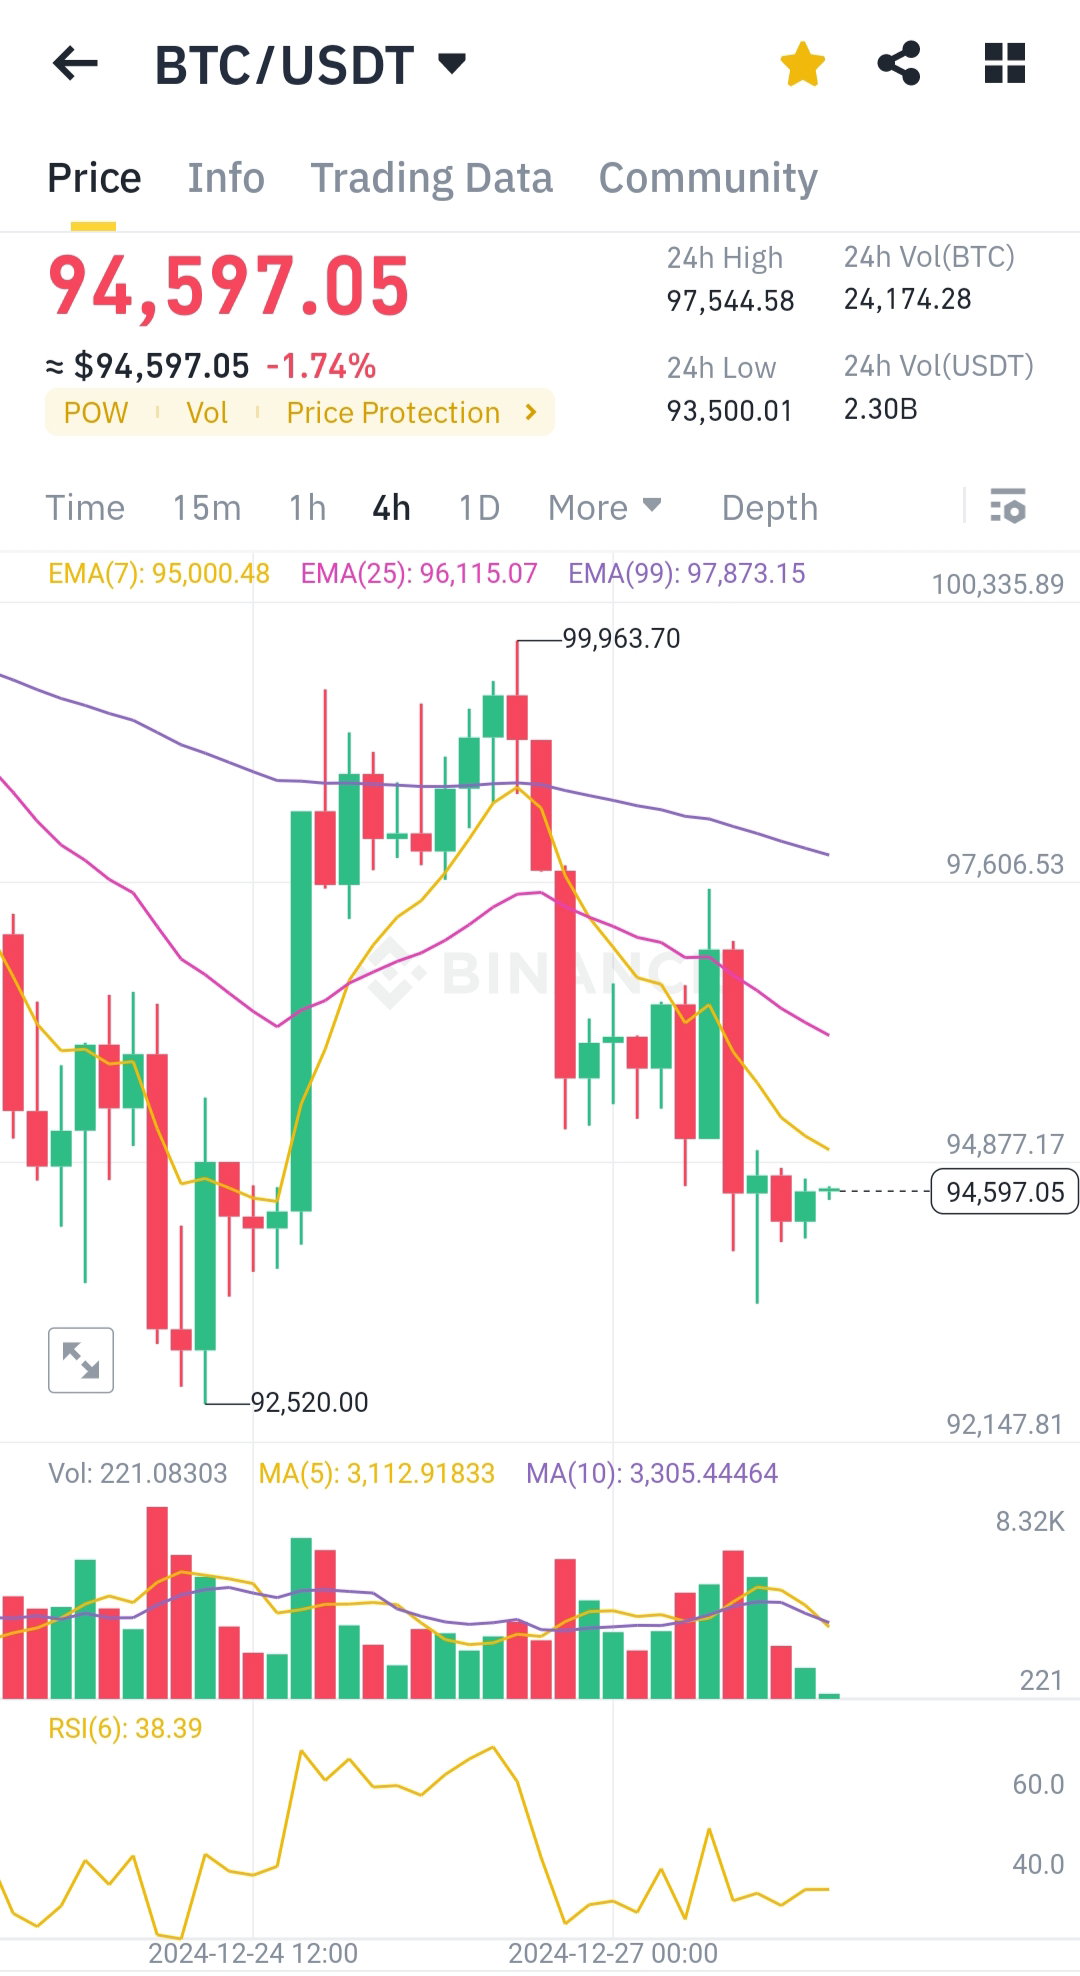
Last 24 hours we suddenly see a small dump in BTC price. I personally think it will go down more because of Chinese new year around the corner. Let's see what the chart say. **Detailed Technical Analysis of BTC/USDT (4H Chart):** **Price Action:** Bitcoin's current price is $94,597.05, showing a 1.74% decline over the last 4 hours. The price is testing support near the 24H low of $93,500 after failing to sustain levels above $97,000 (near the EMA(99)). **Moving Averages**: **EMA(7)**: $95,000.48 (Price is trading below this short-term EMA, indicating bearish momentum). **EMA(25)**: $96,115.07 (Price is below this medium-term EMA, reinforcing bearish bias). **EMA(99)**: $97,873.15 (The price is far below the long-term EMA, confirming a strong downtrend). **Volume Analysis:** Recent declining volume indicates waning interest, suggesting limited buying pressure during this bearish phase. **Relative Strength Index (RSI):** RSI(6) is at 38.39, approaching oversold territory but not signaling a reversal yet. **Key Levels:** **Support**: $93,500 (24H low) and $92,520 (previous swing low). **Resistance**: $95,000 (EMA(7)) and $97,873 (EMA(99)). **Overall Trend:** The market is in a downtrend as the price consistently trades below key EMAs. RSI indicates bearish momentum is still active, but it’s approaching oversold levels, hinting at a possible rebound near strong support. **Conclusion:** Bitcoin's bearish momentum continues with key support at $93,500. A bounce from this level is possible, but failing to hold could push prices to $92,520 or lower. Bulls need to reclaim $95,000 to shift the momentum.
1 comment
Bitcoin Cash is a much safer bet since it has actual utility like on chain DeFi and instant/cheap transactions. It is the currency of the future.