 @hooiyewlim
more from that month
@hooiyewlim
more from that month
Technical analysis of Bitcoin on 14 Dec 2024
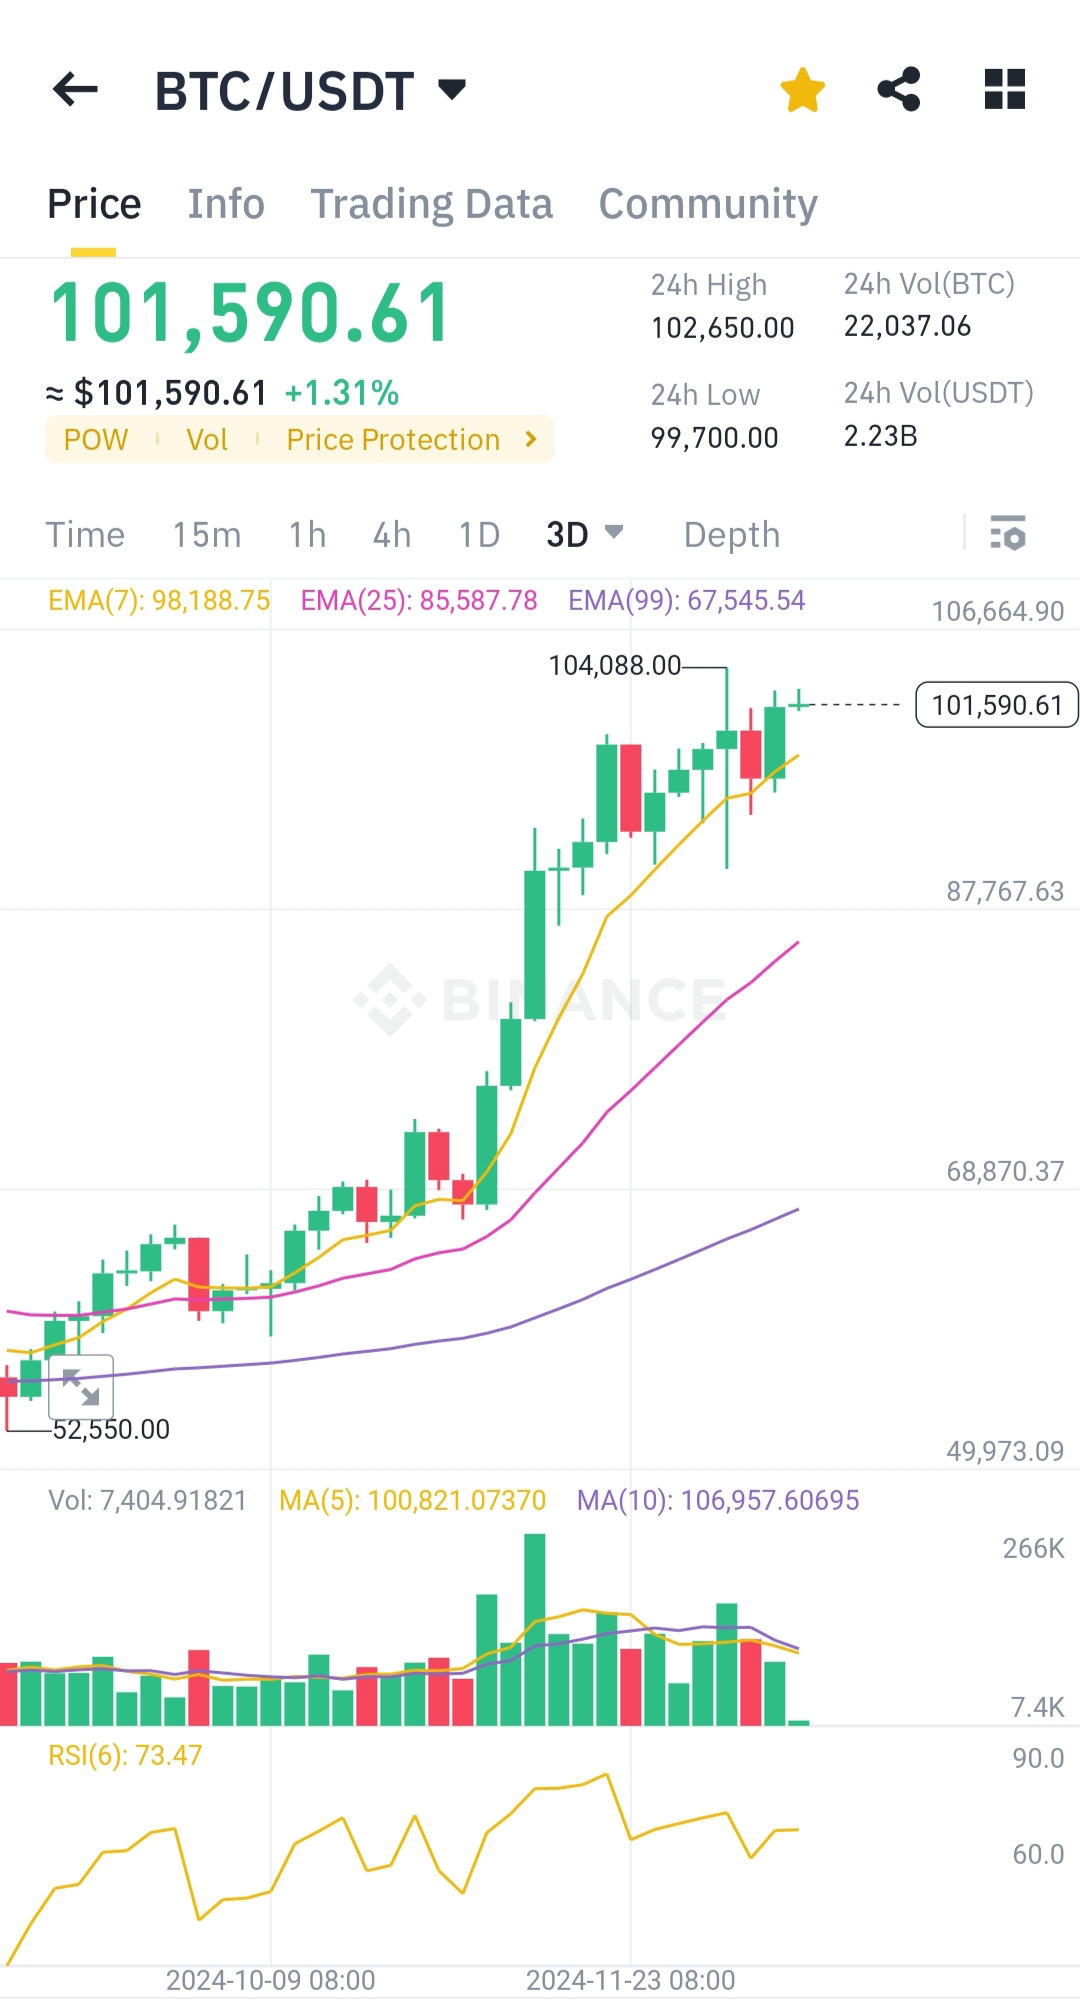
Here is the Technical analysis of bitcoin on 14 Dec 2024. **Current Price Trend**: Bitcoin's current price is **$101,590.61**. The price is near the recent high of **$104,088**, which indicates a strong upward momentum over the past few days. **Moving Averages**: **EMA(7):** $98,188.75 (yellow line) — This short-term moving average is below the current price, suggesting the bullish trend is intact. **EMA(25):** $85,587.78 (pink line) — The medium-term moving average is far below, indicating strong upward momentum over the past weeks. **EMA(99):** $67,545.54 (purple line) — The long-term moving average shows that the overall trend remains bullish. **Support and Resistance**: **Support:** Around **$98,188** (near the EMA(7)). **Resistance:** The recent high at **$104,088** is the next key resistance level. **Volume**: Trading volume shows a healthy mix of green (buying) bars, indicating continued buying interest. **Relative Strength Index (RSI)**: **RSI(6):** 73.47 — This value suggests the market is approaching an **overbought zone** (above 70). While this signals strong buying momentum, it also indicates a potential pullback if buying pressure weakens. **Conclusion:** Bitcoin is in a strong uptrend, with short-term support around $98,000 and resistance at $104,000. The RSI suggests caution as the price may experience some pullback or consolidation before continuing higher. For now, the trend remains bullish unless price drops significantly below $98,000.
No comments yet