 @hooiyewlim
more from that month
@hooiyewlim
more from that month
Technical analysis on pax gold on 14 Dec 2024
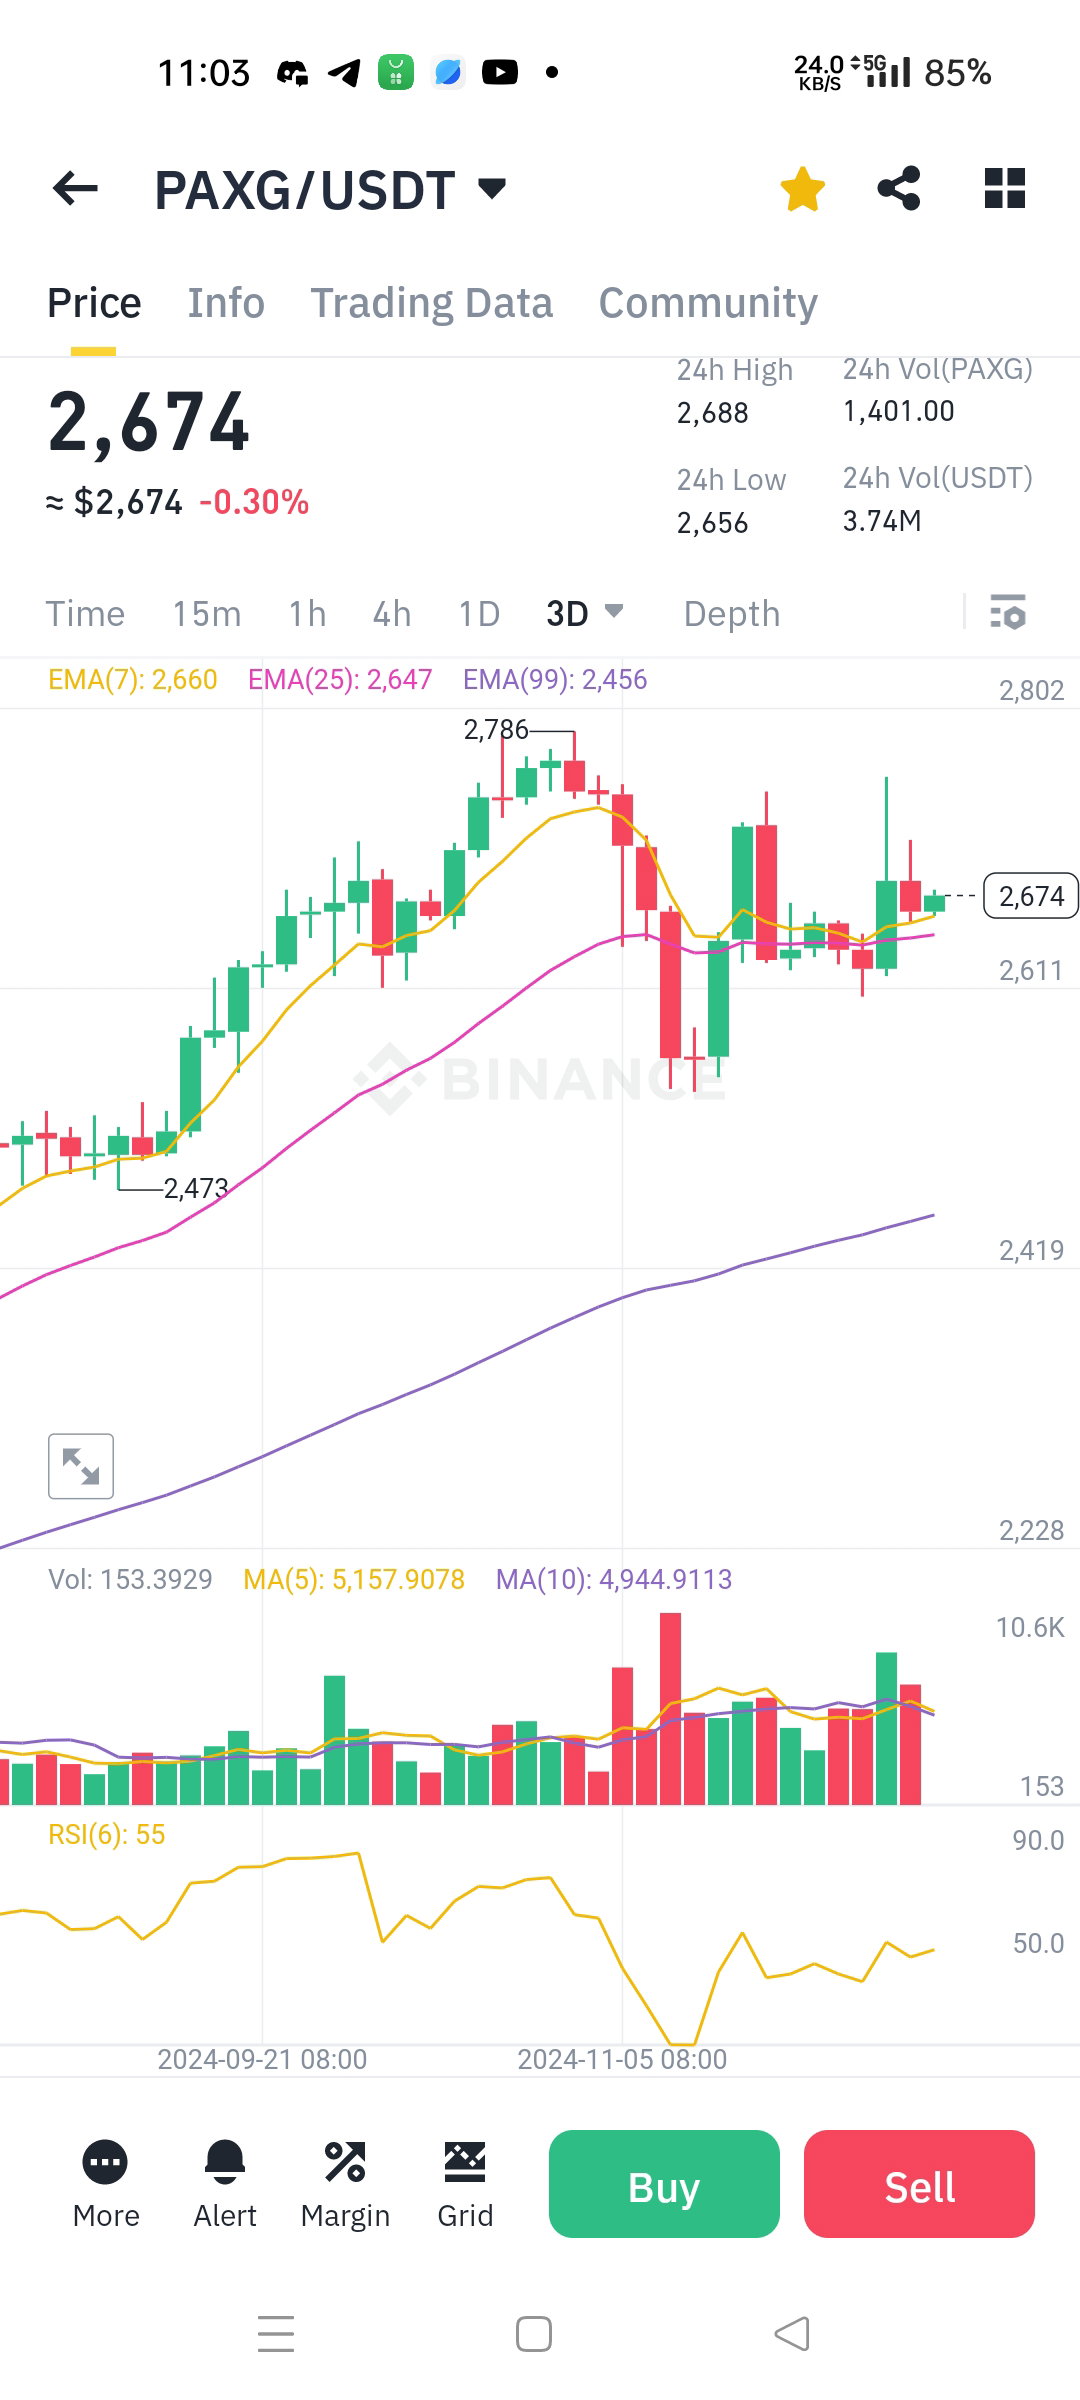
Based on the provided screenshot, here’s a detailed technical analysis of PAXG/USDT using the visible indicators and chart patterns: 1. **Price Action**: **Current Price:** $2,674. Recent High: $2,786, indicating resistance at this level. Recent Low:$2,473, indicating support at this level. The price is currently in a slight consolidation phase after a dip and a recovery, trading near the **EMA(25)** 2. **Moving Averages**: - **EMA(7) (Yellow Line):** $2,660 — Tracks short-term trends and reflects that the price is marginally above it, suggesting weak bullish momentum. - **EMA(25) (Pink Line):** $2,647 — The price is slightly above this level, indicating medium-term support. - **EMA(99) (Purple Line):** $2,456 — Acts as a long-term support level. The price remains significantly above it, implying an overall bullish trend in the long run. **Analysis:** The alignment of the EMAs (7 > 25 > 99) suggests the trend is generally bullish, though recent price action shows a weakening momentum. ### 3. **Volume Analysis:** - Recent trading volume spikes suggest increased market activity, possibly linked to news or major moves. - **Volume is higher during sell-offs**, hinting at bearish pressure during corrections. ### 4. **Relative Strength Index (RSI):** - **RSI(6):** 55 — This value is near the midpoint, indicating neutral momentum. Neither overbought nor oversold conditions are present, which supports the consolidation thesis. ### 5. **Support and Resistance Levels:** - **Support Levels:** - $2,647 (EMA 25 and recent price cluster). - $2,456 (EMA 99 and historical support zone). - **Resistance Levels**: - $2,786 (Recent high). - $2,802 (Major psychological level and prior resistance). 6. **Trend Outlook**: - The upward trend since September 21, 2024, has seen a correction around November 5, 2024, with recovery towards the current level. - Price action near $2,674 is forming a potential higher low if bullish momentum persists. 7. **Market Sentiment:** - **Short-Term Sentiment:** Mildly bullish as price trades above the EMA(7). - **Medium-Term** Sentiment:*Consolidation; watch for breakout signals near $2,786 or breakdown below $2,647. - **Long-Term Sentiment**: Bullish trend intact, given price remains above the EMA(99). --- **Possible Strategies:** 1. **For Buyers**: - Enter near the support zone ($2,647) with a target of $2,786. - Place stop-loss below $2,647 to minimize risk. 2. **For Sellers**: - Watch for rejection near $2,786 to enter short positions with a target of $2,647 or $2,456. 3. **Neutral Approach**: - Await a clear breakout above $2,786 for confirmation of bullish continuation. - Monitor for breakdown below $2,647 for potential bearish movement.
No comments yet