 @hooiyewlim
more from that month
@hooiyewlim
more from that month
Is the BTC rally Sustainable or Due for a Pullback?
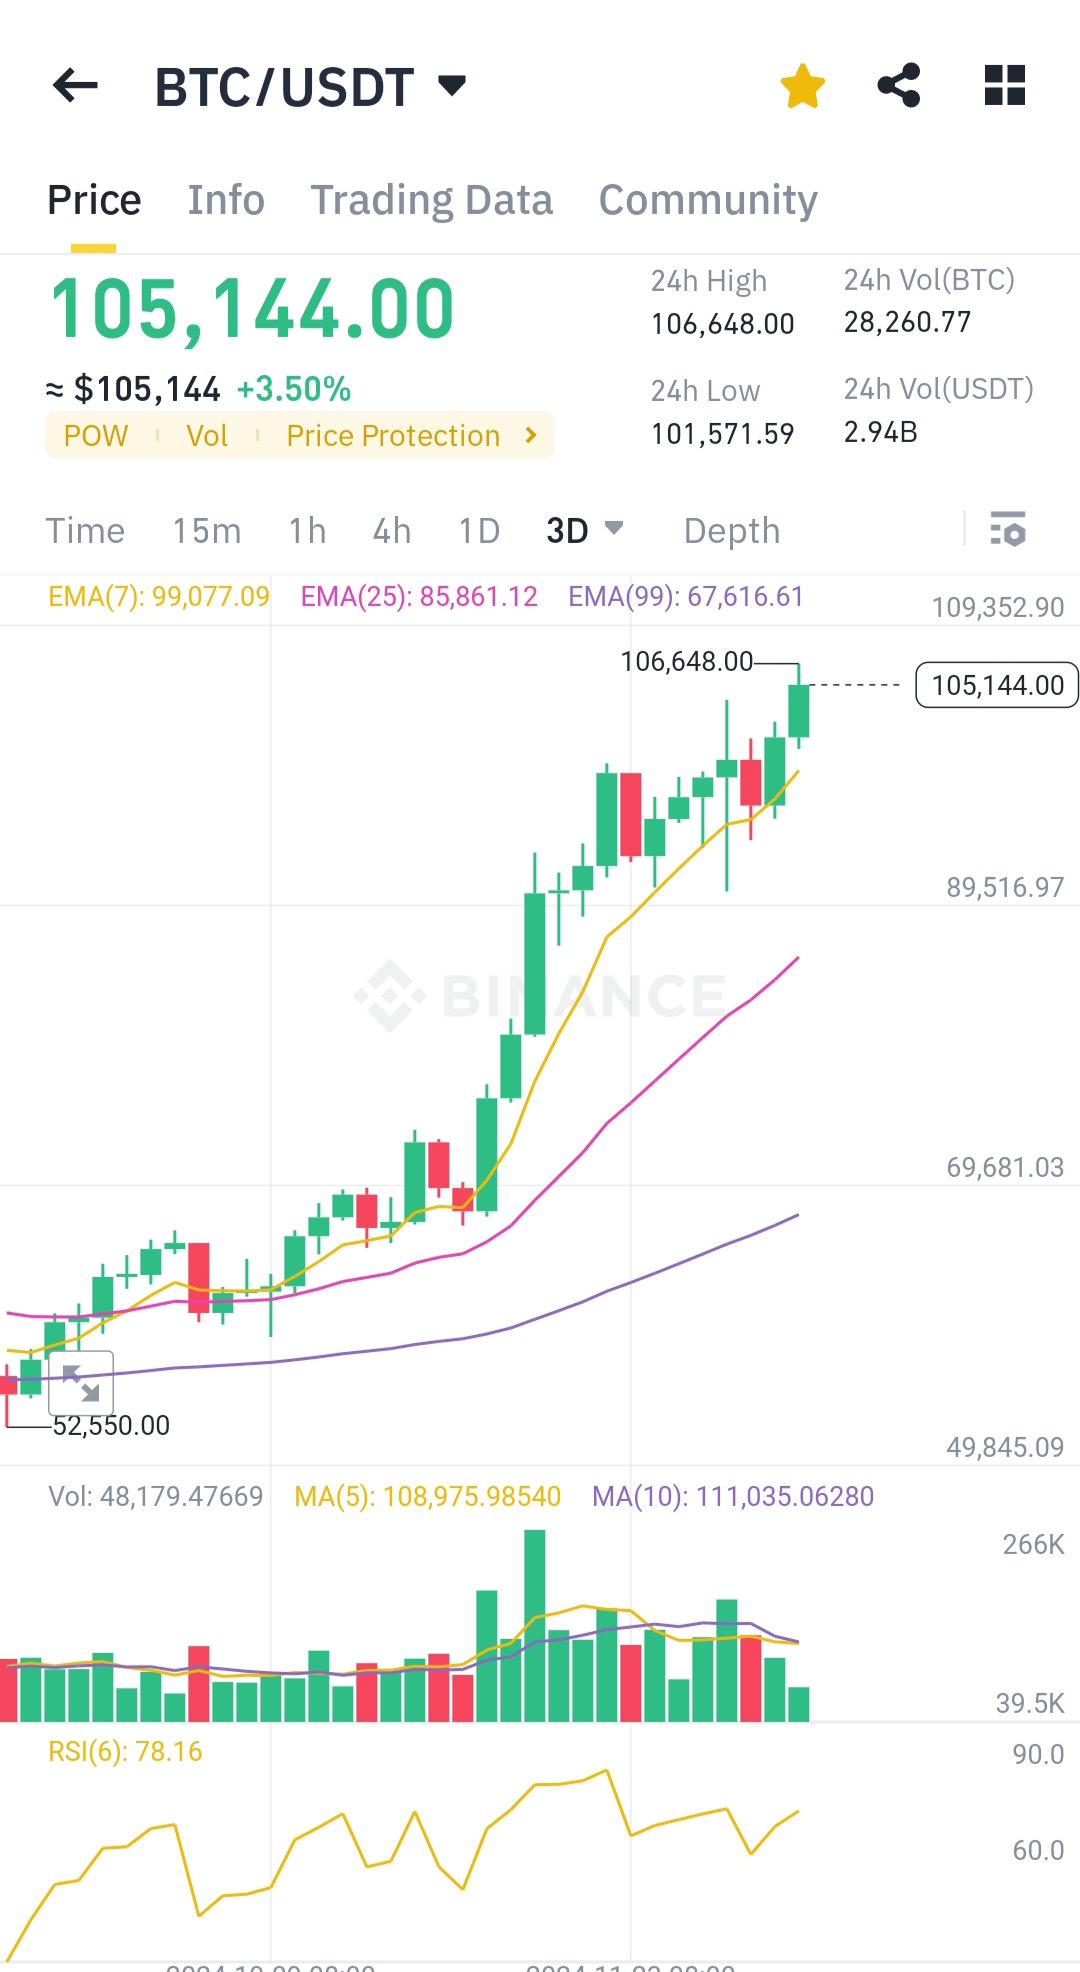
Today is a crazy day, we see Bitcoin reach a new all-time high. Some say $140,000 is possible by Christmas. **Let's take a look at what the chart says.** **Technical Analysis of Bitcoin (BTC/USDT) Based on the Chart** **Price Movement:** **Current Price**: $105,144.00 **24h High**: $106,648.00, indicating strong upward momentum. **24h Low**: $101,571.59 shows intraday support. **Trend Overview:** The price is in a **strong uptrend**, consistently forming higher highs and higher lows. Candles are trading above key moving averages, confirming bullish momentum. **Exponential Moving Averages (EMA):** **EMA (7)**: $99,077.09 (short-term trend is bullish). **EMA (25)**: $85,861.12 (medium-term support). **EMA (99)**: $67,616.61 (long-term support). The widening gap between EMAs signals growing bullish strength. **Volume Analysis:** Volume shows an increase during bullish candles, indicating strong buying interest. Green bars dominate, suggesting buyers are in control. **RSI (6):** Current RSI: 78.16, which indicates the asset is **overbought**. Overbought conditions may result in a short-term pullback. **Moving Averages (MA):** **MA (5)**: $108,975.98 **MA (10)**: $111,035.06 Price is below short-term MAs, suggesting potential near-term resistance. **Conclusion:** Bitcoin is in a strong uptrend, supported by bullish EMAs and volume. However, with RSI in the overbought zone, a short-term correction may occur before the next leg up. Watch for support near $101,500 and resistance around $106,650.
No comments yet