 @hooiyewlim
more from that month
@hooiyewlim
more from that month
BTC/USDT: Key Insights from Current Technical Analysis
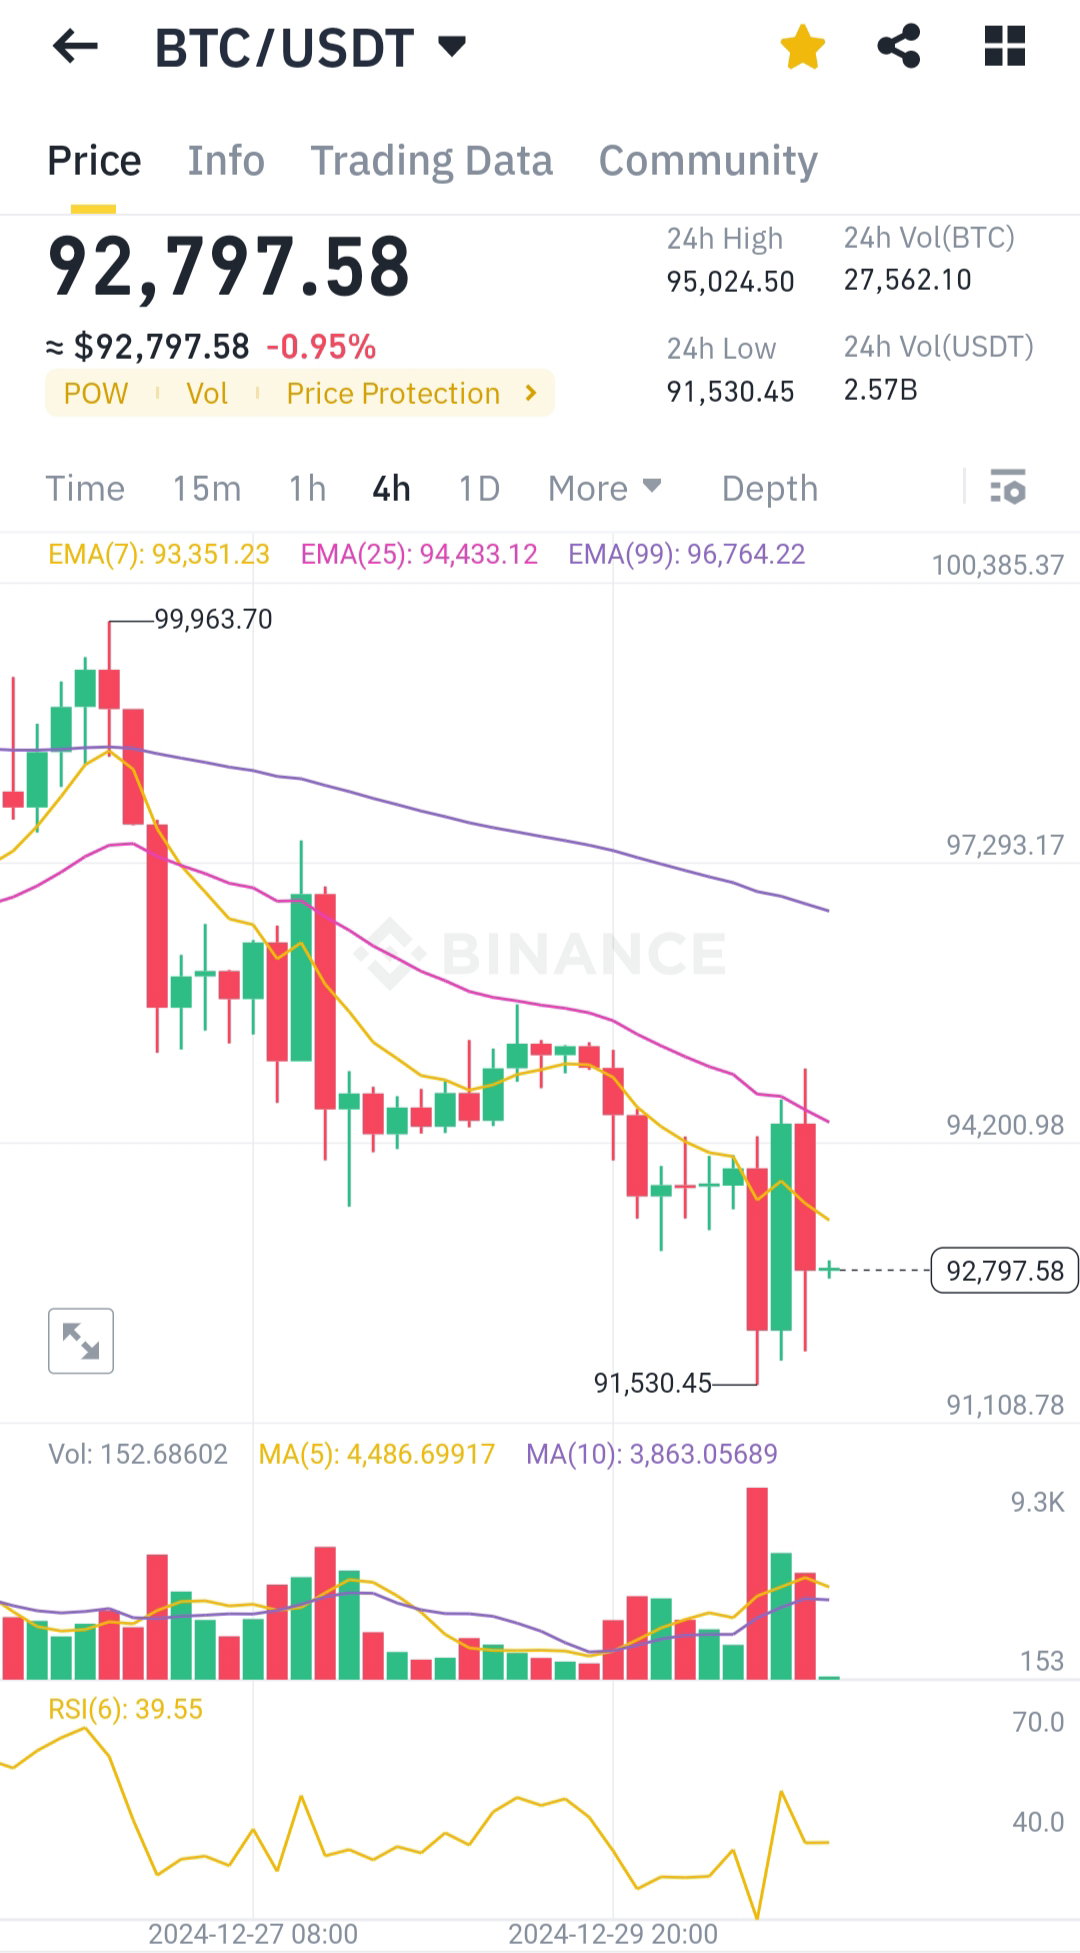
Yesterday BTC suddenly touch $91,300, will it go down further or maintain the price sideways? Let's see what the chart say. **Detailed Technical Analysis:** **Current Price Trend:** Bitcoin is trading at $92,797.58, showing a slight decline of 0.95%. The price is moving below the EMA (7, 25, 99), indicating bearish momentum in the short-to-medium term. **Support and Resistance Levels:** Support: $91,530.45 (recent low), followed by $91,108.78. Resistance: $94,200.98 (near EMA 25) and $96,764.22 (EMA 99). **Moving Averages:** The MA(5) at $4,486.70 and MA(10) at $3,863.06 are descending, reflecting bearish sentiment. The price remains below these averages, reinforcing downward pressure. **Volume Analysis:** The recent candlestick shows a surge in volume, indicating strong selling activity. Lower volume during upward movements suggests weak buying momentum. **Relative Strength Index (RSI):** RSI at 39.55 suggests Bitcoin is approaching oversold territory but has not yet signaled a strong reversal. **Candlestick Patterns:** Recent candles display long wicks and bearish pressure, highlighting market indecision with a downward bias. **Conclusion:** Bitcoin is in a bearish trend with weak upward momentum. Key support lies around $91,500, and resistance is at $94,200. Caution is advised as a retest of lower levels remains likely before any significant recovery.
No comments yet