 @hooiyewlim
more from that month
@hooiyewlim
more from that month
Bitcoin at Crossroads: Support Test or Breakdown?
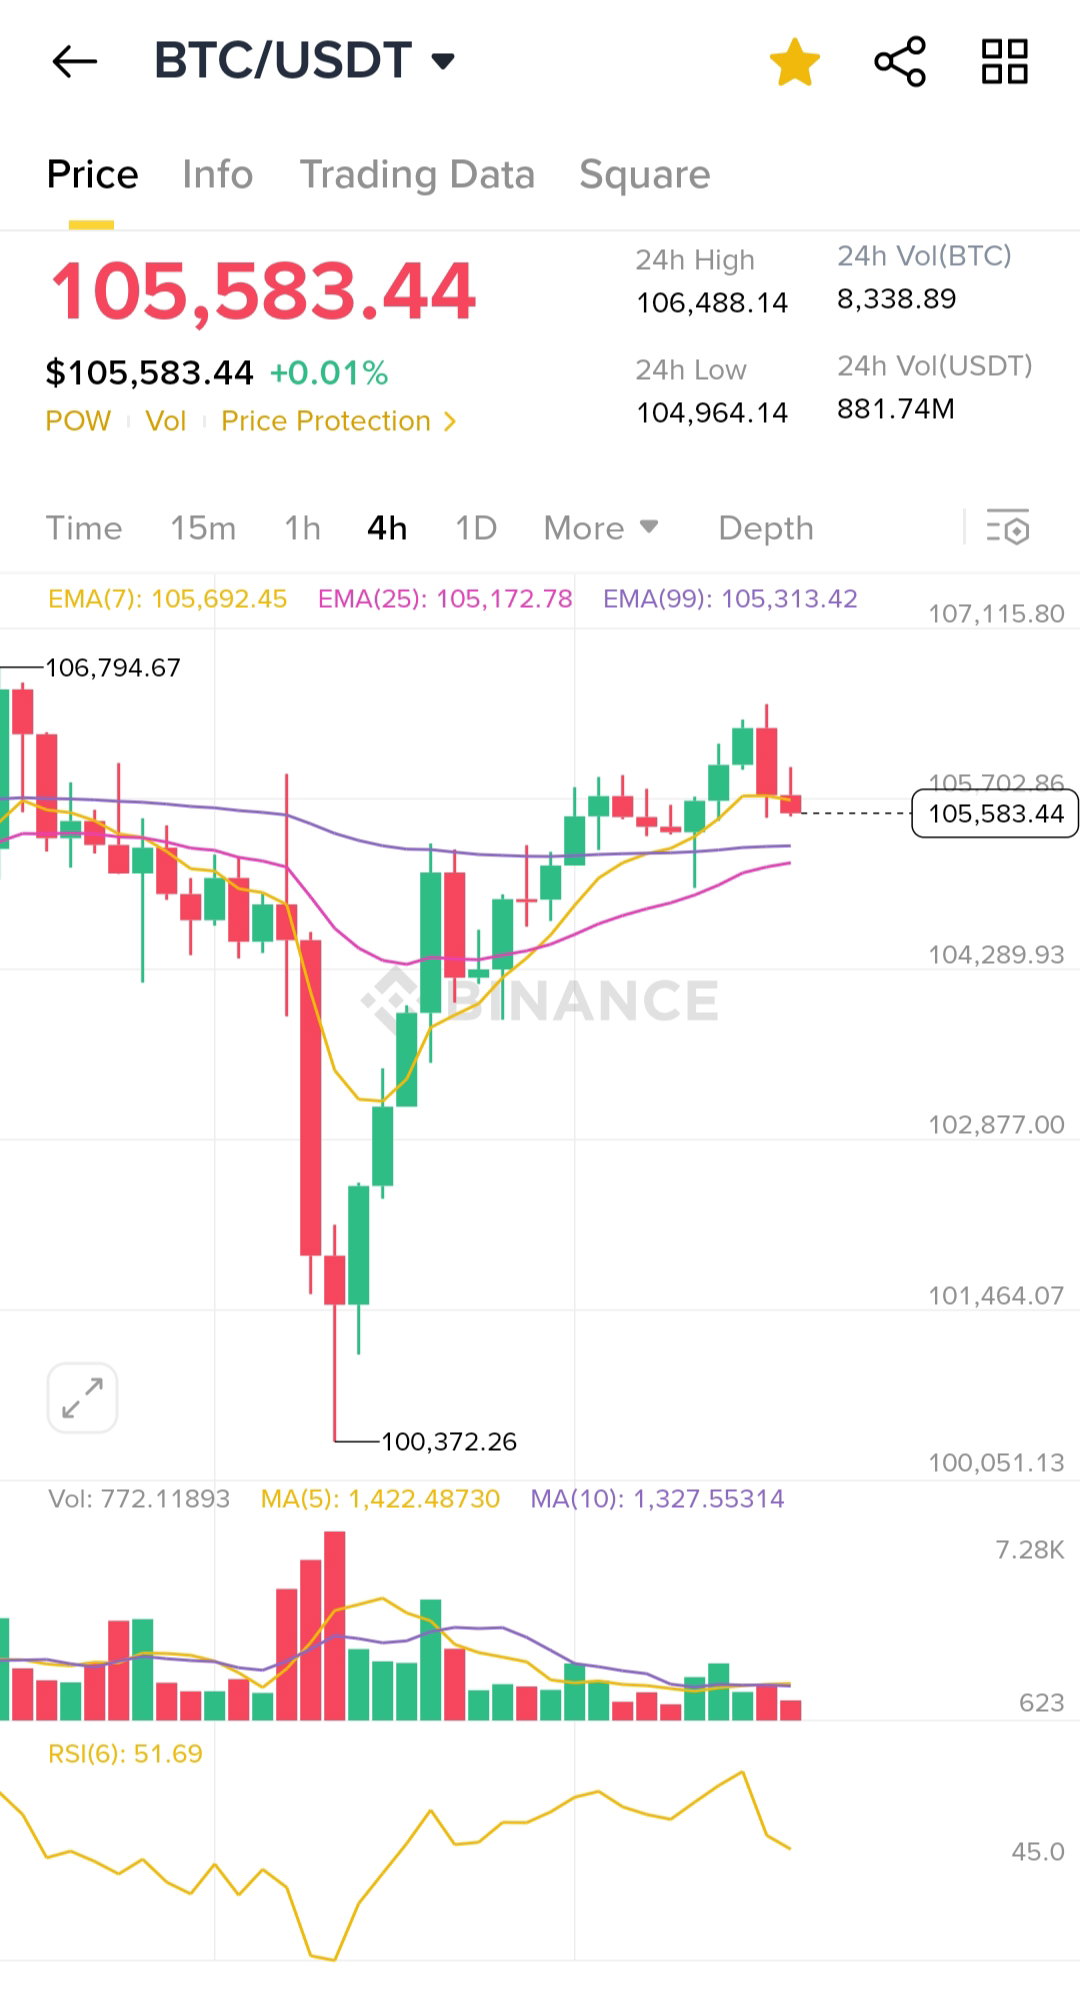
**Technical Analysis (4H Chart - BTC/USDT):** **Price Action:** Current price:**$105,583.44** Price recently rejected near the local high of**$106,794.67**. Now testing**EMA(7)**support (**~~$105,692.45~~**~~) and hovering just above~~**~~EMA(25)~~**~~(~~**$105,172.78**). **Support & Resistance:** **Resistance**: $106,794.67 (recent peak), followed by $107,115.80 (marked level). **Support**: $105,172.78 (EMA25), $104,289.93 (horizontal level), and strong psychological support at $100,000. **Moving Averages (EMA):** **EMA(7) > EMA(25) > EMA(99)**= short-term uptrend still intact. However, current price dipping below**EMA(7)**suggests early signs of short-term weakness. **Volume:** Decreasing volume on recent green candles implies**weakening bullish momentum**. No strong buy pressure at current levels. **RSI (Relative Strength Index):** RSI(6) at**51.69**= neutral zone, with a slight downward curve. No overbought/oversold signal; directionally pointing to mild bearish pressure. **MACD / Moving Averages (below chart):** **MA(5)**is crossing below**MA(10)**slightly = another sign of waning short-term bullish strength. **Conclusion:** Bitcoin is losing momentum near resistance and testing short-term EMAs. A bounce from $105k would keep the uptrend intact, but a break below $105k could open the path to $104k–$102k. **Watch for:**Price action around EMA(25) and volume pickup on the next move.
No comments yet