 @hooiyewlim
more from that month
@hooiyewlim
more from that month
Bitcoin on crossroads now
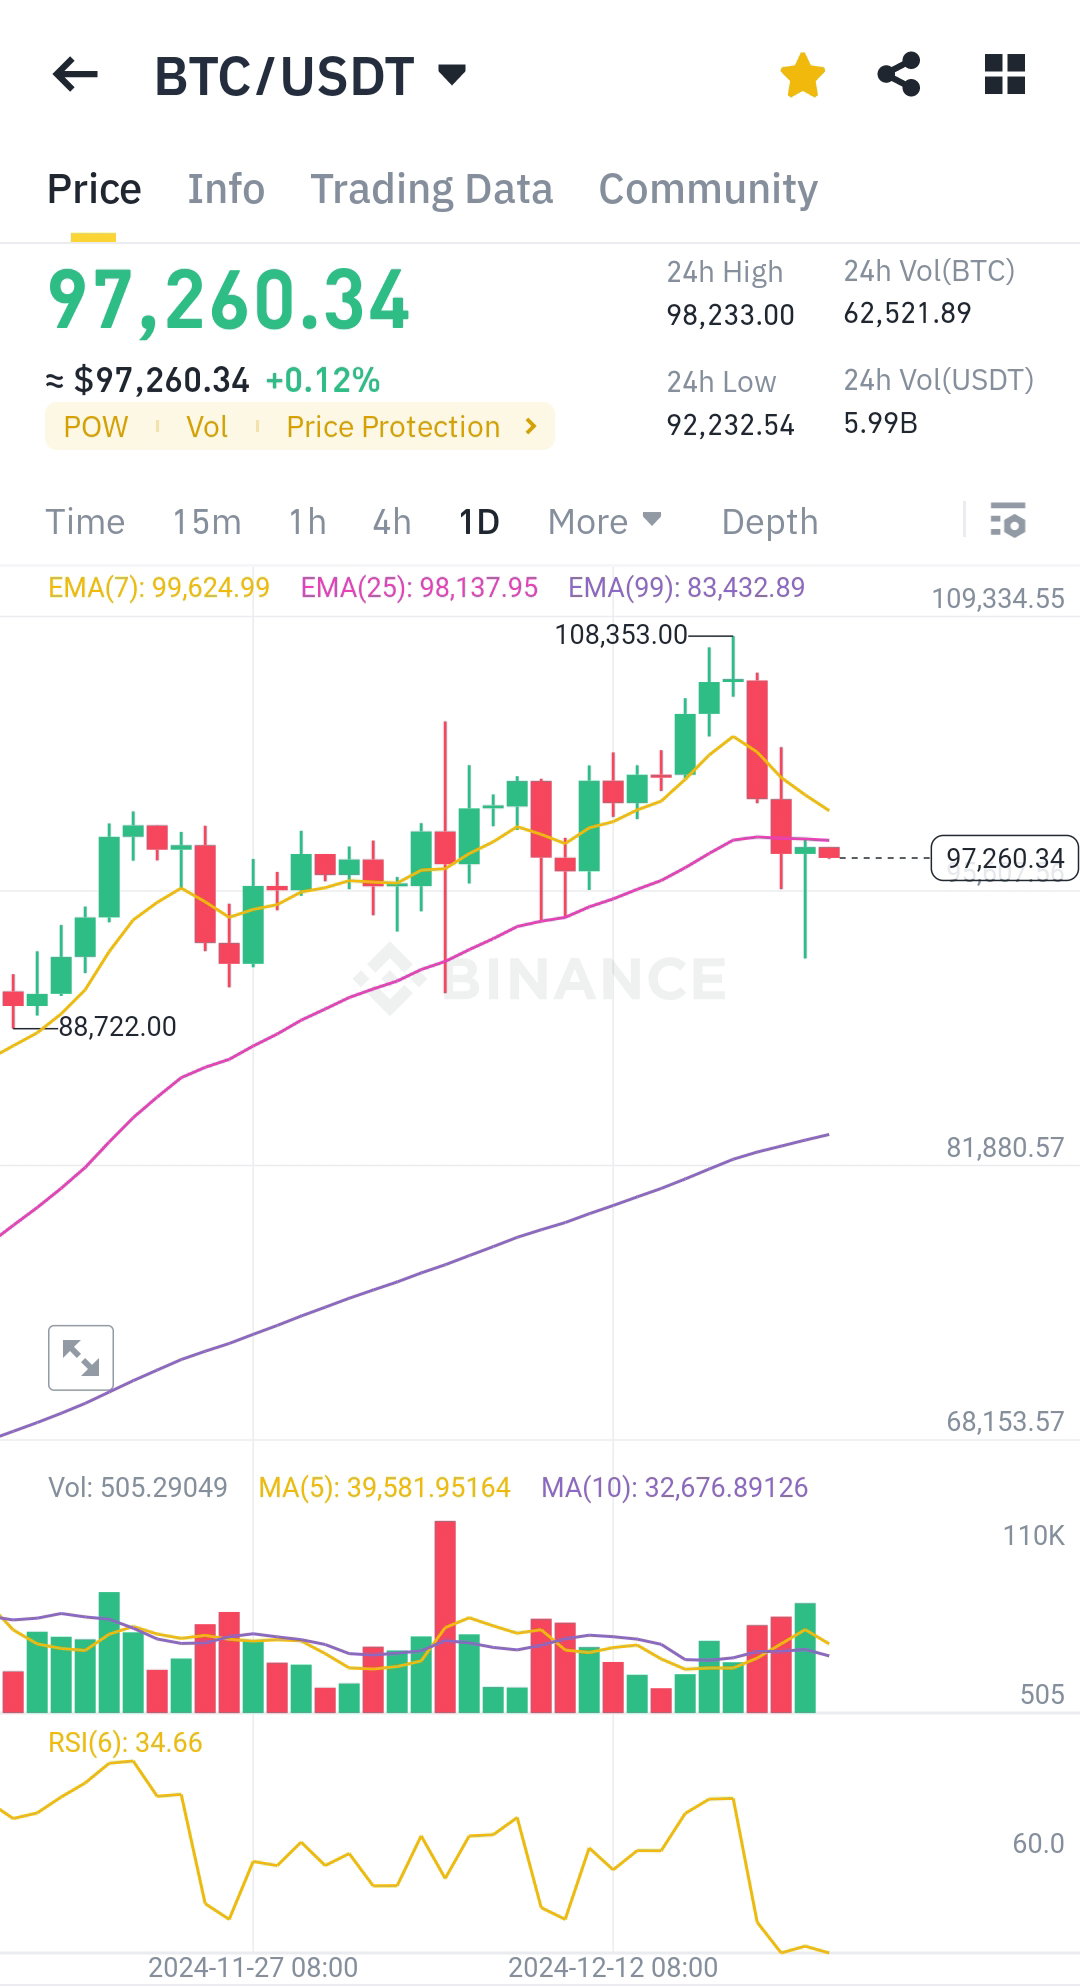
The Bitcoin dump finally stopped after it touched $93,000. Is it over already, or will we see a new dump when the US stock market opens? Don't forget that Christmas and Chinese new year are around the corner and normally result in large sell-offs. Let's see what the chart says. **1. Price Action Overview:** Current Price: $97,260.34 24H High: $98,233.00 24H Low: $92,232.54 BTC/USDT is showing a slight increase of +0.12%, indicating a period of consolidation after recent volatility. **2. Moving Averages:** EMA(7): $99,624.99 EMA(25): $98,137.95 EMA(99): $83,432.89 The price is currently below the EMA(7) and EMA(25), suggesting short-term bearish pressure. However, the EMA(99) remains far below the current price, reflecting a strong long-term uptrend. **3. Support and Resistance Levels:** Resistance: $99,625 (aligned with EMA(7)) Immediate Support: $92,232 (24H low) Key Support: $88,722 (previous low shown on the chart) **4. RSI Analysis:** RSI(6): 34.66 The RSI is approaching the oversold territory (below 30). This indicates potential weakening of selling pressure, and a reversal might be expected if RSI dips further and then rebounds. **5. Volume Analysis:** Current Volume: 505.29K The volume histogram shows spikes in red bars (bearish volume), indicating strong selling momentum recently. A decline in bearish volume and an uptick in green (bullish) bars could signal recovery. **6. Trend Analysis:** BTC/USDT recently failed to sustain the $108,000 level and faced rejection. The formation of a large bearish candlestick indicates a strong sell-off. The subsequent small green candle reflects indecision in the market, suggesting traders are waiting for confirmation of the next move. **7. Short-Term Outlook:** If the price reclaims EMA(7) at $99,625, it could attempt to retest $108,000. Failing to hold $92,232 could lead to a drop toward the key support at $88,722. **8. Long-Term Outlook:** The EMA(99) reflects a strong long-term bullish trend, so unless the price breaks below $83,432 (EMA(99)), the long-term bullish structure remains intact. **Conclusion:** BTC/USDT is at a critical juncture, balancing between a short-term bearish pullback and long-term bullish strength. Watch for RSI signals and volume changes as key indicators of the next major price movement.
1 comment
How di you do all this? Do you think BCH will take the same trend also?