 @hooiyewlim
more from that month
@hooiyewlim
more from that month
BTC Technical Analysis on 3rd January 2025
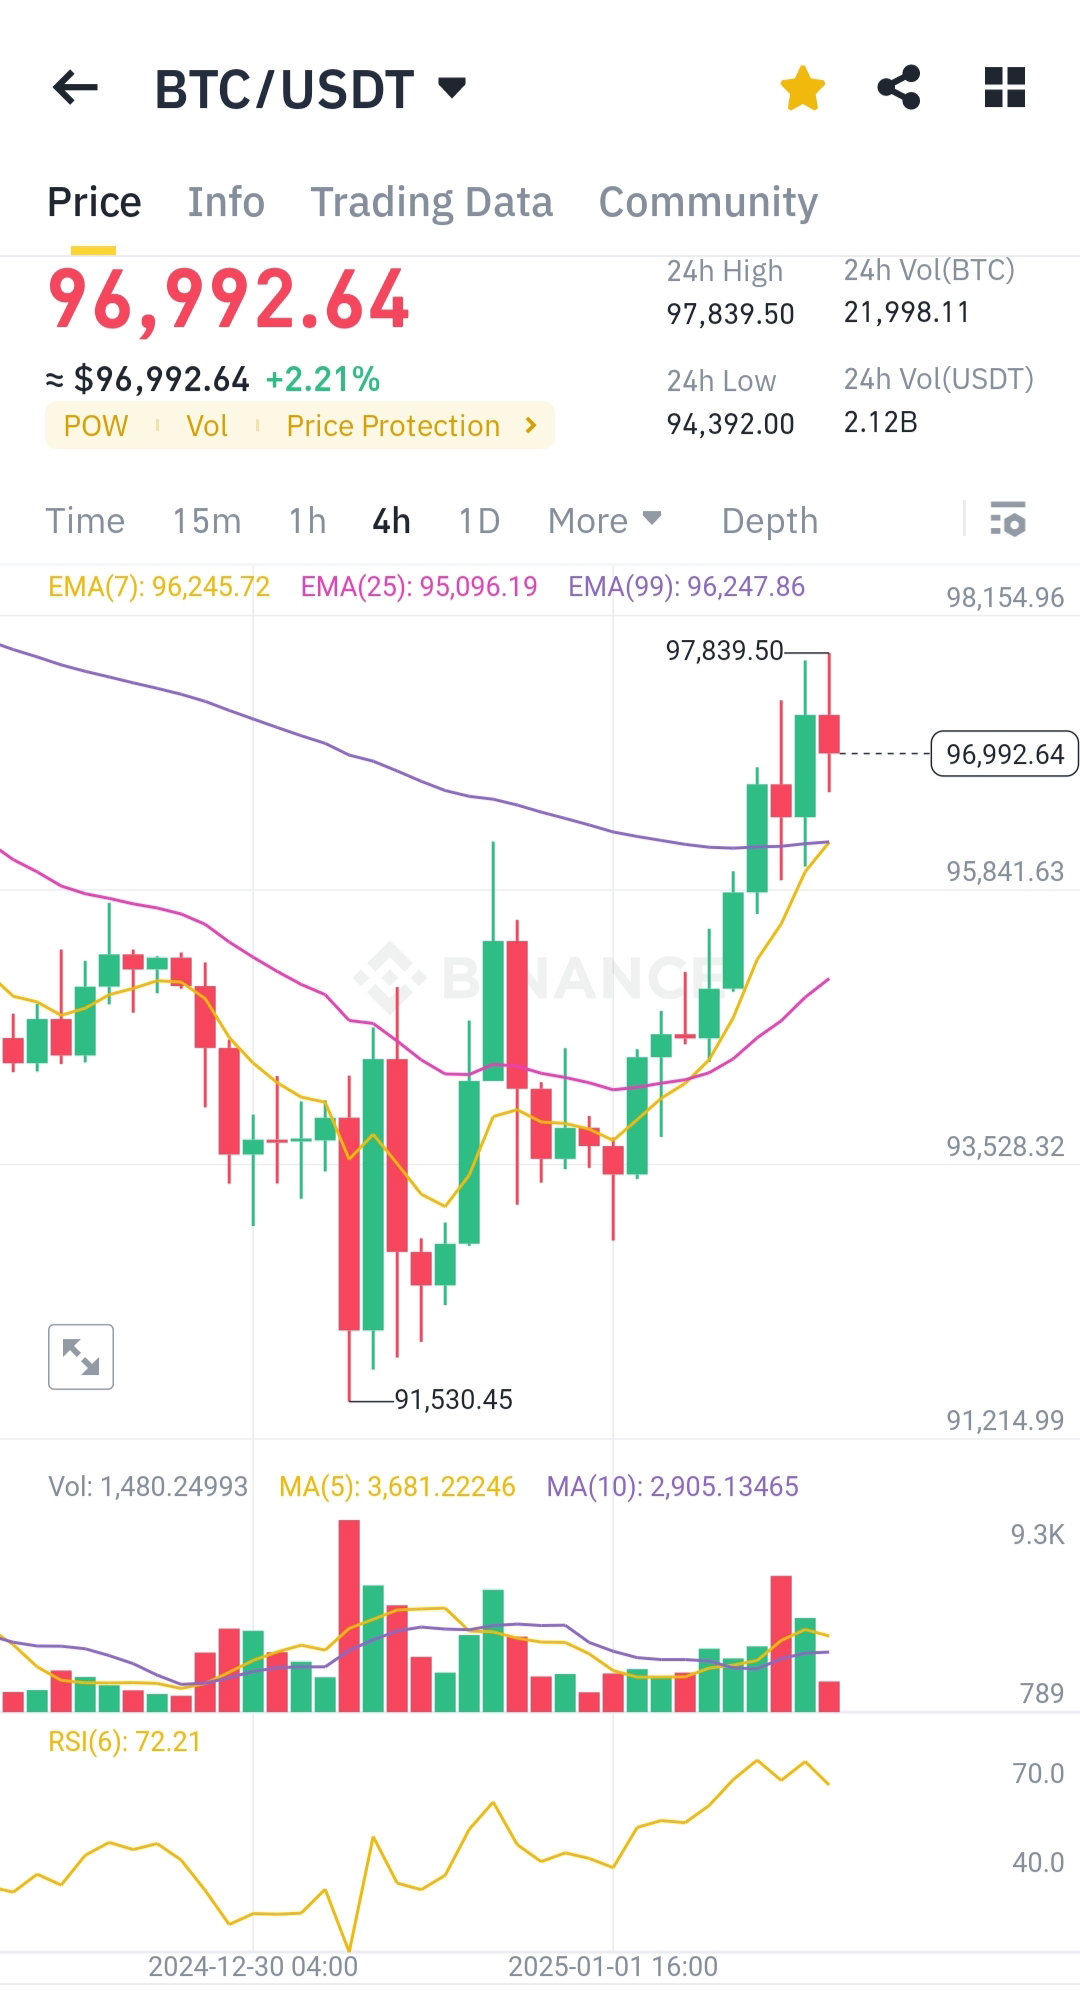
It is 3rd day into 2025 and BTC suddenly decided to pump. Let's see what the chart say. **Technical Analysis:** **Trend Overview:** Bitcoin (BTC) is showing bullish momentum on the 4-hour chart with the price at $96,992.64 (+2.21%). A recent upward move has taken the price near its 24-hour high of $97,839.50. **Moving Averages (MA & EMA):** EMA(7) at $96,245.72 and EMA(25) at $95,096.19 are bullishly aligned, suggesting a short-term upward trend. EMA(99) at $96,247.86 acts as a key support zone. MA(5) and MA(10) on the volume indicator show consistent bullish activity, but with a slight decrease in recent bars. **Volume:** High volume spikes suggest increased trading activity, supporting the upward movement. However, the declining volume may signal caution as momentum could weaken. **RSI:** The Relative Strength Index (RSI) stands at 72.21, indicating overbought conditions. This suggests a potential for a pullback or consolidation. **Candlestick Pattern:** The recent rejection at $97,839.50 forms a wick, indicating selling pressure near resistance levels. **Support and Resistance Levels:** Key support: $95,841.63 (near EMA lines). Key resistance: $97,839.50 (24-hour high). **Conclusion:** BTC shows strong bullish momentum but faces resistance near $97,839.50. Overbought RSI suggests a short-term correction may follow before further upward movement. Monitor support near $95,841.63.
1 comment
Amazing! I'd like to know more, where do you get these ideas from ? I'm learning