 @hooiyewlim
more from that month
@hooiyewlim
more from that month
Bitcoin’s Short-Term Consolidation: Is a Breakout Coming?
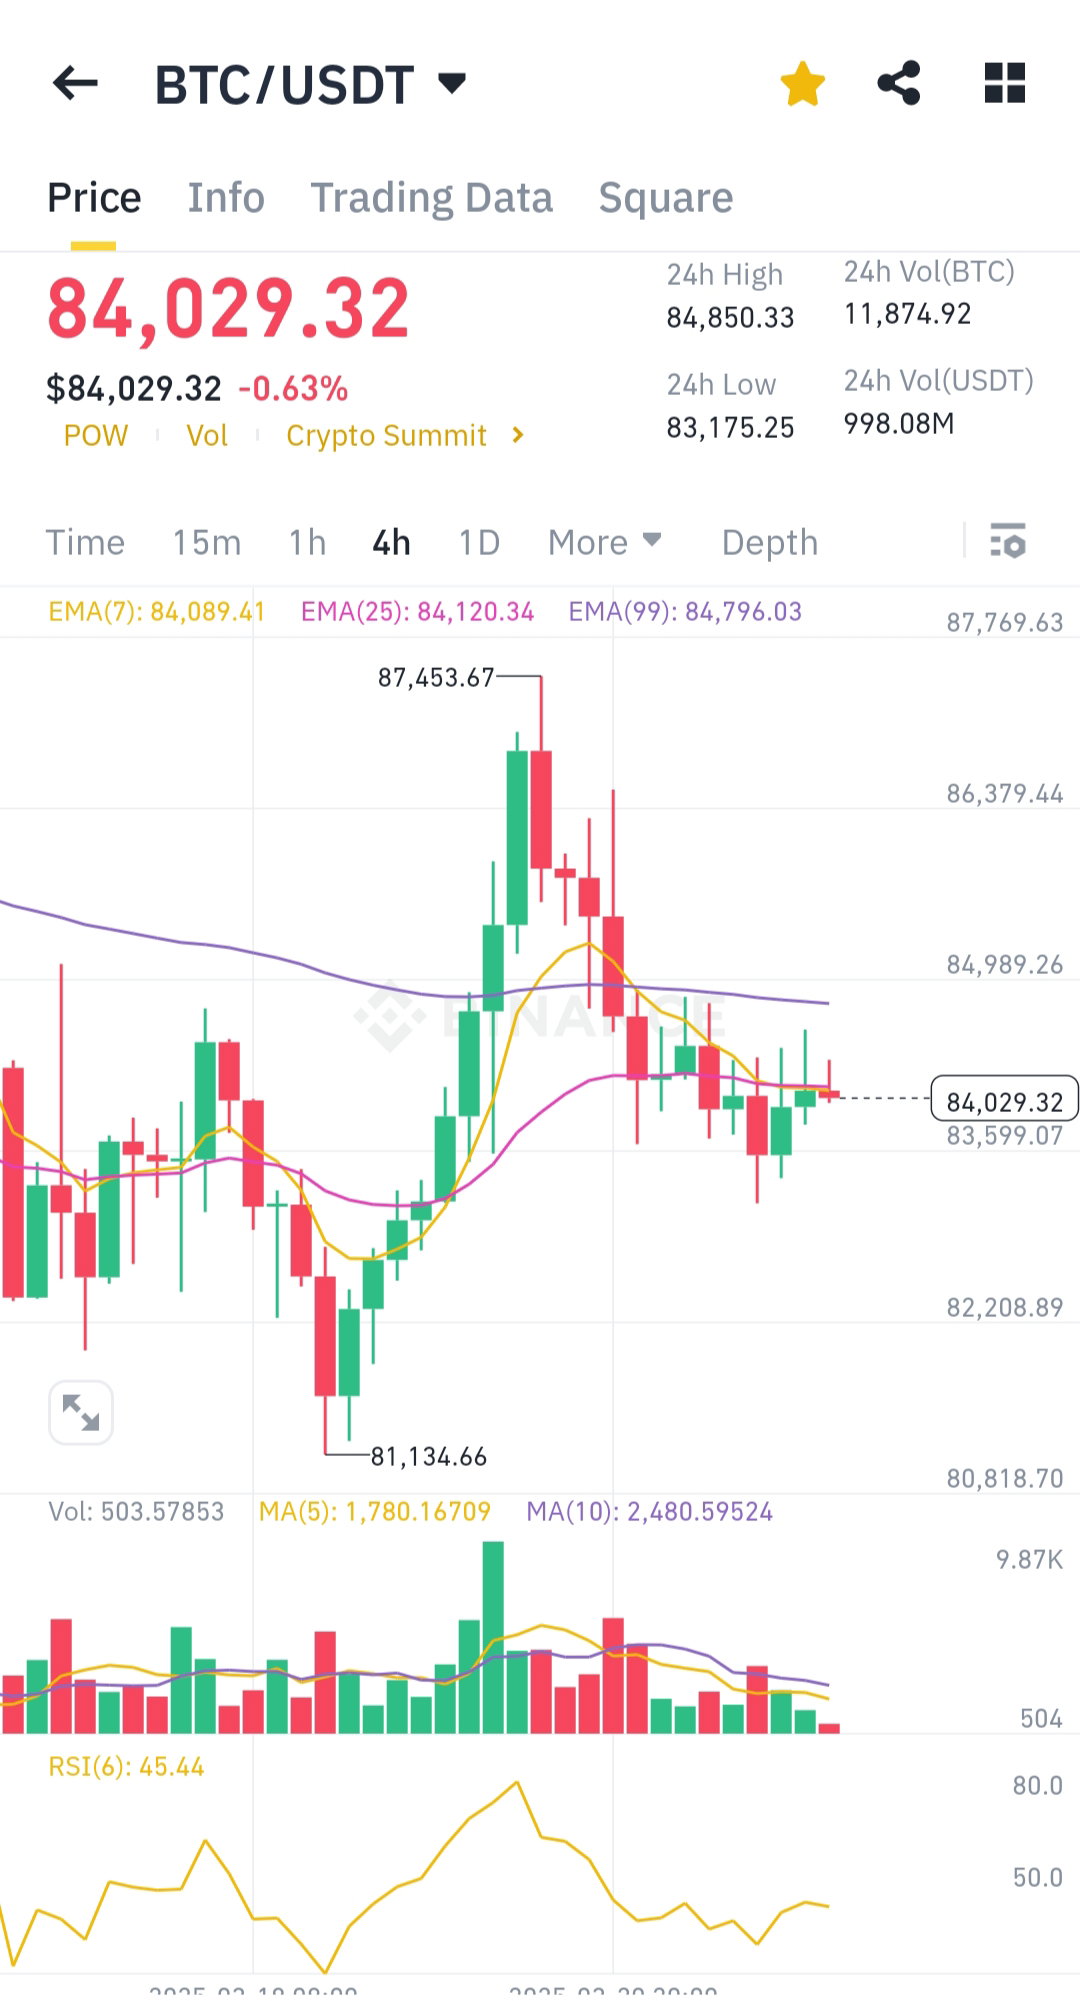
**Technical Analysis (4H Chart)** **Price Action & Trend:** Bitcoin is currently trading at **$84,029.32**, down **0.63%** in the last 4 hours. It previously reached a **high of $87,453.67** before pulling back to a **low of $81,134.66**. The price is moving sideways near the **84,000 level**, suggesting consolidation after a volatile move. **Moving Averages:** **EMA (7):** **$84,089.41** (short-term resistance). **EMA (25):** **$84,120.34** (acting as dynamic resistance). **EMA (99):** **$84,796.03** (long-term resistance). The price is trading **below the 99 EMA**, signaling **a short-term bearish bias**, but close to short-term EMAs, indicating possible sideways movement. **Support & Resistance Levels:** **Support:** **$83,599** and **$82,208** are the nearest support zones. A breakdown below these levels could see Bitcoin testing **$80,818**. **Resistance:** **$84,989** is the key resistance to break for an upward move toward **$86,379**. **Volume & RSI:** **Volume is decreasing**, indicating reduced buying/selling pressure. **RSI (6) is at 45.44**, signaling neutral to slightly oversold conditions. Bitcoin has room for an upward bounce if buying pressure increases. **Conclusion:** Bitcoin is currently **consolidating** after a strong move, with **support at $83,599 and resistance at $84,989**. If bulls reclaim the **EMA (99) at $84,796**, we could see an upward move. However, a breakdown below **$83,599** could trigger further downside toward **$82,208 or lower**. *Traders should watch for a breakout above resistance or a breakdown below support before taking a position.*
No comments yet