 @hooiyewlim
more from that month
@hooiyewlim
more from that month
Bitcoin Price Analysis: Year-End Pressure and Historical New Year Trends
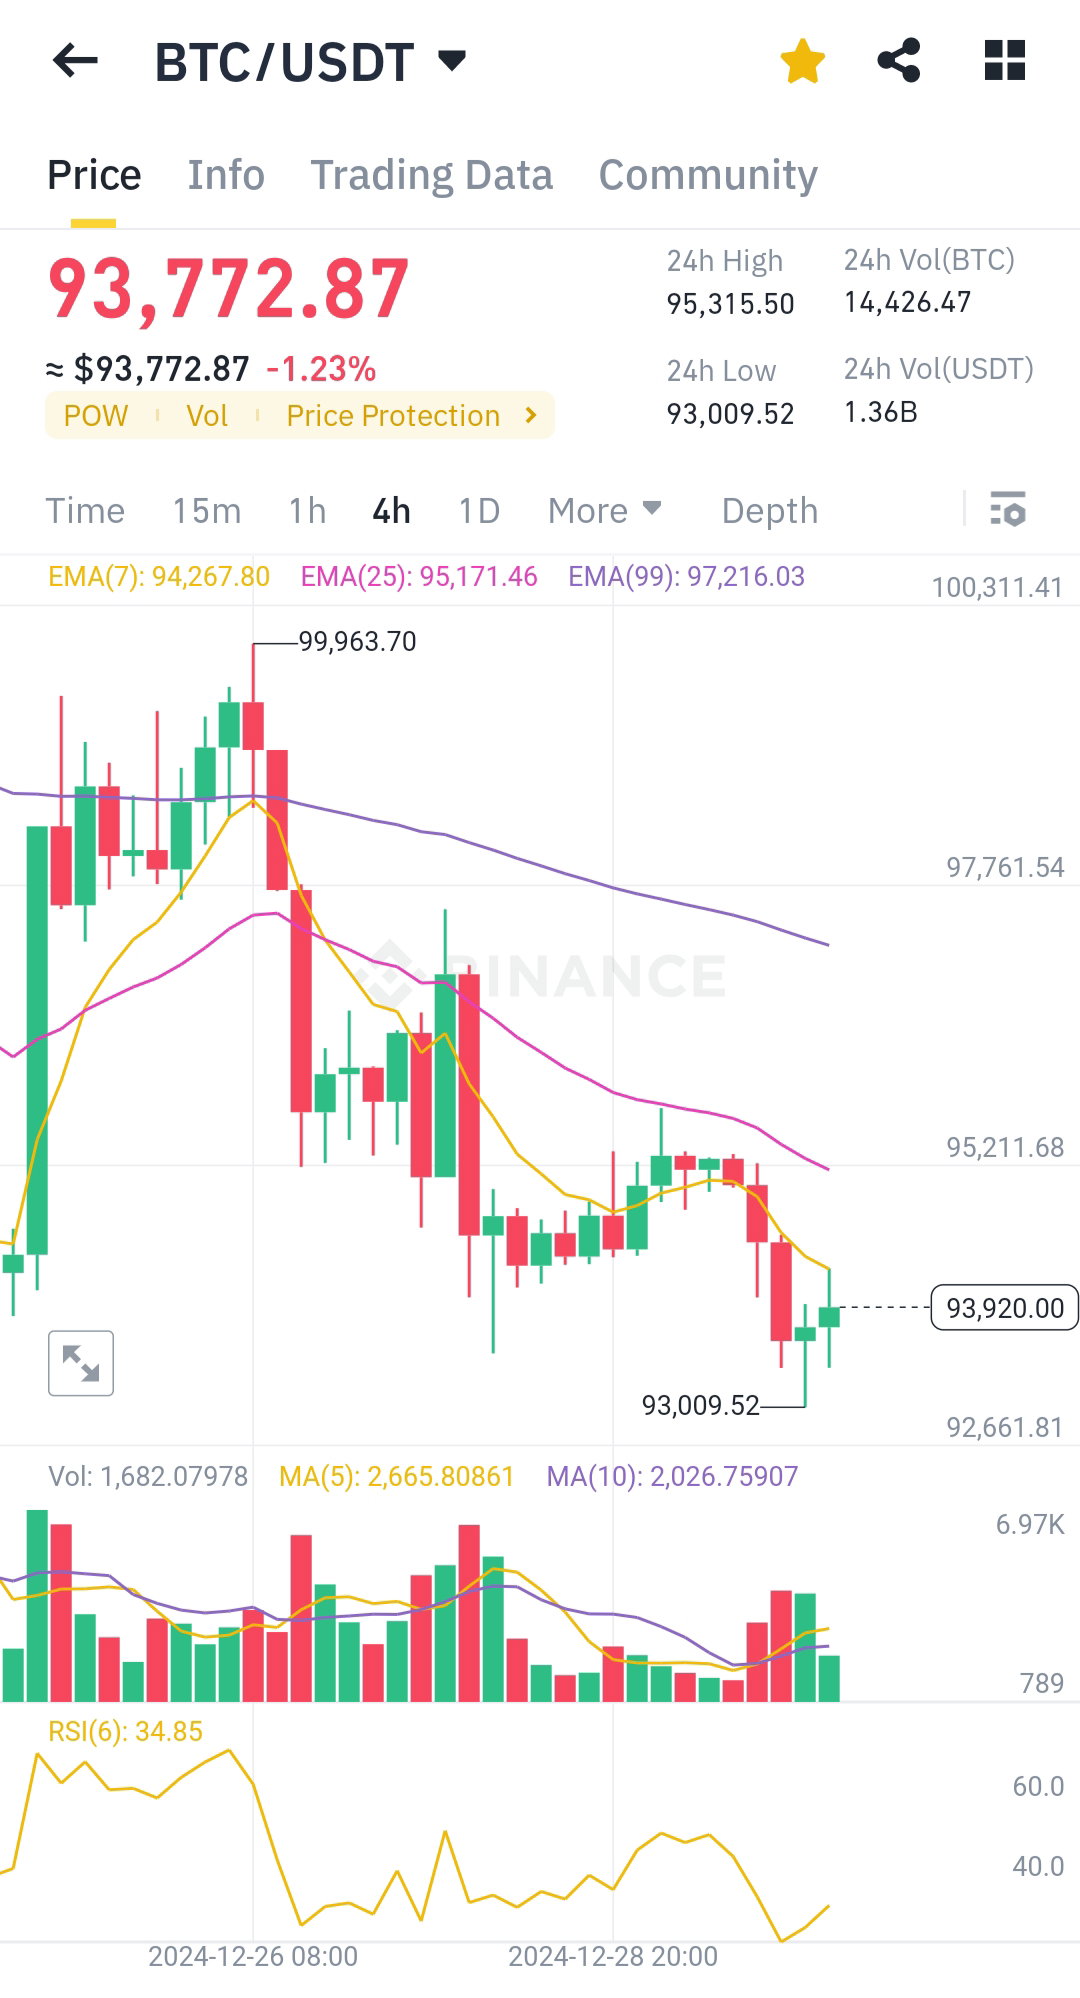
Last 24 hours we see BTC price drop a bit, let's see what the chart say. Is it the end of Christmas rally? **Detailed Technical Analysis:** **Price Overview:** Current BTC/USDT price: **$93,772.87** (-1.23%). 24H Range: **$93,009.52 - $95,315.50**. Price is trending below the **EMA(7), EMA(25), and EMA(99)**, indicating bearish momentum. **Moving Averages:** **EMA(7)**: $94,267.80 **EMA(25)**: $95,171.46 **EMA(99)**: $97,216.03 The short-term EMA(7) is under the longer-term EMAs, confirming a downtrend. **Volume Analysis:** Declining volume on recent price action suggests weakening buying power. **MA(5)** volume at **2,665.81** is above the MA(10) volume at **2,026.76**, hinting at sporadic volatility but insufficient momentum for a trend reversal. **RSI (Relative Strength Index):** RSI(6) at **34.85** is approaching oversold levels (<30), suggesting potential near-term buying interest or consolidation. **Candlestick Pattern (4H):** Formation of lower highs and lower lows indicates sustained bearish pressure. Weak rejection at $93,009.52 indicates the market is testing key support. **Historical Bitcoin Performance During New Year:** Historically, Bitcoin often sees **price volatility around the New Year** due to: **Profit-taking:** Traders closing positions before year-end. **Renewed demand:** Fresh capital inflow at the start of the year. While early January has historically been a mixed bag, Bitcoin tends to show stronger performance in Q1, fueled by optimism and new liquidity. **Conclusion:** Bitcoin is showing bearish signals on the 4H chart with support at $93,000 and resistance at $95,000. With RSI nearing oversold territory, consolidation or a potential bounce could occur. Historically, Bitcoin often experiences fresh momentum in the New Year, so the upcoming days may provide an opportunity for trend reversal. Stay cautious of volatility.
No comments yet