 @hooiyewlim
more from that month
@hooiyewlim
more from that month
Bitcoin's Surge to $101,787: What's Next?
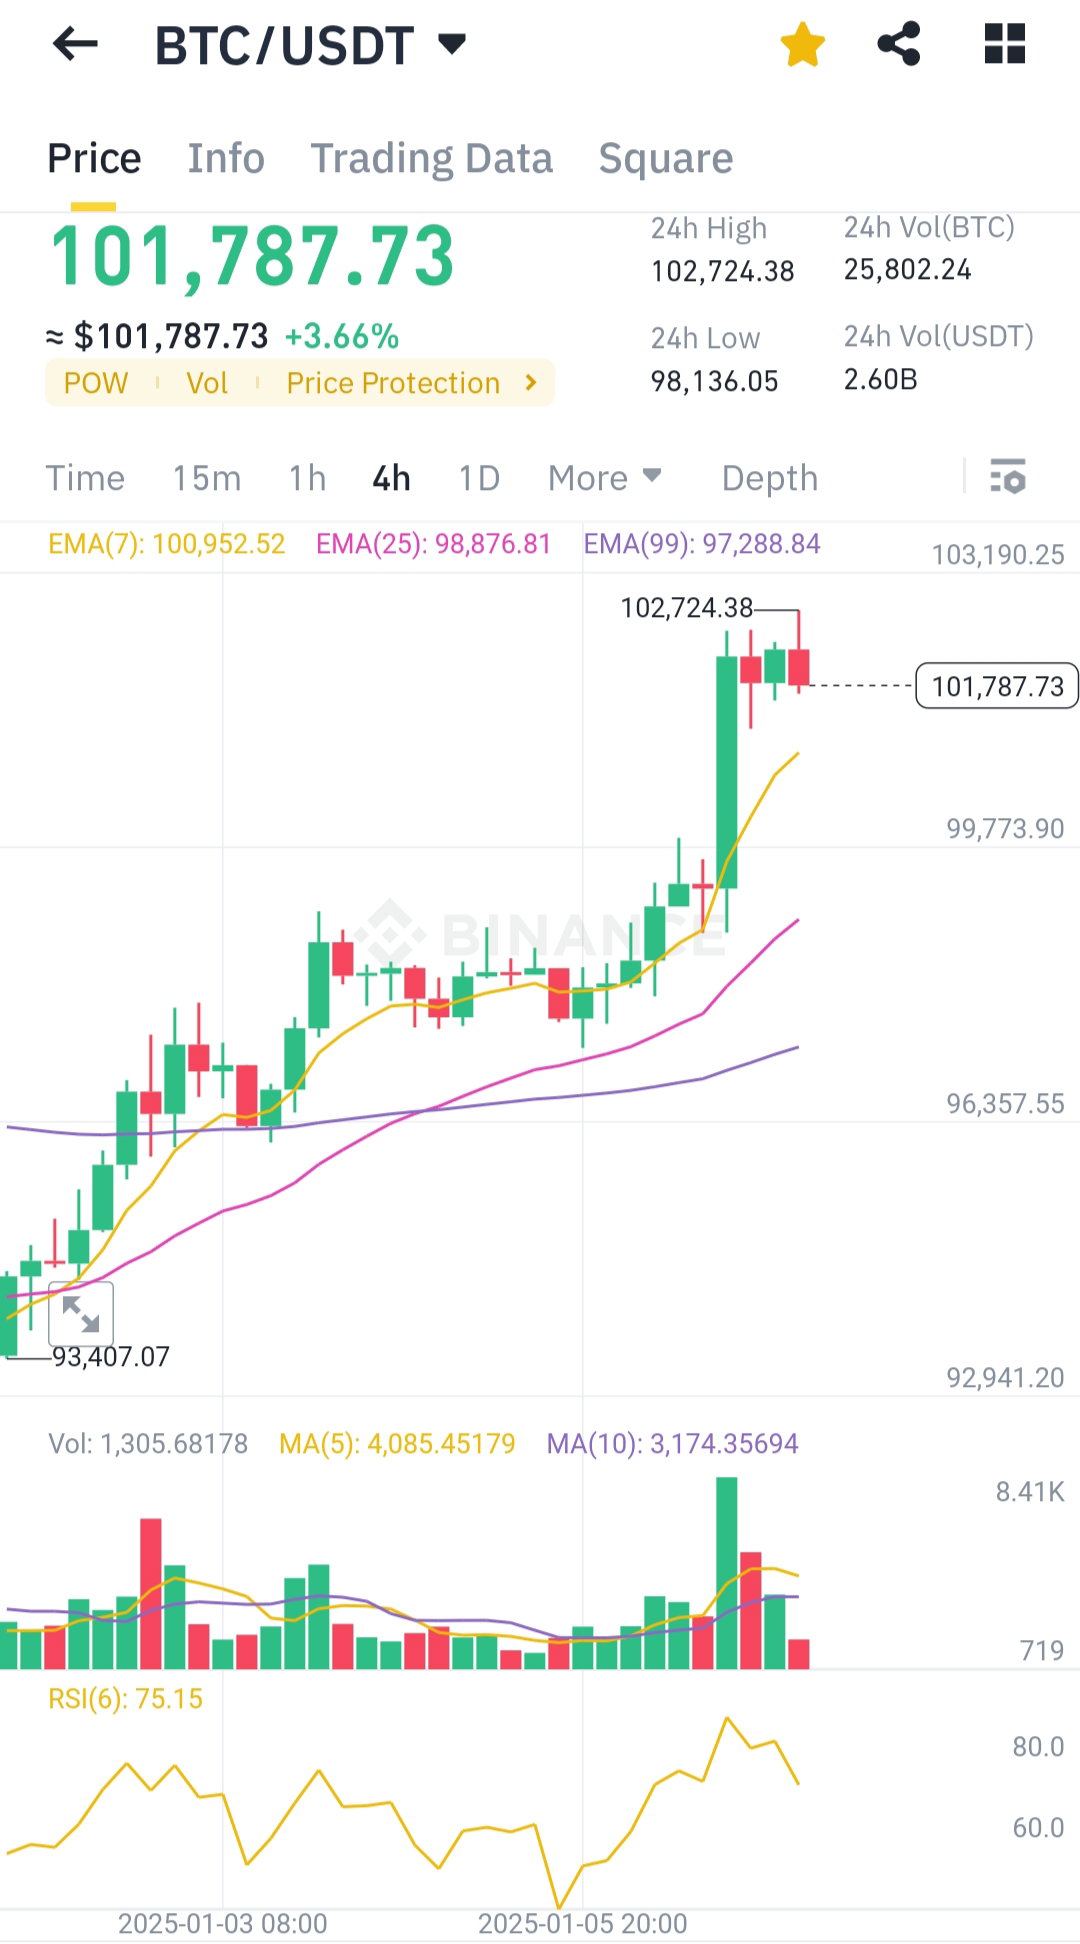
Last 24 hours we see Bitcoin back to $100,000 price range, now let's see what the chart tell us. **Technical Analysis of Bitcoin (BTC/USDT):** **Price Overview:** Current price: **$101,787.73** (+3.66% within 24 hours). High: **$102,724.38**, Low: **$98,136.05** (24-hour range). Volume (USDT): **$2.6 billion**, indicating significant trading activity. **Trend Indicators:** Exponential Moving Averages (EMA): EMA(7): **$100,952.52** (short-term support). EMA(25): **$98,876.81**. EMA(99): **$97,288.84** (long-term support). The price is trading well above all major EMAs, confirming a **strong uptrend**. **Volume Analysis:** Recent candles show a **volume surge**, reflecting strong buyer momentum. Decreasing volume in the last two candles indicates potential **buyer exhaustion**. **Relative Strength Index (RSI):** RSI(6): **75.15**, suggesting Bitcoin is currently in an **overbought zone**. Overbought conditions could lead to a potential short-term correction. **Candlestick Pattern:** The chart reflects a **bullish momentum**, with a notable breakout above $100,000. However, the current red candle indicates a slight pullback. **Support and Resistance:** Immediate support: **$100,952** (EMA 7). Major support: **$97,288** (EMA 99). Immediate resistance: **$102,724**, the 24-hour high. **Conclusion:** Bitcoin is experiencing a strong bullish momentum with prices above $101,000. However, the RSI indicates overbought conditions, and a short-term pullback might occur before further upward movement. Traders should watch for a breakout above $102,724 for confirmation of continued rallying or a breakdown below $100,952 for potential retracement. However we mustn't forget that President Trump inauguration and Chinese new year is around the corner that can give us a huge price swing.
No comments yet