 @hooiyewlim
more from that month
@hooiyewlim
more from that month
Hive take a heavy beating today
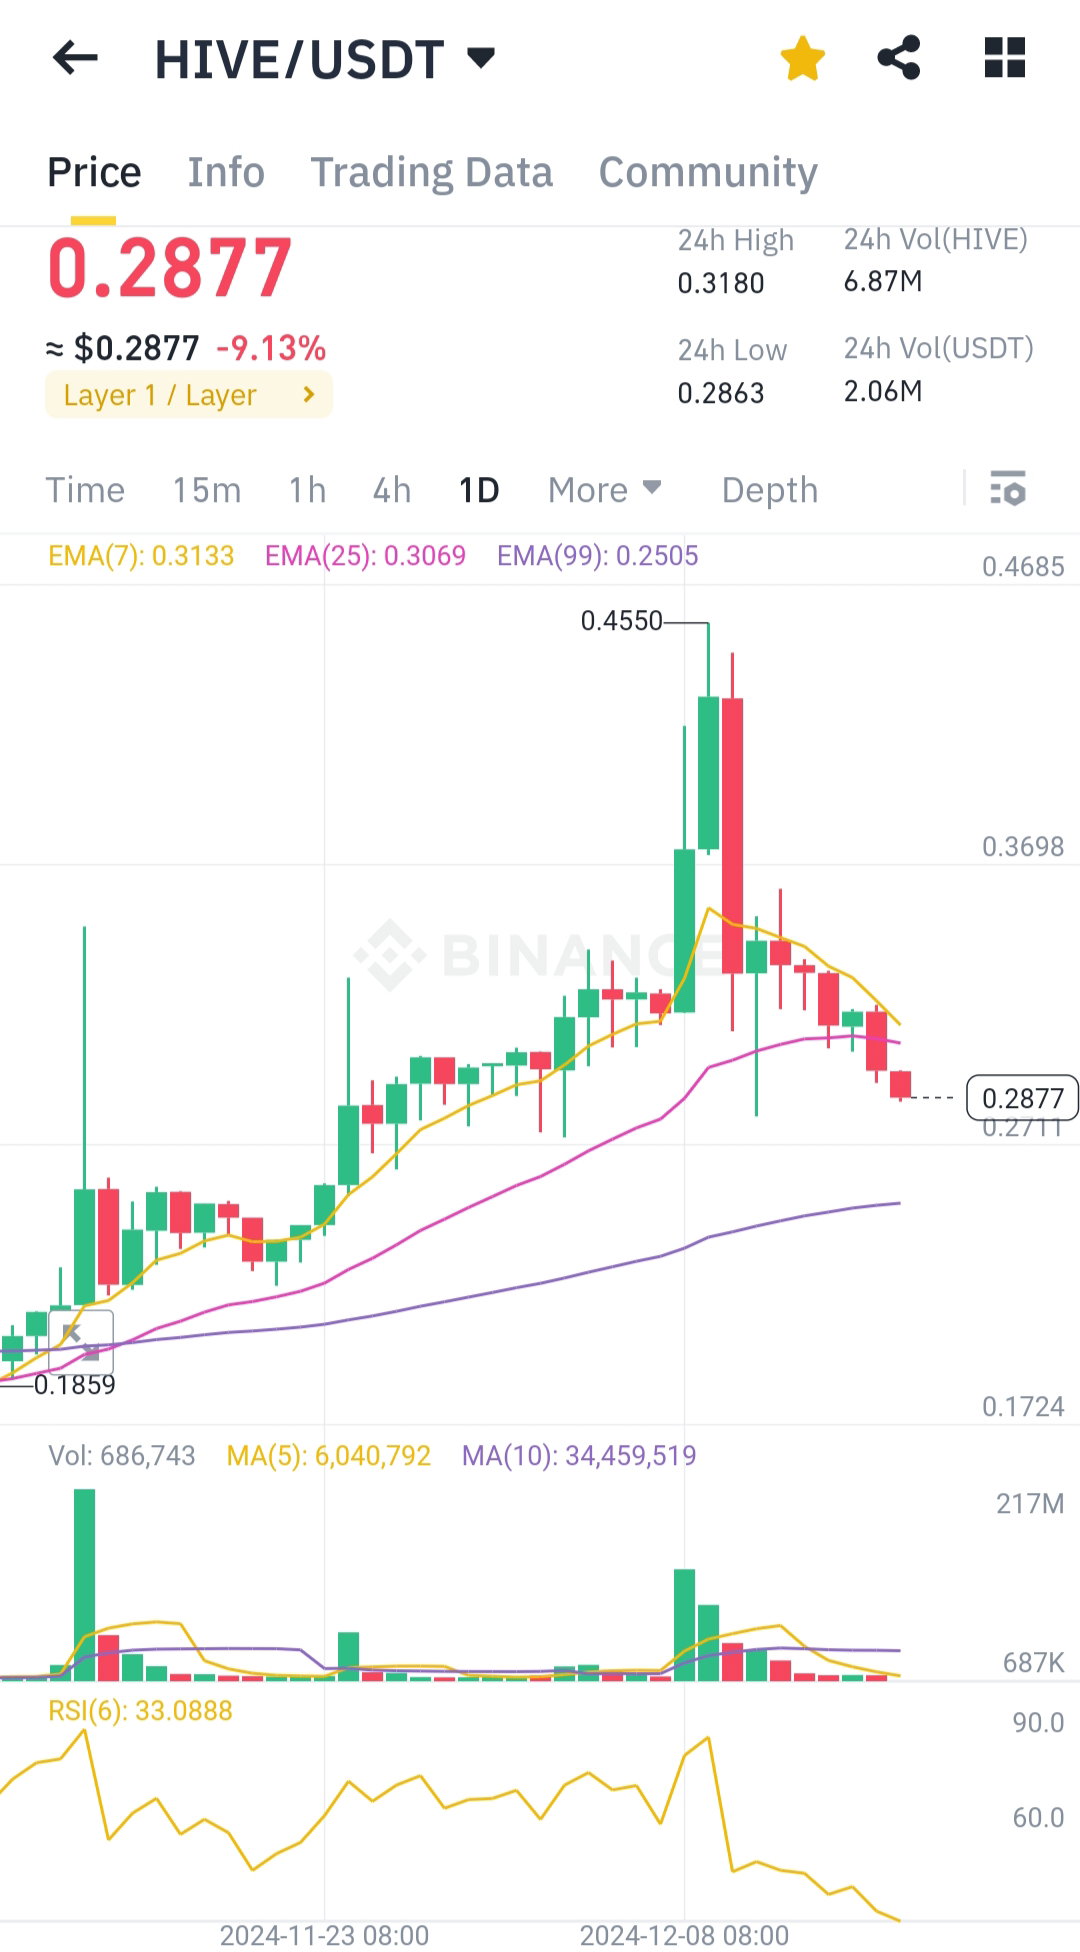
Look like today hive taking a heavy beating. Let's see what the chart say. **Technical Analysis of HIVE/USDT** **Current Price & Recent Movement**: Price is **$0.2877**, down **9.13%** in the last 24 hours. The current price is close to the **24h low of $0.2863** and far from the recent high of **$0.3180**. This suggests bearish momentum as the price nears its daily support. **Exponential Moving Averages (EMA)**: **EMA(7): $0.3133** (Yellow) → Price is below the 7-day EMA, indicating short-term bearishness. **EMA(25): $0.3069** (Pink) → Price is also below the 25-day EMA, signaling mid-term weakness. **EMA(99): $0.2505** (Purple) → Price is still above the 99-day EMA, suggesting a possible long-term support level around $0.25. **Volume**: Trading volume has dropped significantly after the previous spike. The large green volume bar during the upward move near **$0.4550** indicates heavy buying, followed by selling pressure causing the decline. **RSI (Relative Strength Index)**: The RSI is **33.08**, which is close to the oversold region (<30). This implies that sellers dominate, but the asset may be approaching oversold conditions, potentially leading to a reversal. **Support and Resistance Levels**: **Immediate Support**: Around **$0.2711** (previous low). **Major Support**: Near **$0.2500** (close to the EMA(99)). **Resistance Levels**: **$0.3133** (EMA(7)) and **$0.3069** (EMA(25)) act as near-term resistance. **Conclusion:** HIVE/USDT is currently in a **short-term bearish trend**. Price is below key EMAs, and RSI shows sellers dominate but oversold conditions are close. Watch for a reversal near $0.27-$0.25 support levels or further confirmation of the downtrend if volume increases. Sound like time to buy some hive since it is in oversold condition.
No comments yet