65 Percent of Pre-Fork BCH Has Been Spent
On August 1, 2017, the Bitcoin Cash (BCH) hard fork occurred, raising the permitted bitcoin block size above 1MB and creating a separate history of transactions from that point forward. At the moment of the hard fork, all self-custody owners of BTC were endowed with an equal amount of BCH that they could spend with their private cryptographic keys. Owners of BTC on exchanges were at the mercy of the exchanges' decisions to allow trading or withdraw of BCH.
Owners of pre-fork BTC could choose to spend only their pre-fork BTC, only their pre-fork BCH, spend both, or do nothing at all. When I use "spend" in this post I mean transact with the coins on the blockchain. Coin owners could be sending to themselves, spending it on a good or service, sending it to an exchange to withdraw, or performing "wallet maintenance" if the owner is an exchange. Therefore, the blockchain data cannot tell us definitively whether certain pre-fork coins have changed ownership due to possible self-spending behavior. However, we can conclude that any self-custody coins that have not been spent on the blockchain have not been sold. Of course, it is widely believed that a large share of early bitcoins are now unspendable due to their corresponding private keys being lost.
With those caveats out of the way, let's go to the analysis, which was generously funded by u/moleccc. https://www.reddit.com/r/btc/comments/tt2giy/comment/i2wza86/
Analysis
The research process was fairly simple. From BTC and BCH full nodes I extracted data on all transaction outputs, their corresponding bitcoin value, and the time (block height) they were created. An output is a concept closely related to -- but distinct from -- address. An output is identified by its transaction ID plus its position in the transaction outputs, i.e. first position, second position, third position, etc. Once an output is spent by another transaction, it is spent permanently and cannot be reused. However, an address can be re-used repeatedly. With each address re-use, a unique output would still be created. If I were to carry out the analysis with addresses rather than outputs, then spent pre-fork coins could "come alive" again later in the blockchain history, which would lead to false conclusions. Therefore, the correct unit of analysis is the output.
I checked all pre-fork outputs for whether they had been spent prior to the fork. The outputs that remained unspent at the time of the fork constituted all BTC and BCH in existence at that point in time. Those funds were the unspent transaction output (UTXO) set at the time of the fork. Then I simply checked if and when each of these pre-fork outputs had been spent in a transaction on the post-fork BTC and BCH blockchains.
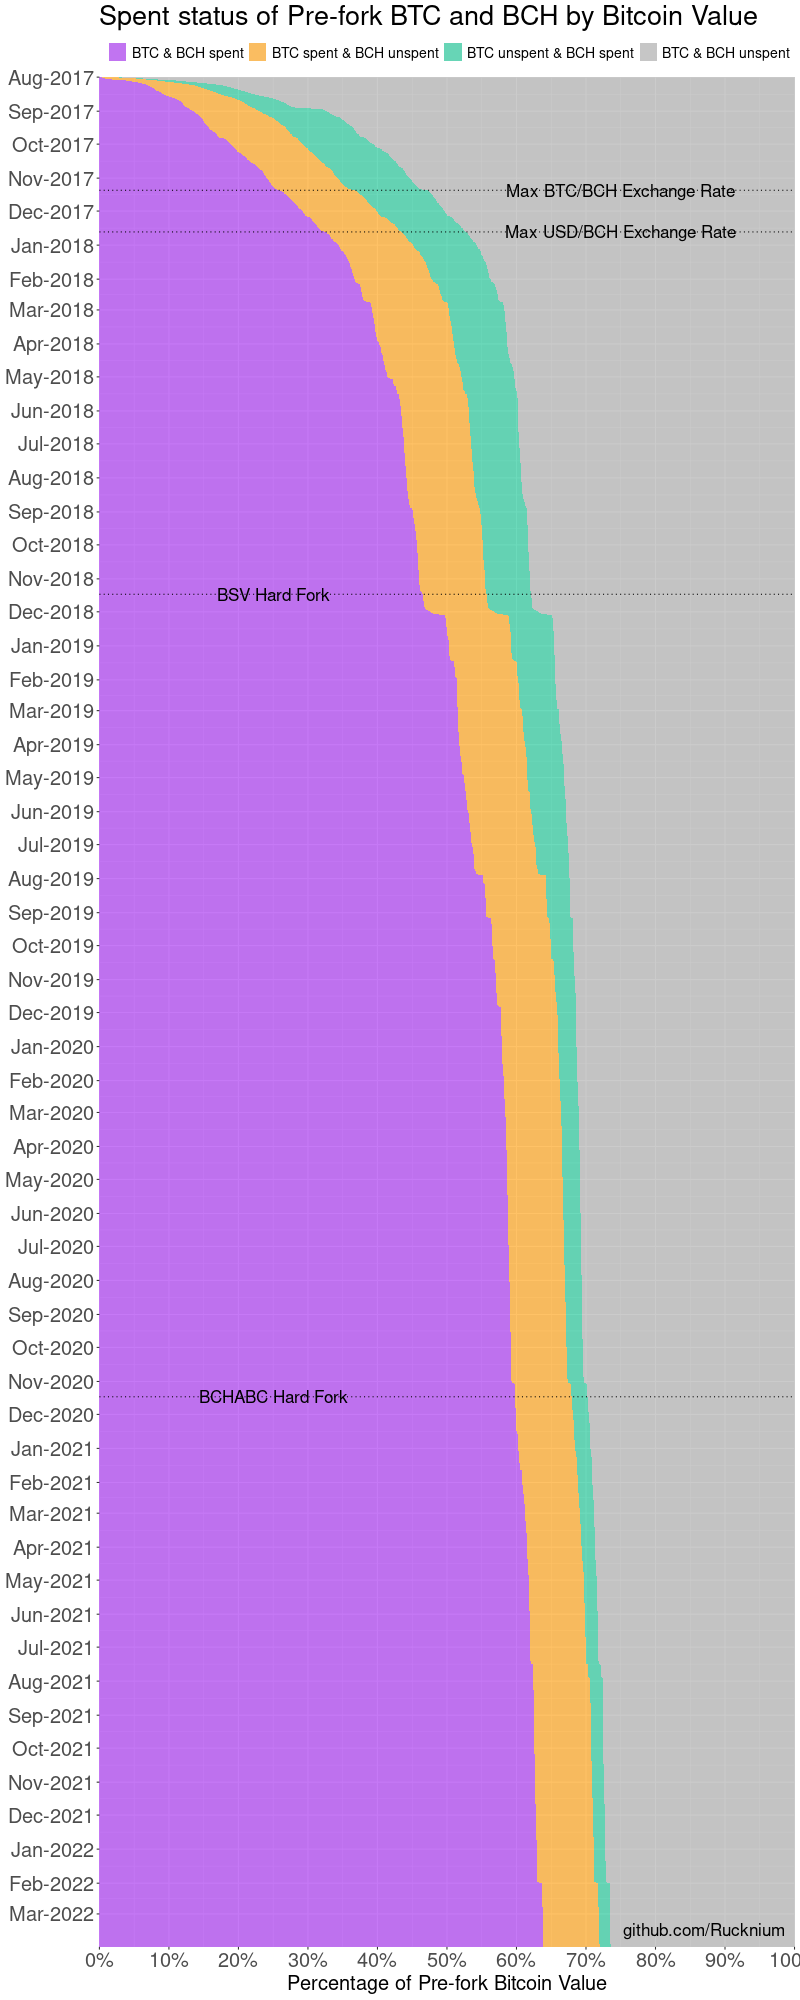
Here are the main results for the spent status of pre-fork bitcoin by bitcoin value (i.e. what appears on the blockchain rather than its fiat valuation) as of March 31, 2022:
`|BTC | BCH | Bitcoin Value | Percent |`
`|Unspent | Unspent | 4,356,697 | 26.4% |`
`|Spent | Unspent | 1,342,945 | 8.1% |`
`|Unspent | Spent | 264,379 | 1.6% |`
`|Spent | Spent | 10,515,129 | 63.8% |`
Almost two-thirds of the value of pre-fork bitcoin has been spent on both the BTC and BCH blockchains. About one-quarter has not been spent on either blockchain; the private keys to many of those coins are probably lost forever, rendering the coins unspendable. By a 5-to-1 ratio more pre-fork bitcoin by value has been spent on the BTC blockchain but remained unspent on the BCH blockchain than bitcoin spent on BCH but unspent on BTC.
A stacked area chart of the trend over time with some key events is below:
A large share of pre-fork bitcoin was rapidly spent in the first few months after the fork. After that, the rate of spending flattens out. In the early months there is almost an equal share of coins that are orange (BTC spent & BCH unspent) and green (BTC unspent & BCH spent), but over time the green share shrinks. There is a sudden jump in spending a few weeks after the BSV/BCH hard fork.
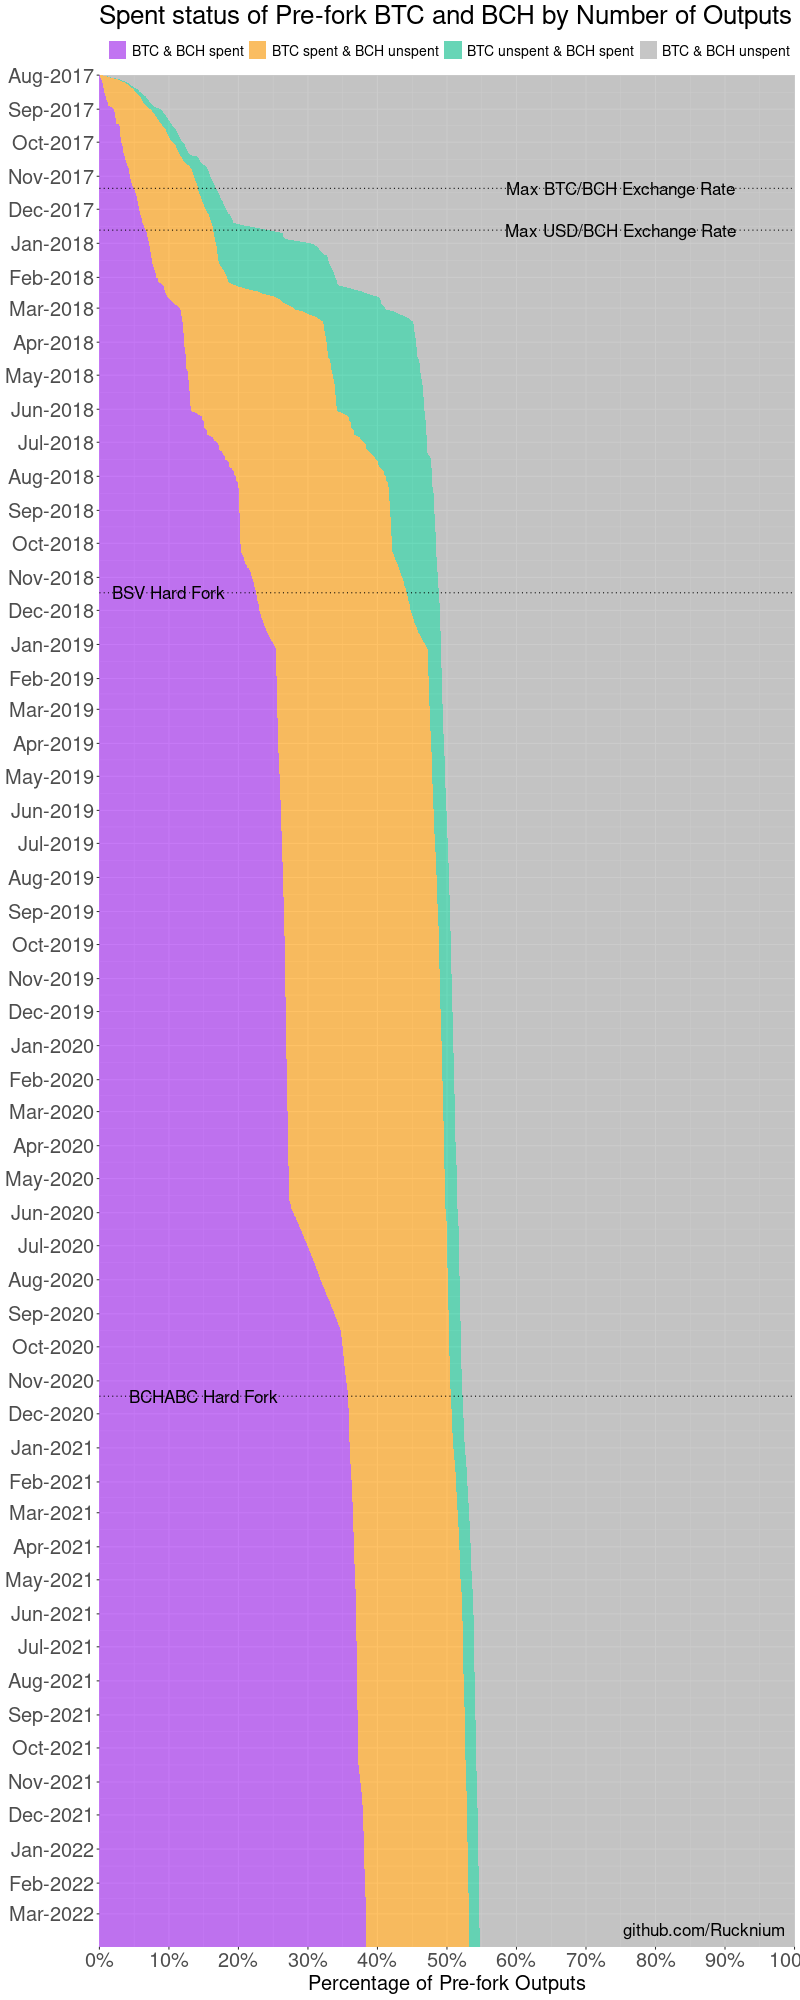
Instead of by value, we can also analyze spending behavior by number of outputs. This gives each output equal weight regardless of how large or small the bitcoin value of those outputs are, possibly giving better insight into the behavior of typical users rather than the few users and institutions that owned a large amount of bitcoin. On the other hand, very small amounts that are not worth transacting -- dust -- are also given equal weight in such an analysis.
The main results for the spent status of pre-fork bitcoin by number of outputs as of March 31, 2022:
`|BTC | BCH | Number of outputs | Percent |`
`|Unspent | Unspent | 24,296,821 | 45.3% |`
`|Spent | Unspent | 7,934,988 | 14.8% |`
`|Unspent | Spent | 808,870 | 1.5% |`
`|Spent | Spent | 20,617,669 | 38.4% |`
Compared to the results by bitcoin value, a much greater proportion of outputs have been left unspent. In particular, the percentage of outputs that have remained "orange" (BTC spent & BCH unspent) rather than "green" (BTC unspent & BCH spent) is much larger. This may be a consequence of the lower fiat-denominated value of BCH compared to BTC. It may be worth it to move a small quantity of BTC, but not an equivalent quantity of BCH.
A stacked area chart of the trend over time is below:
In this chart we can more clearly see the phenomenon of the green area (BTC unspent & BCH spent) rising substantially near the point of maximum USD/BCH exchange rate in December 2017. This may indicate that owners of pre-fork bitcoin may have been moving their BCH -- but not their BTC -- to take advantage of the high exchange rate and sell BCH for fiat currency. Over the following 12 months, the green area shrinks, indicating that those users who moved their BCH eventually also moved their BTC as well. Another notable feature of the chart is the depletion of the orange area (BTC spent & BCH unspent) over the second half of 2020, indicating that those users who had previously spent their BTC eventually spent their BCH as the cryptocurrency exchange rate was recovering after the early-COVID crash.
State Transition Analysis
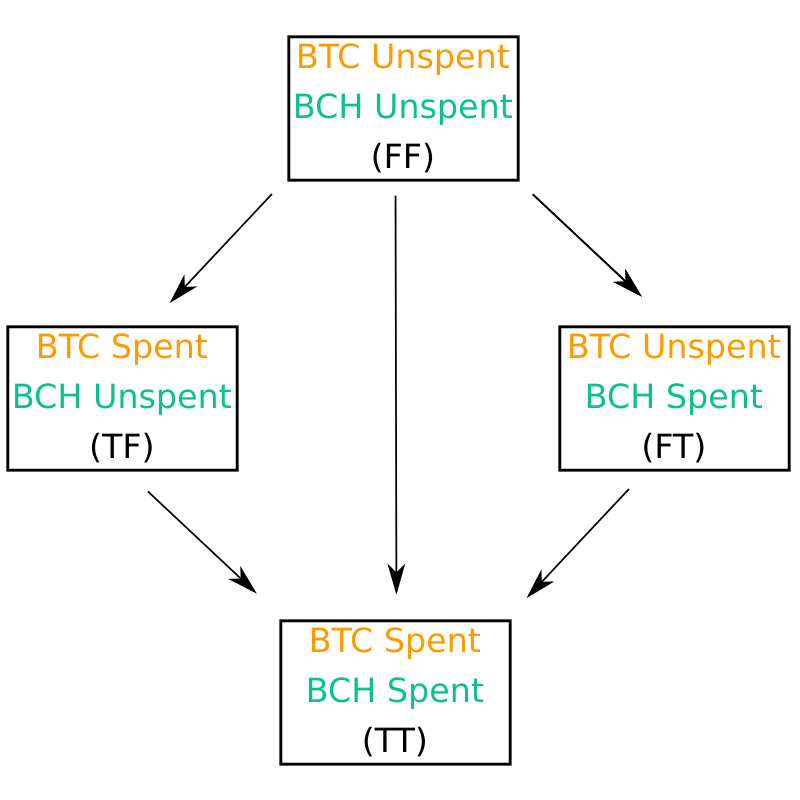
The tables and plots above give a broad overview of the dynamics of pre-fork output spending on the BTC and BCH blockchains. They tell us the status of outputs at any given time. However, they do not tell us in detail how outputs are transitioning between the different "states" of being spent on neither chain, only one of the chains, or both chains. The diagram below illustrates the four different states that an output can go through and the five transition types it can experience.
An output can take three separate paths to arrive at the state of being spent on both chains. It can first be spent on the BTC blockchain and then the BCH blockchain. That is the path on the left side of the diagram. It can first be spent on the BCH blockchain and then spent on the BTC blockchain, which is the path on the right. The last option is to be spent simultaneously on the BTC and BCH blockchains, which is the middle path in the diagram.
For brevity, each state is represented by initials: (FF), (TF), (FT), (TT). "F" is for "Spent: False" and "T" is for "Spent: True". The first position corresponds to BTC and the second position corresponds to BCH. Thus, "(TF)" means that the pre-fork output has been spent on the BTC blockchain, but not the BCH blockchain.
Below is a set of line charts displaying the value of outputs transitioning between each state for each day since the fork. In the chart, a spend on the BTC and BCH blockchains is defined as simultaneous (FF to TT) if it occurred on the same date, using the UTC time zone. The keys dates from the previous two charts are still marked with dotted lines, but the labels are omitted to avoid cluttering the chart.
The heaviest spending in bitcoin value terms occurred in the first few days after the BTC/BCH fork. The highest single-day spike was in late August 2017 when over 500,000 BCH was spent before the corresponding BTC. This plot also shows that the spike in spending two weeks after the BSV hard fork occurred due to simultaneous spends on the BTC and BCH blockchains. The small spike before the BCHABC hard fork was also due to simultaneous BTC and BCH spending.
The corresponding plot for number of outputs rather than bitcoin value is below:
Here again we see a large number of outputs transition from FF to FT around the time when the USD/BCH exchange rate is at its highest in late December 2017. A large number of outputs were then spent on the BTC blockchain as the BTC/USD exchange rate declined in February and March 2018. Later in mid-2018, the number of outputs transitioning from FT to TT spikes, representing outputs spent on the BTC blockchain that had already been spent on the BCH blockchain. Throughout the timeline, the number of outputs that are simultaneously spent on the BTC and BCH blockchains (TT to FF) is comparatively small.
Conclusion
As expected, the highest volume of spending of pre-fork BTC and BCH occurred in the first few days after the fork. There was also a spike in spending of low-value outputs on the BCH chain around the time of maximum USD/BCH exchange rate. The great majority of pre-fork BCH has already been spent (along with BTC), so it is unlikely that a large amount of BCH is waiting to be put back into circulation.
*Code to reproduce this analysis is available* *here**. The data files are available* *here**.* https://github.com/Rucknium/misc-research/tree/main/Pre-fork-BCH-BTC-Spending https://rucknium.me/data
*This post also* *appeared* *on my personal website.* https://rucknium.me/posts/pre-fork-btc-bch-spending/
94 percent of all BCH transacted since July 2020 is now a descendant of a CashFusion transaction
As government scrutiny of cryptocurrencies has intensified over the last several months, concern has grown over the possibility of a two-tier market for cryptocurrencies that have a transparent ledger. On one side, there are "clean" coins that are held and disbursed by centralized exchanges that require identity documents to comply with government-mandated Know-Your-Customer (KYC) regulations. On the other side, there are "dirty" coins of a unknown provenance that may come from mixers, CoinJoin transactions, and peer-to-peer trading. The world of "dirty" coins includes thieving hackers but also ordinary people who merely want to maintain their privacy amid increasingly intrusive mass surveillance.
A CoinJoin is a special type of cryptocurrency transaction that obscures the source and destination of payments by bringing together the coins of many different users within a single transaction. Bitcoin Cash (BCH) developers created a CoinJoin implementation called CashFusion, officially released in July 2020. BCH users have participated in over 125,000 CashFusion transactions. https://cashfusion.org/ https://fusionstats.redteam.cash/
FATF Warning on Mixers
The Financial Action Task Force (FATF)'s "Virtual Assets Red Flag Indicators of Money Laundering and Terrorist Financing" report identifies CoinJoins (referred to in the broader *mixer* category) as one of several "red flags" that centralized exchanges and payment processors may want to investigate or block: http://www.fatf-gafi.org/publications/fatfrecommendations/documents/Virtual-Assets-Red-Flag-Indicators.html
The various technological features below increase anonymity and add hurdles to the detection of criminal activity by [Law Enforcement Authorities]. These factors make [Virtual Assets] attractive to criminals looking to disguise or store their funds. Nevertheless, the mere presence of these features in an activity does not automatically suggest an illicit transaction...
Transactions making use of mixing and tumbling services, suggesting an intent to obscure the flow of illicit funds between known wallet addresses and darknet marketplaces.
Indeed, users of BCH have recently discussed reports of CoinJoined BTC coins being blocked from established services, wondering if BCH that has passed through CashFusion transactions may one day be blocked. These concerns have only increased with the introduction of new rules requiring Coinbase users in Canada, Singapore, and Japan to provide more identity information about recipients of cryptocurrency transactions and today's vote on stronger KYC requirements in the EU. https://www.reddit.com/r/btc/comments/sztwd2/bitcoins_fungibility_graveyard_are_bch_and_cash/ https://www.reddit.com/r/btc/comments/sljvil/comment/hvsga8l/ https://www.msn.com/en-us/money/other/coinbase-to-require-recipient-information-for-crypto-transfers-from-users-in-canada-singapore-and-japan/ar-AAVv7vL https://blog.coinbase.com/making-your-voice-heard-ahead-of-thursdays-critical-eu-vote-f03730e83e5c
Research Question
These issues raised in my mind the question of how well-integrated CashFusioned coins are with the rest of the coins on the BCH blockchain. Is CashFusion restricted to a small corner of the blockchain -- either due to isolated users or established services segregating the coins -- or are they spread widely through the blockchain?
In other words, ***if established services wanted to completely avoid dealing with BCH that had ever passed through a CashFusion transaction, would they be able to?***
After a couple of months of on-and-off coding and several weeks of computation time, I can finally answer that question: ***No, not as a practical matter*****.**
Bitcoin transactions create a series of outputs specifying who gets paid and how much. These transaction outputs (TXOs) are then spent by other transactions as inputs. Unspent transaction outputs (UTXOs) form a set representing all coins on the blockchain available for spending.
I have found that 94 percent of the value in the UTXOs created between July 29, 2020 and December 23, 2021 (corresponding to block heights 646085 and 719602) is a direct or indirect descendant of a CashFusion transaction. This represents 10 million of the 19 million BCH that currently exist.
Counting by the proportion of outputs (and not by value), CashFusion's integration with the rest of the blockchain is even higher: 98.6 percent of all outputs in that UTXO set are a CashFusion descendant. The total number of outputs in that UTXO set is about 26.7 million.
Visualization: What is a CashFusion Descendant in the UTXO Set?
A transaction that spends the coins (i.e. outputs) of a previous transaction is a child transaction. And, in turn, a transaction that spends the child transaction's coins is the grandchild of the original transaction. If the outputs of a transaction can be traced backward in time to a particular transaction through a series of parent-child relationships, then that transaction is said to be a descendant of that earlier transaction.
The UTXO set is all of the outputs that have not yet been spent. In other words, the UTXO set is the grand total of all coins that BCH owners possess in their wallets, available for them to spend.
The figure below illustrates these concepts, using a fictional transaction graph (i.e. network relationship) with various scenarios. The red circles are CashFusion transactions. Purple circles are non-CashFusion transactions that are descendants of CashFusion transactions that have already been spent at this point in time in this fictional scenario. Orange circles are unspent outputs that are descendant from CashFusion transactions. https://en.wikipedia.org/wiki/Graph_(discrete_mathematics)
The blue circles, on the other hand, represent spent outputs that do not have any CashFusion ancestors. If an output is unspent but remains untouched by a CashFusion transaction, then it is green. Notice that when blue circles combine with purple circles, their descendants are all purple.
In the figure, the total value of the UTXO set is the sum of all coins contained in both the orange and green circles. When I say that 94 percent of BCH in the UTXO set created in the last year-and-a-half is a descendant of a CashFusion transaction, I mean that the orange circles contain 94 percent of the value of the orange and green circles combined. Another way of describing this UTXO set is that these are coins that are in "active addresses" on the BCH blockchain.
Research Process
To identify the CashFusion descendants I wrote code in the R statistical programming language to query the BCH blockchain, construct the transaction graph consisting of over 200 million vertices and 280 million edges, and traverse the transaction graph to identify all UTXO vertices that were reachable starting from the CashFusion transactions. Pivotal in the process were the `rbch` package, which I adopted from the `rbtc` package with support from my Flipstarter campaign, and the `igraph` package for fast graph analysis operations. https://en.wikipedia.org/wiki/Vertex_(graph_theory) https://en.wikipedia.org/wiki/Glossary_of_graph_theory#edge https://cran.r-project.org/package=rbch https://cran.r-project.org/package=rbtc https://flipstarter.redteam.cash/ https://cran.r-project.org/package=igraph
I have released the R code under the GPL-3 open source license here. The finalized dataset containing the UTXO set and indicators for whether each UTXO is a CashFusion descendant is available here. https://github.com/Rucknium/misc-research/tree/main/CashFusion-Descendant-Analysis https://rucknium.me/data
Secondary Results
94 percent of BCH may be a CashFusion descendant, but how many "generations" of transactions separate a typical UTXO from its closest CashFusion ancestor? I took a random sample of 1,000 CashFusion-descended UTXOs from the UTXO set and computed the distance to the nearest CashFusion transaction.
The median number of transaction separating a UTXO and its nearest CashFusion ancestor is 463. The mean is 1215. The 25th and 75 percentile are 30 and 1819, respectively.[*] From these statistics we may conclude that most CashFusion descendants are only weakly linked to CashFusion transactions, despite the fact that the vast majority of the UTXO set is a CashFusion descendant.
Would a chain analysis firm be able and willing to track CashFusioned coins through so many transactions? Yes. Chainalysis reported that they are tracking BTC associated with the PlusToken scam even though they have been involved in tens of thousands of transactions: "The scammers have transferred the Bitcoin more than 24,000 times, using more than 71,000 different addresses..." https://blog.chainalysis.com/reports/plustoken-scam-bitcoin-price/
The large distance between the typical UTXO and its nearest CashFusion ancestor indicates that many transactions must have occurred between the CashFusion transaction and the UTXO -- and therefore, most likely much time had passed. To gain insight into this issue, I re-ran the analysis for just the month of February 2022 (block heights 725290 to 729371).
The total quantity of BCH in the UTXO set created in February 2022 was 1.9 million BCH. 44 percent of the value of that UTXO set was a descendant of a CashFusion transaction that occurred in that month. 60 percent of the number of outputs in the UTXOs set (2.2 million outputs in total) were CashFusion descendants.
It is not surprising that restricting the analysis to shorter time frames results in a smaller proportion of the UTXO set becoming a CashFusion descendant. In technical terms, this is because "CashFusion descendant" is an absorbing state. In other words, once a quantity of BCH becomes a CashFusion descendant, it will forever remain a CashFusion descendant, by the definition of this analysis. Therefore, as more time passes, the (unconditional) probability of some quantity of BCH being a CashFusion descendant gradually increases. https://en.wikipedia.org/wiki/Absorbing_Markov_chain
From my observations, it seems that all CashFusion transactions do not contribute equally to the spread of CashFusion descendant status to the UTXO set. I wrote the code so that the process of identifying CashFusion descendants started at the most recent CashFusion transaction and worked its way backward toward the oldest CashFusion transaction.
I noticed that the proportion of the UTXO set that is a CashFusion descendant did not rise steadily. Instead, it would rise very slowly for some time as it worked its way through each CashFusion transaction and then experience sudden jumps of several percentage points once it processed a particularly well-connected CashFusion transaction. For example, in the February 2022 sub-analysis, at one point the proportion of the UTXO set that is a CashFusion descendant jumped from 15 percent to 57 percent due to a single CashFusion transaction. About 57 percent of the UTXO set created in February 2022 is a descendant of that one transaction. It is likely that one of the outputs from that CashFusion transaction eventually found its way into an important wallet like a centralized exchange or service, and the wallet then spread the output far and wide. https://blockchair.com/bitcoin-cash/transaction/51c13170f90543e78a80722e464c4954a79a0275eaad34c3af7fba227779ac7e
Possible Further Work
Can this analysis be done for BTC? Yes and no. The code that I wrote should in theory be inter-operable with the BTC node software. The main barrier to a corresponding analysis of BTC CoinJoins is the effort required to identify all of the BTC CoinJoin transaction.
Identifying BCH's CashFusion transactions was easy. Every CashFusion transaction has "FUZ" in its `OP_RETURN` field, so I only needed to write a script to gather the transaction IDs of all CashFusion transactions, which I have done for my cashfusion.redteam.cash web app. Identifying all the various CoinJoin implementations on BTC would be much more challenging. If anyone is aware of a reliable database of BTC CoinJoin transaction IDs, please let me know. https://github.com/Rucknium/CashFusionStats https://fusionstats.redteam.cash/
Speaking of the cashfusion.redteam.cash web app, could this analysis become one of the metrics that the web app tracks? Perhaps. This analysis that takes July 2020 as the starting point required weeks of computation time. Because of the way that the transaction graph is connected, an "update" to the data would still require a similar time for re-computation. However, since completion of the analysis I have thought of a shortcut that could dramatically reduce the computation time. I have not yet tested the idea, but if successful I could incorporate this metric into cashfusion.redteam.cash. https://fusionstats.redteam.cash/
The Future of BCH
Frankly, I was a little shocked at my results. I didn't expect that CashFusion would be so well-integrated into the rest of the BCH blockchain. Of course, to some extent the level of integration is high due to how I've defined it: A descendant is a descendant no matter how many transaction separate it from its ancestor CashFusion transaction.
In spite of the fact that CashFusion is so well-integrated, I have seen no credible reports of a centralized exchange rejecting deposit of BCH due to CashFusion ancestry, whereas rejection of BTC due to a recent CoinJoin is a fairly common occurrence at this point in time.
On the other hand, that may be *because of* -- not in spite of -- the fact that CashFusion is so well-integrated. Perhaps centralized exchanges choose not to ban recent CashFusion descendants because they would be locking themselves out of a substantial proportion of BCH in circulation. Another possibility is that BCH overall has "flown under the radar" of anti-privacy policies since it is a minority-hashpower hardfork of BTC with little reputation of nefarious activities happening on its blockchain.
As use of CashFusion expands and more wallets integrate it as a feature, will BCH become akin to Dash or Decred, which have optional CoinJoins integrated into their protocols?[**] And therefore will centralized exchanges and services be forced to accept CashFusioned coins as a routine part of dealing in BCH? Or will there be a crackdown? https://www.reddit.com/r/btc/comments/rs4m44/pokketcash_cashfusion_beta_now_available/
*The article also* *appeared* *on my personal website.* https://rucknium.me/posts/cashfusion-descendants/
*Thanks to* *kayabaNerve* *and* *plowsof* *for reviewing a draft of this post.* https://github.com/kayabanerve https://github.com/plowsof
[*] : Since this is a sample of a population, there is sampling error. In my professional opinion, a nonparametric bootstrap is appropriate for constructing confidence intervals in this setting since graphs can have unusual statistical properties. The 95 percent confidence intervals on median, mean, 25th percentile and 75th percentile are (367, 595), (1128, 1304), (29, 31), and (1648, 2059), respectively.
[**] : Note that Dash has sought to distance itself from its reputation as a privacy coin. https://decrypt.co/47974/darkcoin-to-dash-the-5-year-fight-to-rebrand-a-privacy-coin

Update on CashFusion Red Team Phase One Flipstarter
It is about time that I give a progress update on my CashFusion Red Team Phase One Flipstarter. https://flipstarter.redteam.cash/
As a reminder, the long term goal of CashFusion Red Team is to investigate any weaknesses in the CashFusion CoinJoin protocol and/or CashFusion user behavior and attempt to mitigate them. The main projects of Phase One are to improve the fusionstats.redteam.cash web app and release the `rbch` R package for statistical analysis of the BCH blockchain. https://cashfusion.org https://fusionstats.redteam.cash
In the weeks after my Flipstarter was successfully funded, I stumbled upon a statistical weakness in Monero's decoy selection algorithm. I chose to temporarily shift my focus from CashFusion Red Team to developing a plan to address the weakness, which eventually became OSPEAD: Optimal Static Parametric Estimation of Arbitrary Distributions. https://ccs.getmonero.org/proposals/Rucknium-OSPEAD-Fortifying-Monero-Against-Statistical-Attack.html
Recently I have shifted back to CashFusion Red Team. So far I have accomplished about half of the tasks I set out to do.
Release of `rbch`
Earlier this month, the first version of `rbch` was approved for distribution through the Comprehensive R Archive Network (CRAN). This means that every R user in the world can now install `rbch` by simply typing
install.packages("rbch")
into their R console. Documentation for the package is available on the CRAN website. Special thanks to Bernhard Pfaff who wrote `rbtc`, which was the basis for `rbch`. https://cran.r-project.org/package=rbch
Improvements to fusionstats.redteam.cash
So far the improvements in the "production" instance of fusionstats.redteam.cash have been modest. Data on CashFusion transaction fees have been added to the searchable table that displays each CashFusion transaction. Automatic realtime updating of the data is coming soon. https://github.com/Rucknium/CashFusionStats/commit/8371941de529eea7487014d268215024177818f6 https://github.com/Rucknium/CashFusionStats/commit/1bd777010daee796b23959b4a4ba11d1e915f9d3
Near-term work
Upcoming features on fusionstats.redteam.cash are being tested on beta.redteam.cash, with development work occurring on the `beta` branch of the GitHub repository. Already available is a Sankey diagram, which visualizes the flow of BCH into and out of CashFusion transactions. https://beta.redteam.cash https://en.wikipedia.org/wiki/Sankey_diagram
I have posted a roadmap of features being developed for the web app. Among them are tools to calculate and visualize the quantity of BCH flowing into and out of the CashFusion "pool". Comments on the roadmap are welcome. A revision to the aesthetics of the web app is in the works as well. https://github.com/Rucknium/CashFusionStats/issues/2
In the near future I plan to move fusionstats.redteam.cash from Njalla hosting to 1984.is, which offers VPS configurations with more resources than Njalla. As I originally said in my Flipstarter proposal that I would use Njalla for hosting, please let me know if you object to this move and I would reconsider.
I am also working on benchmarking the RPC-JSON performance of each of BCH's full node implementations, as I mentioned in my Flipstarter proposal. Since using `rbch` requires processing a huge amount of data requested through RPC-JSON, these results can help myself and other users of `rbch` to attain the best performance.
Finally, with `rbch` and the `igraph` R package I have begun computing the proportion of the entire unspent transaction output (UTXO) set of BCH that has a CashFusion transaction as an ancestor. This is an important research question since it can give a sense of how well-integrated CashFusion is with the BCH blockchain as a whole.
*This post also* *appeared* *on my new personal website:* *Rucknium.me* https://rucknium.me/posts/cashfusion-red-team-flipstarter-update/ https://Rucknium.me

Scheme or scam? An empirical analysis of Satoshi Pyramid
**EDIT Aug 2 2021:** **u/guyfawkesfp** **has stated that there are no plans for a round 2 of Satoshi Pyramid, as explained** **here****. Also, my assumption about how the operator fee is calculated was evidently incorrect, as pointed out by** **u/Functioning_Idiot** **under my** **post on Reddit** **and confirmed in the post by** **u/guyfawkesfp** **. The total fees sum up to about 200 BCH, not the 103 BCH that I had initially calculated.** https://www.reddit.com/u/guyfawkesfp/ https://np.reddit.com/r/btc/comments/owf9sj/satoshipyramid_raised_200_bch_in_funding_which/ https://www.reddit.com/u/Functioning_Idiot/ https://www.reddit.com/r/btc/comments/ovy14w/scheme_or_scam_an_empirical_analysis_of_satoshi/
In about 24 hours, Satoshi Pyramid is set to start another 60-day round of exponential speculation. Satoshi Pyramid is a Bitcoin Cash-based pyramid scheme that is completely honest about being a pyramid scheme. You double your money or come out empty-handed. In order for a Satoshi Pyramid "investor" to get a payout, someone else must decide to invest after them and deposit money into the scheme. The risk for the later investor is that the flow of people depositing into the scheme may dry up, so no one might pay, in turn, for their payout. Details about the rules are explained in guyfawkesfp's read.cash article and this snapshot of satoshipyramid.com https://read.cash/@guyfawkesfp/how-satoshipyramidcom-plans-to-10x-the-bch-userbase-10x-the-bch-price-and-fund-bch-infrastructure-2dcd7a59 http://web.archive.org/web/20210801160908/https://satoshipyramid.com/
Classifying Satoshi Pyramid
Satoshi Pyramid is definitely a scheme, but what type of scheme is it? Satoshi Pyramid can be classified as a game of perfect information within the framework of game theory. What does this mean? A game has perfect information if every player has all the information about the current state of the game at every point that they need to make a decision. Chess is a game of perfect information since information about the position of the pieces is available each time a player needs to make a move. Rock-paper-scissors is not a game of perfect information, however, since at the point of having to make a decision about which move to play, a player does not know the move that their opponent intends to make. Card games like poker and blackjack are games of imperfect information that also add a random element to the game state through card shuffling. https://en.wikipedia.org/wiki/Perfect_information
Satoshi Pyramid is a game of perfect information since information about the moves that other players have made are available to all players on an immutable, public, distributed ledger. There is also no random element. This seems to be an improvement on a typical Ponzi scheme in which investors are not even aware that they rely on later investors to ensure their payouts.
Scam alert?
So, it's a scheme, but is it a scam, as it has been called? Defining "scam" may be difficult since the word means different things to different people. The Merriam-Webster Dictionary defines a scam as "a fraudulent or deceptive act or operation." Is Satoshi Pyramid fraudulent or deceptive? One way to answer this question is to determine whether the operator paid out to depositors when the operator promised to. https://read.cash/@Pantera/satoshi-pyramid-is-a-scam-9c931af0
A depositor is supposed to be paid double their deposit (minus a 10 percent fee) at the point in time at which the cumulative amount of BCH that has been deposited is double the cumulative amount of BCH that was deposited when the deposit made their initial deposit. Current depositors pay for the payouts of past depositors. So the question can be asked: Did depositors receive their payouts when they were supposed to be triggered?
Fortunately the BCH blockchain provides all the information necessary to answer this question. It shows amounts of BCH being sent from players' addresses into the Satoshi Pyramid deposit address and, in turn, BCH being sent from the Satoshi Pyramid payout address to players' addresses when payouts have been triggered. With the elbow grease of a little coding and the help of Bitcoin.com's blockchain API, all information can be extracted.
Digging into the blockchain data
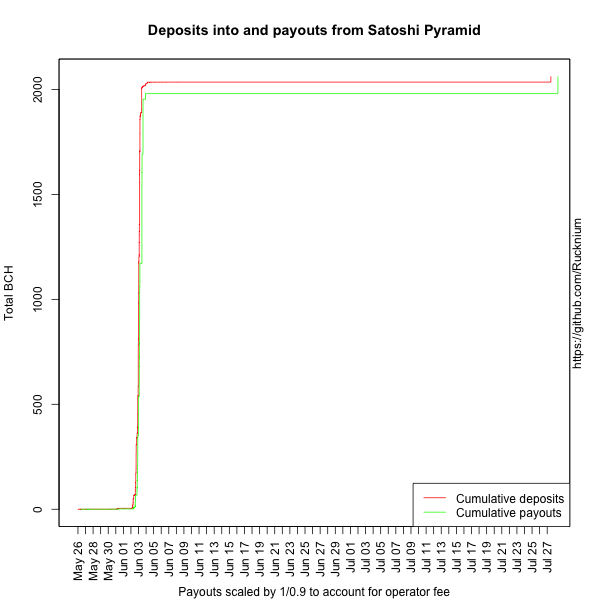
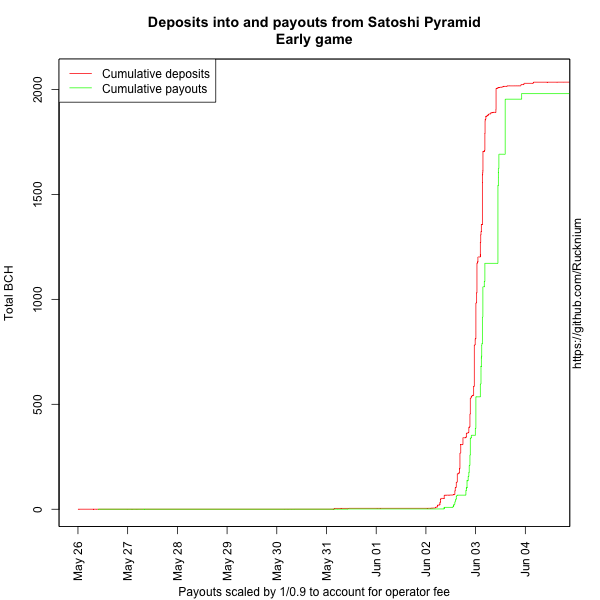
Figure 1 displays the results of this data extraction. The two lines in the chart are the cumulative amount of BCH that was deposited and paid out over time. Besides few large late deposits that happened a few days ago, almost all action occurred from May 26 to June 5. Let's zoom in there.
Figure 2 is a little better, but the very early parts of the lines are still compressed and obscured. By its very nature Satoshi Pyramid is exponential since deposits are to be doubled. Setting the vertical axis on a logarithm scale unwinds the exponential relationship and yields the best view of the data.
From Figure 3 it is apparent that there were batched payouts regularly executed as the cumulative amount of BCH deposited rose. The official rules of the SatoshiPyramid.com website states, "SatoshiPyramid deposits are made into a secure cold wallet system. For security reasons payouts may take up to 12 hours to process."
Although a bit tricky, it is possible to match specific payout transactions to their corresponding deposit transactions on the BCH blockchain. With a few lines of code I was able to link 96 percent of payouts to their deposits.
The average amount of time between a deposit reaching its payout threshold and the payout transaction being confirmed on the blockchain was about 5.5 hours. The time interval ranged from 1 hour to 23.5 hours. In 95 percent of cases Satoshi Pyramid achieved its stated goal of paying out to depositors within 12 hours of reaching the payout threshold.
"Market" crashes
Around June 4, large deposits to Satoshi Pyramid suddenly ceased. In certain asset markets, bubble phenomena can develop in which traders buy an asset not because of its inherent value but because their belief that they will be able to sell it for more money than the price at which they purchased it. This is the "greater fool" theory: I may be a fool to buy this asset at such a high price, but I believe I can sell it at a higher price to an even greater fool. The cession of large deposits on June 4 was akin to an asset bubble bursting or a market crash. Suddenly, the sentiment turned against the frenzy of depositing ever-larger amounts. https://en.wikipedia.org/wiki/Greater_fool_theory
The bottom line
In total, 330 deposits summing to 2062 BCH were made in round 1 of Satoshi Pyramid. There were 161 payout transactions totaling 1856 BCH. The quantities deposited ranged from a few satoshis to 185 BCH, with the average being 6.25 BCH and the median deposit amount at 0.21 BCH.
As for the subset of the deposits that did not result in a corresponding payout due to the market crash, the summary statistics are similar to the overall set of deposits as a whole: the maximum single deposit that did not mature into a payout was 146 BCH. The average was 6.21 BCH and the median was 0.20 BCH. The total amount of BCH deposited that did not result in a corresponding payout was 1031 BCH.
The fees obtained by the operator are 10 percent of the deposits that matured. (The Satoshi Pyramid rules state that any deposits that did not mature into a payout would be rolled over to initiate the next round.) The fees sum to 103 BCH, which at the time of writing was valued at about 50,000 USD. The operator has stated that "These fees will be used to fund the development of Bitcoin Cash applications and infrastructure." https://read.cash/@guyfawkesfp/how-satoshipyramidcom-plans-to-10x-the-bch-userbase-10x-the-bch-price-and-fund-bch-infrastructure-2dcd7a59
The code used to extract the data is available here; the resultant datasets are here; charts are here. I believe the data analysis presented here to be accurate, but there is always the possibility of a mistake in the code; I welcome any corrections. A shorter version of this article was posted to reddit.com/r/btc. https://github.com/Rucknium/SatoshiPyramidAnalysis https://github.com/Rucknium/SatoshiPyramidAnalysis/tree/main/data https://github.com/Rucknium/SatoshiPyramidAnalysis/tree/main/charts https://www.reddit.com/r/btc
*Disclosure statement: I have no association with the operator of Satoshi Pyramid. I deposited a small amount of BCH early in round 1 to test the Satoshi Pyramid system and subsequently received a payout when the threshold was reached.*
 @Rucknium