WHY Bitcoin Cash is SUPERIOR to Bitcoin?
*****Bitcoin Cash:*****
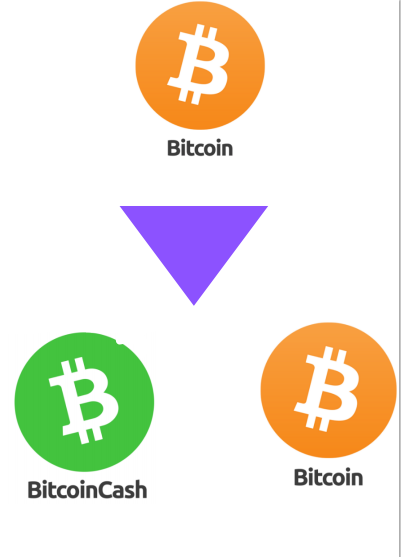
For those of you who are new to Bitcoin Cash. You should know that Bitcoin Cash is the fork of Bitcoin but it has its own blockchain and the project has been getting active development from its supporters from the beginning. If we look at the basics of the coin the max number of the coin is capped at 21 Million, being the fork of the Bitcoin. Later in 2018, the Bitcoin Cash was forked again to BCHABC and BCH SV(Bitcoin Cash Satoshi Vision) but in this article, I am only talking about the Bitcoin Cash(BCH ABC).
****Reason for Bitcoin Cash:****
The fork is the split of the chain of the Blockchain and it occurs because of the disagreement between the certain upgrade or development between the miners or nodes or we can call this as the Bitcoin original community. For the clarification of the exact reason, we have to know about the Block size. From the beginning of Bitcoin, there has been controversy about Bitcoin Block size. Some were wanting to have the Block size higher so that the transactions get proceed faster because more transactions could be recorded in the same block whereas there were few who want to stick with the low block size.
Increasing the Block Size would massively increase the scalability of the network which makes me really think Bitcoin Cash is the network that has the power of the adoption. I would describe more about this later in the latter portion.
WHY BITCOIN CASH IS SUPERIOR TO BITCOIN?:
***DECENTRALIZATION:***
When it comes to cryptocurrency, the first thing that comes to everybody's mind is decentralization. There are many factors that need to be considered for decentralization. The first one is to be usable for everyone. I mean affordable for the high-level people and low-level people too. It may be easy for few people to pay a 10$in the transaction fee but there are many people who need to do the transaction of 10$ and paying 10$ in fee for sending 10$ is a hurdle. This makes decentralization really difficult and decreases the affordability of the network. If we look from the satoshi perspective then he had made the network for the usability of all of the people across the border but with this huge surge in the price of the fee of the Bitcoin, it has become a useless asset for the day to day usage. If we look at the y chart and fee of Bitcoin Network transactions it had reached the peak of 61$ on April 21. This makes me really sad because I was also having difficulty moving my bitcoins at that time.
On the other side, the BitcoinCash transaction fee has been very low. In number, it is 0.0072$ at the moment of writing this post. The approach of decentralization and using the asset as the way for payment in Bitcoin Cash wins without any further talks. This makes the Bitcoin Cash perfect for the day to day use. Talking personally, I can't pay a 7$ in fee for my 100$ Bitcoin but I can easily pay or send it to someone using Bitcoin Cash.
*****SCALABILITY:*****
The ***Block*** Size of Bitcoin is less than 1Mb which makes it able to do transactions up to only 7 per second and it is even lower at the peak condition. With the concept of global money, Bitcoin lags because of this problem. But the Bitcoin Cash has solved this problem because the block size of the Bitcoin Cash is between 8MB and 32MB. It can support TPS up to 25,000. It is like 3000 times more than Bitcoin in the speed and also wins over the giant payment company like Visa and Mastercard. This makes the BCH a perfect candidate for being used across the globe in different sectors and for a wide variety of purposes. I think Satoshi's dream would be possible because of the BCH.
Currently, Lightning Network is being implemented parallel with the Bitcoin Network it lacks the same level of security and decentralization. I have used it personally but it is limited only to few vendors and many people aren't even aware of it. For normal people it is difficult to understand Bitcoin and Blockchain and adding more and more stuff will make it even worse for non-techy people to understand the concept behind it. Because I can't explain lighting network to my grandmother whose mind is already filled when I explained her Blockchain.
COMMUNITY:
I would also like to address the community of BCH and BTC. Almost all new people that come to Bitcoin are because of the money and making their native currency they are depositing to be double or triple within the short time frame. Some may disagree with this point but people are coming with intention of making money to be a part of the BItcoin community not because it is Blockchain-based and decentralization is its key motto.
In my personal experience, my friends ask me how to buy Bitcoin in a bull market when there is strong FOMO and make few bucks and get away from Bitcoin totally during the bear market. I believe most of the trader that joins during the bull market is nothing more than retail investor or wall-streets, whatever you name it. But when it comes to the community of Bitcoin Cash, the story is completely different as far as I am concerned. Those who are family of the Bitcoin Cash stay and use the network during the cold winter bear market and they are more focused on decentralization more than making quick bucks and fading away. This is really important for the sustainable development of the project in the long run.
*****MINING DIFFICULTY:*****
With a lot of competition ongoing between the bitcoin miners from all around the world. The Bitcoin difficulty has spiked really high and for the normal people with normal spec, it is almost impossible to stand in the field of BTC mining. For getting started in BTC mining unless you have a number of rigs it seems a waste of energy because it won't be profitable and paying electricity and maintenance bills would be a problem. But with the BCH, the thing is different. The difficulty is much lower than Bitcoin and it makes it easy for those who like to run their BCH nodes without investing a huge amount of money and it also reduced the energy consumption of the network in the big picture. If we talk in exact number the Bitcoin difficulty as of today is 21.05 T, which in comparison with the difficulty of the Bitcoin cash's 324 G is much smaller and less energy consumptive.
Also, the Bitcoin Cash community is powering the platforms like noise. cash and read. cash which makes the people more interested in the crypto world and blockchain. I also like to add that as one of the small advantages of the BCH family.
***DISCLAIMER:***
This article was made to address the flaws of bitcoin and how BCH has solved that only. Personally, I have no bias regarding both of them and I am also holding BTC in my portfolio. If you have any facts that I am missing, I would be pleased to welcome them to the comment section.
@Ridam
My other article: You may like to Check:
Create NFT for 0$, No coding-https://read.cash/@Ridam/create-and-sell-nft-for-free-0-fee-no-coding-7bf90b6e
ETH,BSC,TRX Blockchain- https://read.cash/@Ridam/eth-blockchain-tron-blockchain-bsc-chain-0dbefff1
Crypto Trading Explained from 0-Hero=https://read.cash/@Ridam/crypto-trading-technical-analysis-explained-from-zero-to-hero-d80da221
My Bitcoin Cash Trading Strategy=https://read.cash/@Ridam/my-bitcoincash-trading-strategy-630dab37
Create and sell NFT for FREE? 0$ FEE, NO Coding
**NFT:**
Non- Fungible Tokens are the tokens that are built on the ERC-721 Standard of the Ethereum Blockchain. They are different from each other and are unique so no two NFT are identical.
**What you can turn into NFT?**
VIDEO
AUDIO
JPG FILE OR IMAGE
DIGITAL ARTS
ARTWORK
GRAFFITI
PAINTINGS
YOUR TWEET
YOUR POST
GAME WEAPONS
LAND
AND MANY MORE.....
**Why NFT?**
They are easy to store and are secured because they are stored on Blockchain
They are not identical, so there could there is no way of a copy of your work.
You can auction them with millions of people across the border without any issue.
You can send them to anyone across the border only by paying a transaction fee.
You can get % of the sale after you sold it in the auction.
**How To Create NFT?**
To create the NFT, at first you should have your art or the work that you would like to convert in the NFT. It can be on any of the formats like jpg, png, or your choice that is supported.
**Requirements:**
YOUR WORK
AN ETHEREUM WALLET(Metamask or any other, I am using Metamask)
A mobile or PC connected to the Internet
**STEP-WISE TUTORIAL:**
In this tutorial, I would be using the platform named Mintable.
1) Go to the mintable website. The link to the website is this:
https://mintable.app/
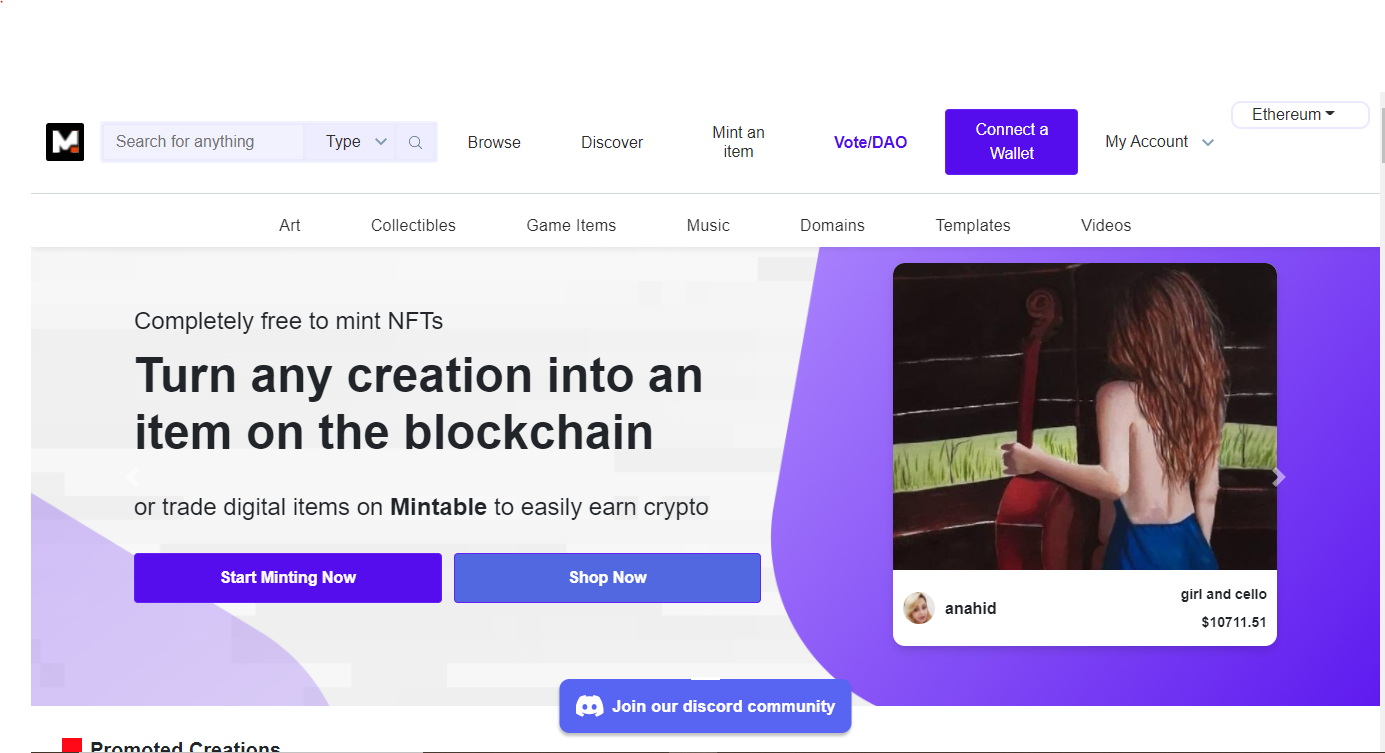
2) You will see the screen as below. And Click on connect wallet option. You can choose the Blockchain for the wallet. You can use ZILIQUA OR ETH BLOCKCHAIN. I am using Ethereum Blockchain. Remember there is no gas fee for minting but if you like to send it to another wallet, you need to pay the gas fee.
3) After login using metamask, You will see this in the header:
4) Now just click on start minting and It will ask you for two option:
The NFT is already in my wallet(If you already have NFT, select this but we don't have to skip this one for now)
Create a NEW Item. (Click here)
5) After this, You will see another page telling you to choose between the gasless or the gas version. Obviously, I will choose gas less version.
6) After clicking on create a new item. You will see a form. You need to fill that form with the information including.
Title
Subtitle
A short Description
And Add File. I am going to add fill the form to list my art. The same art used in this article thumnail.
7) If you scroll down, You will see this option:
Transfer copyright when purchased: Tick the box if you like buyer to give the copyright. Rightnow, I am unticking this.
8) Now, you need to set the price of the ART. Be sure to add the price more ethna the gas fee. You can either make :
Fixed Price or
Make a Auction
9) Now click on List this item and BOOM, your NFT is now listed and is on sale. You will need to sign in one transaction. Just click on sign-in. IT won't cost any gas fee or Ethereum.
You can view this item and get all contract details about it and also boost the item incase if you like to promote it.
You can buy the NFT that I have created incase you like it. The direct link to buy is here:
**https://mintable.app/art/item/Create-FREE-NFT-ART-Thumbnail-art/_m6SI6I79eEJGR6**
Thanks for Reading!
My other article: You may like to Check:
Create NFT for 0$, No coding-**https://read.cash/@Ridam/create-and-sell-nft-for-free-0-fee-no-coding-7bf90b6e**
WHY BITCOIN CASH IS SUPERIOR TO BTC?= https://read.cash/@Ridam/why-bitcoin-cash-is-superior-to-bitcoin-85573ba6
Crypto Trading Explained from 0-Hero=**https://read.cash/@Ridam/crypto-trading-technical-analysis-explained-from-zero-to-hero-d80da221**
My Bitcoin Cash Trading Strategy=**https://read.cash/@Ridam/my-bitcoincash-trading-strategy-630dab37**
ETH Blockchain, TRON Blockchain, BSC Chain?
BLOCKCHAIN is the word that you may be hearing for a long period of time if you are into the crypto field or love cryptocurrency. In this article, I would explain the meaning of the Blockchain and what different blockchains like Ethereum, Tron, or BSC all about?
**BLOCKCHAIN:**
Blockchain refers to the interconnection of the chain in which each of the chains is interlinked to each other and is dependent on each one. The change in one of the chains would make a change in all of the others.
SIMPLE EXPLANATION:
Blockchain has different files. And new files keep adding. If 1 is the first file and 2 is the second file, then the information will be added the file 1. After it is filled, then the information in the file would be linked to file 2. And new information will start to be added in file 2. This way the new file would be added and every file would be linked to the previous one. And the copy of this file would be saved in the storage of all the people connected to the network and it will be public. So, that if anyone tries to manipulate the information it won't be validated in the network.
EXPLANATION FROM A TECHNICAL PERSPECTIVE:
Blockchain is a combination of blocks. The Block is the pages where the transactions and all the records are recorded. There is a delay between the blocks before new blocks get generated, the delay varies according to the blockchain. The Blocks are interlinked to each other so if one block is tempered, it would be invalid because that tempered would need to happen in all other participants of the network. For storing data in the blockchain, the following process happens:
A transaction is requested from the client using the private keys.
The transaction along with others gets added to the Block(Unverified).
All of the nodes receive the block.
The first one to solve the block will receive the reward.
The node will verify the transactions according to the previous block and send that to all around the network.
All other node saves that transaction
And the cycle keeps repeating.
**ETHEREUM BLOCKCHAIN:**
Bitcoin was previously with us but there were many limitations within it. For overcoming that, Ethereum was developed with many more advanced features than the Bitcoin Blockchain. The major ones are speed and smart contracts. The Ethereum supports nearly 30 TPS over the old school Bitcoin supporting only 7 TPS at max. Smart contract was new to the entire Blockchain and decentralized ecosystem when it was deployed in the ETH Blockchain. Ethereum enables the Blockchain to be used for D-APS using the smart contracts for the institution becomes easier and efficient because of this.
Obviously, I wouldn't talk about how to deploy smart contracts here but in the nutshell, Ethereum was a game-changer.
**TRON BLOCKCHAIN:**
In the beginning, Vitalik used to be the one who talks about the limitation of the BITCOIN as the high gas fee for the transaction. But, later the same thing s start happening with the ETH as ethereum starts becoming more and more congested. Considering the issue, Justin Sun starts working on his own Blockchain and the TRON Blockchain started to come to play.
TRON is now working on the POS mechanisms and which are much more energy-efficient and faster with more secure than the ETH AND BITCOIN which are still in the POW mechanism. Yes, they secured but POS seems to be the new mechanism where everyone is headed for now. TRON has now 27 super representative and they validate the transaction, which are chosen every 6 hours. The new blocks are generated every 3 sec so the network supports a huge number of transactions. The TPS of the Tron Blockchain is 2,000 which is really much faster and as it works on the POS, it is way more energy effiecient.
****BINANCE SMART CHAIN:****
After all of the Blockchains, The Crypto-giant Binance gets started into the Blockchain smart contract with the entry of BINANCE SMART CHAIN. The BSC uses another model of POS known as the POSA(Proof of Stake Authority). In this mechanism, the user stakes the BNB to become the validators and receives the fee as the block rewards. The block time is similar to the TRX i.e. 3S which makes it able to compete in the era of faster and scalable Blockchain.
With supporting Smart Contract ability, most of the ETH projects have shifted to the BSC Chain which makes it more usable because of the low gas fee right now. Also, the coins are burned occasionally from the TEAM which makes it a deflationary asset for holders and long-term holders.
There are other many Blockchains out there and ETH competitors. ADA, SOLANA are a few. I would be making more articles about them in a coming post.
IF YOU STAYED UNTIL HERE, THANK YOU!
My other article: You may like to Check:
Create NFT for 0$, No coding-**https://read.cash/@Ridam/create-and-sell-nft-for-free-0-fee-no-coding-7bf90b6e**
WHY BITCOIN CASH IS SUPERIOR TO BTC?= https://read.cash/@Ridam/why-bitcoin-cash-is-superior-to-bitcoin-85573ba6
Crypto Trading Explained from 0-Hero=**https://read.cash/@Ridam/crypto-trading-technical-analysis-explained-from-zero-to-hero-d80da221**
My Bitcoin Cash Trading Strategy=**https://read.cash/@Ridam/my-bitcoincash-trading-strategy-630dab37**
Crypto Trading – Technical Analysis Explained from Zero to Hero
**Crypto Trading-**
The most fascinated word used in the Internet and the way through which people are making millions in one side, whereas people are losing millions in another side. I would be covering the losses and the way to be safe from them incoming article. In this article, I would be talking about crypto trading and all the bases you need to know before jumping into putting your money on the table.
There are ways you can take your position. Looking at the fundamentals and looking at the Technical. Fundamental Analysis (FA) is done on the basis of the overall performance of the company their commitment to the future and past deeds. Whereas Technical Analysis is based purely on the projection of the future price action by considering the past price action of the assets.
I am using the word Projection because there is a need for certain things to play for it to happen. We can take it as the equation inn which if A and B gets true C would be the result or otherwise D would be the result. In Technical analysis we have to play with uncertainty so for the uncertain events we have to be prepared earlier.
***The contents of this article would be the following. If you like to jump into that part, you can just scroll and learn what exactly you want to learn.***
CHARTS AND THEIR TYPES
CANDLESTICK CHART
PLATFORMS FOR GETTING STARTED
CANDLESTICK INTRO
HOW TO READ CHARTS?
TIME FRAMES FOR CANDLES
SUPPORT, RESISTANCE, AND TREND
MARKET CYCLES, AND GREED AND FEAR INDEX
INDICATORS
CHART PATTERNS
OUTRO
FEW RUDIMENTARY TIPS BEFORE GETTING STARTED:
Technical analysis can only be used to project the market. There is no 100% certainty for determining the next market move. We can only project not predict.
There is no perfect model for determining the market cycles because every cycle is dynamic in itself and varies from the previous one.
There is no perfect trade, every trade is a lesson in itself.
**CHARTS AND THEIR TYPES:**
The chart is the representation of the data in the form of the different axis. Charts make the easy way for us to watch the price action of assets over a long period of time or in a short time frame. Just like in other sectors, In trading charts are used and they are the most important thing that traders look into before making any financial decisions either going for long or short. There are many types of charts. I would be covering them below:
Line Chart:
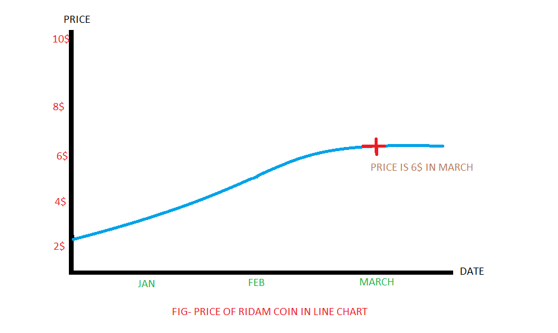
The line chart is one of the most used charts in almost every sector. The data is presented in the form of two-axis so it is pretty easier for the readers to get the idea of the price action. In this chart, the price of assets is plotted overtime the period and the dots are joined at last to form the line. You can get the idea of the chart from the below image:
There are other many types of charts But I would be covering only the name of them so that we could jump directly into the leader of them all, The candlestick Chart. If you are interested to know more about them, I would be making a whole new article covering how to read these charts in specific.
Heikin Ashi Chart
Area Chart
Hollow Candles Chart
Renko Chart
Line Break Chart
Range Chart
**MOST USED CHARTS AND IT’S BACKGROUND:(CANDLESTICK CHART)**
This is the chart that is used by millions of traders across the border and it is one of the most desired ones for hundreds of years. The candlestick chart was developed by one of the rice traders in Japan named “ Munehisa Homma ”in the 18th century. Later Steve Nison introduced the concepts of the modern candlestick chart. The reason for calling them candlestick charts is that they look like candles and the wick is similar to that one of the candles or a stick whatever you named it. I would discuss more how to read them and follow in the following paragraphs.
**PLATFORMS FOR GETTING THE CHARTS:**
The most famous and most used platform for charts all around the world is TRADINGVIEW. The website is this: https://www.tradingview.com/
The website is completely free and allows you to use up to 3 indicators for free which would be more than enough and you can also add the VOLUME indicator within it. I would be described in detail the indicators in coming portion so stay tight with me. For getting started, just create the account on the website and start visiting charts.
There is one more platform that provides the data or candlestick chart. It is an mt4 application that you can use on your windows or mac. But it is old school. So, it is better for you to use the trading view as it doesn’t need any work to do.
*From here I would be describing all the patterns and the indicators along with this chart in the platform named TRADINGVIEW.*
**CANDLESTICKS CHART INTRO:**
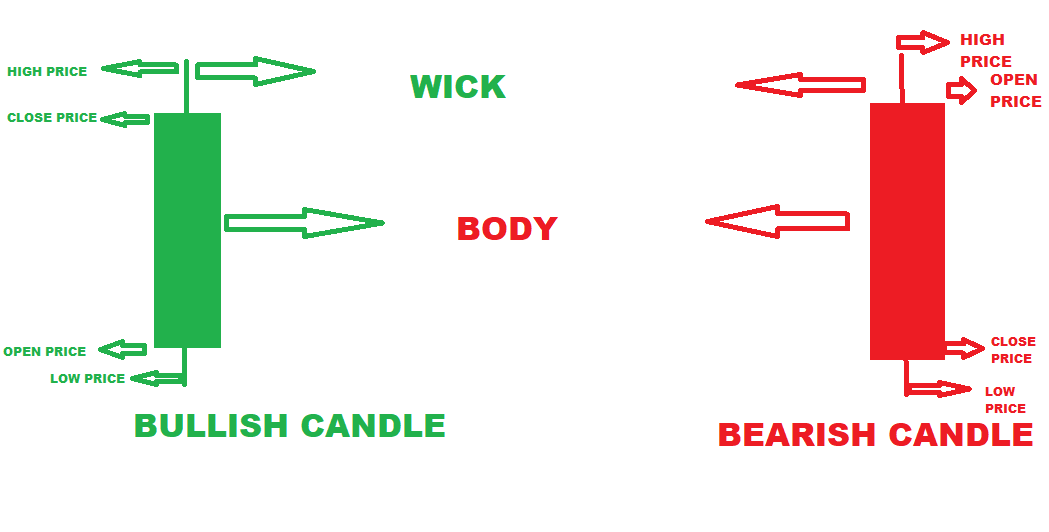
The candles that you are seeing above represent the price of an asset in the certain time frame. You can choose the time frame to view the charts accordingly in the trading view.
BODY- Body refers to the part of the candle from the opening price of an asset to its closing price.
WICK- WICK refers to the price of an asset from its closing price to the high and lowest price to the opening price (For Bullish Candle). This is vice versa for the bearish candle.
BULLISH CANDLE- A candle is known as the BULLISH CANDLE if the opening price of the candle is higher than the closing candle as you can see in the first green picture above.
BEARISH CANDLE- BEARISH CANDLE occurs when the opening price of the candle is lower than the closing price as you can see in the second red picture above.
OPEN PRICE- It is the price at which the market opens in a certain time frame.
CLOSE PRICE- It is the price at which the market closes in a certain time frame.
HIGH PRICE- It is the price that an asset has reached highest in a certain time frame.
LOW PRICE- It is the price that an asset has reached lowest in a certain time frame.
**HOW TO READ THE CANDLESTICK CHART?**
The above candlestick is the price of BTC in a weekly time frame. The opening price of the candle is 32883.38 and in that week the price drops below 27800.00, and then recovered back to the high of 42054.58 and closes at 37965.85. This way one candlestick provides many factual data in an easy way. Don’t get overwhelmed by this right now, you would get used to it once you start starring at charts for like hours and hours.
**TIME FRAMES OF CANDLES:**
I have seen many of the new traders get confused while looking at the price of the asset. They don’t know which time frame they should look into. The answer to this question is pretty simple. If you are scalping then you would be looking into the 15min time frame and 5minute time frame. And for the bigger picture, you would be looking for the 4-hour time frame or 1-hour time frame. The time frame at which you are trading gives you the price action whereas the bigger time frame gives you an understanding of the market trend and the cycles.
If you invest in the coin for the long term, then there is no point for you to watch into the hourly or daily charts. You can look into the weekly or monthly chart which would give you the price action needed for you to look into.
**FEW TERMS TO LEARN BEFORE GETTING STARTED:**
SUPPORT AND RESISTANCE:
Support and resistance are the most rudimentary terms in the crypto market. If you are in the crypto market. I guess you have heard them before because in every market you would hear them millions of times.
SUPPORT: It is the certain price point from which the price of an asset has bounced upwards once it had reached that. A horizontal line can be the support or the trendline can be the support. I would describe the trendline in the following topic.
RESISTANCE: It is the certain price point from which the price of an asset has rejected downwards wards once it had reached that. A horizontal line or a trendline could act as the resistance.
They are also known as the KEY LEVELS because once the price comes to this level it had always acted either in an upward direction or in a downward direction.
REMEMBER, If the 40K$ price is acting as resistance for the BITCOIN, the price would find difficulty in crossing that level. BUT if the price touched that level several times, then we may see that resistance turning into support and vice versa. This is because I would like to refer to these levels as key levels instead of support and resistance. You can look into the image below for the best illustrations:
You can look here, the yellow line which has acted as resistance several times turned into the support after it touches that level many times. And the price breakout was really good.
TREND:
Trend refers to the channel in which the price of an asset is going and the price action is respecting the channel. If we are into the BULLISH trend, we are headed upwards and if the trend is BEARISH then the price would be headed in the down direction and respect the channel. In the below picture, you can clearly see the illustration.
In this picture, you can clearly see the trend is bullish. The price is respecting the trendline and is continuously bouncing once it is hitting the trendline. In the BULLISH trend, the trendline acts as support.
In this picture, you can clearly see the trend is downwards and the price is respecting the trend and the price is rejecting once it is hitting the trend line. In BEARISH TREND, the trendline acts as resistance.
REMEMBER, the trendline will not act as the support or resistance for a lifetime. There would be a time in which the price of an asset will break out of the trendline and we call it the breakout.
MARKET CYCLES:
Market cycles refer to the price action for the coin in the bigger picture or we can call it the cycles. The cycles may look similar but they aren’t identical so extraction of exact data from one cycle and putting it into another would not be a good idea. But I am seeing most of the so-called crypto traders out on YouTube doing the exact same thing without knowing the market is dynamic. BTC cycle is a typical 4-year cycle and it is initiated by the BTC Halving. (Halving refers to the process by which the supply of BTC coming to market or the reward miners are earning decreased by 50% every 4 years).
BTC cycle has a bull market which is followed by the bear market. I have used the last cycle of 2017 for the demonstration purpose only. It may not be exact, so take it with a grain of salt.
GREED AND FEAR INDEX:
This is the index that determines the sentiments of the people out there in the market. You can watch the index on the website below: https://alternative.me/crypto/fear-and-greed-index/
It would give you diagrammatic information of the market sentiments which you can use to determine either we are in the Euphoria phase or in the disbelief phase. It is more related to market psychology which itself is really a big idea to discuss. I may create more about that in the coming articles if this one gets a good response from the audience. Right now, understand that if everyone is greedy you have to be safe and start exiting in parts because a market phase down is nearer to such an event. And if the market is looking extremely fearful, you have to start accumulating because after such an event there is a strong move ahead.
**INDICATORS:**
Indicators are tools that work on the basis of certain formulas and can be used for various purposes. So that the probability of our decision of uncertainty is increased further and strong information can be extracted out. There are numerous indicators out in the market. I would be covering up the rudimentary and the most used indicators in the market.
HOW TO LOAD INDICATORS IN TRADINGVIEW:
Click on this signal in the toolbar of the trading view. You will see the search tab and you can search the indicators you like on that page. Look at the below image for help.
*Now, I would discuss few indicators, how they work, and what information can we extract for a further move from them.*
VOLUME:
By the name, you are well known to it. Volume is the indicator that shows how much amount of liquidity is at the level. Buy volume and sell volume are presented there. Volume is one of the most important tools to look into while the price is moving. If the volume is in decreasing trend, we can conclude that in the price the asset is reaching, volume is getting pretty low. So, there could be a chance of a reversal. This is the simple theory behind the volume because the price will always be headed to the price where there is most liquidity.
MOVING AVERAGES:
Moving averages are dynamic averages and they are based on the last price of the candles. In simpler words, they are the lines that show the average price. But you can choose the time for which the average is taken. Let me present a formula for better understanding:
*7 Day Moving Averages: On the 8th day of the price, the 7-day moving average of the coin will appear like the average price of the coin in the last 7 days. The formulae for 7-day MA is:*
*7 DAY MA= (Sum of price in last 7 days)/ 7*
Moving averages provides the information for the start of the trend and end of the trend. But it is a lagging indicator because of which they show after the trend is started or ended. For long-term traders, a moving average of a higher time frame is chosen whereas for the short-term trade a moving average of short duration is used. For different assets, the price action respects the different time frame moving average, so you should be able to find out that. Usually, 7 Day moving average is used as support for the short time frame and 5o and 200 MA are used for the mid and long term.
If the price is taking support from the moving average, it would bounce once it touches that Moving average but we should remember that if the support may turn into resistance at any time and we should exit accordingly. Now, the most common trend indicator is the crossover of the moving average or what we call the GOLDEN CROSS AND DEATH CROSS.
GOLDEN CROSS: When the short time frame MOVING AVERAGE crosses the long-time frame MOVING AVERAGE, then we call it usually the GOLDEN CROSS. This is considered as the Bullish for the asset and it plays most of the time in the market.
DEATH CROSS: When the long-time frame MOVING AVERAGE crosses the short time frame MOVING AVERAGE then we call it DEATH CROSS. The death cross is a bearish signal and we have to exit or be prepared once it formed in the chart.
EMA:
The concept of the exponential moving average is similar to the Moving average in most of the terms. The only difference is EMA calculates the data which is more relevant to the recent price than completely relying on older data like moving average. The most famous EMA are 50 and 200 Period EMA. You can play with it like MA for mastering it.
RSI(Relative Strength INDEX):
This is one of my favorite indicators. The reason is I use it in most of my trade sections, you will know why in the following text.
RSI is defined as the indicator that shows the price is undervalued or overpriced. The typical RSI ranges from 0-100. Basically, if the RSI is more than 70, the asset is known as overpriced. Some traders take it as 80, but it’s upon you to look from which the price is resisting. If the price is below 30, the asset is known as undervalued. Few traders take it as the 20, so you have to look for the point from which the price is bouncing back.
RSI Divergence:
Bullish Divergence:
If the price is decreasing and, the RSI is in an uptrend then there is the possibility of price breaking in the UPWARDS direction.
BEARISH DIVERGENCE:
If the price is increasing and the RSI is in a down trend, then there is a possibility of price breaking in DOWNWARDS direction.
*There are other many indicators but it is not possible to describe them all here. If you would like to hear me about other of them then, you can comment on the name I would cover them in detail incoming post.*
**CHART PATTERNS:**
There are many chart patterns but I would cover the most famous and most appearing chart patterns as below. Chart patterns are those patterns that appear in the candlestick and the breakout is possible from them. I am going to cover a few in short. I know the post is becoming very long but it is required to learn most as your money would be down on the table while trading.
ASCENDING TRIANGLE: This pattern form when the price is rising and it forms like the ascending triangle. The upper portion of the candles forms like the straight line of the triangle whereas the lower portion of the candles is rising.
DESCENDING TRIANGLE: This pattern forms when the price is in a downtrend and it forms like the descending triangle. The lower portion of the candles forms like the straight line of the triangle whereas the upper portion of the candles is in a downtrend.
SYMMETRICAL TRIANGLE: This pattern forms when the price is forming the symmetrical triangle-like pattern. In the chart, the candles in the upper portion would run in downtrend and the candles in the down portion would run in the up-trend.
BREAKOUT OF THE TRIANGLE:
If the candles broke out of any of the triangles, then we would see a candle going out of the triangle and we would wait for few more candles to re-test the lower or upper portion of the triangle and the breakout would be confirmed. If it happens below the triangle, it would go in a strong downtrend. Whereas if the price breaks up, then the price would go in strong up-trend.
Target: The target is usually be taken by measuring the length of the mouth or open of the triangle. If there is another strong resistance, a small accumulation may be seen on that level.
IMPORTANT THINGS TO TAKE CARE OF AFTER READING THIS:
*Did this reading have made you a perfect trader? Absolutely no, this is the basic stuff of the TA you have to take care of before getting started.*
*What should I do afterward to become a good trader?*
Start Applying these things to the real-world price of the coin you like to trade on and start making projections without placing any real trades. Focus on more and more things every day and be efficient in one of the strategies. If you feel efficient in one of them, then you can start trading and apply your knowledge to the real trades.
*THIS ARTICLE HAD TAKEN A LOT OF TIME, EFFORT, AND RESEARCH FOR THE COMPLETION. I WOULD APPRECIATE ANY GOOD RESPONSE AND I WILL TRY TO REPLY TO YOUR QUESTION OR DOUBT IF YOU HAVE ANY.*
***THANK YOU!***
My other article: You may like to Check:
Create NFT for 0$, No coding-**https://read.cash/@Ridam/create-and-sell-nft-for-free-0-fee-no-coding-7bf90b6e**
WHY BITCOIN CASH IS SUPERIOR TO BTC?= https://read.cash/@Ridam/why-bitcoin-cash-is-superior-to-bitcoin-85573ba6
Crypto Trading Explained from 0-Hero=**https://read.cash/@Ridam/crypto-trading-technical-analysis-explained-from-zero-to-hero-d80da221**
My Bitcoin Cash Trading Strategy=**https://read.cash/@Ridam/my-bitcoincash-trading-strategy-630dab37**
My BITCOINCASH Trading Strategy
Bitcoin Cash:
Bitcoin cash is the fork of Bitcoin in case If you aren’t aware of it. The coin has been one of the leading coins in the crypto market with a motto of P2P E-Cash.
Current Market Situation:
Before looking for any altcoins, we have to look at the BTC Position. I see many of the people were panicking during yesterday's market correction. Yes, it is nothing more than the correction and Btc has already been in a good position coming back to the 52K level and the major thing is the BTC Dominance, total % of Btc Market Cap in the total market cap of the crypto industry, has been falling and it is around 50-55. It clearly refers that people are jumping out their money in the altcoins and shifting their money from the BTC to altcoins. There is a cycle of money flow in the bull market which you can see below:
Bitcoin-- HighCap Alts---MidCap Alts----LowCap Alts
Current Situation Of Bitcoin Cash:
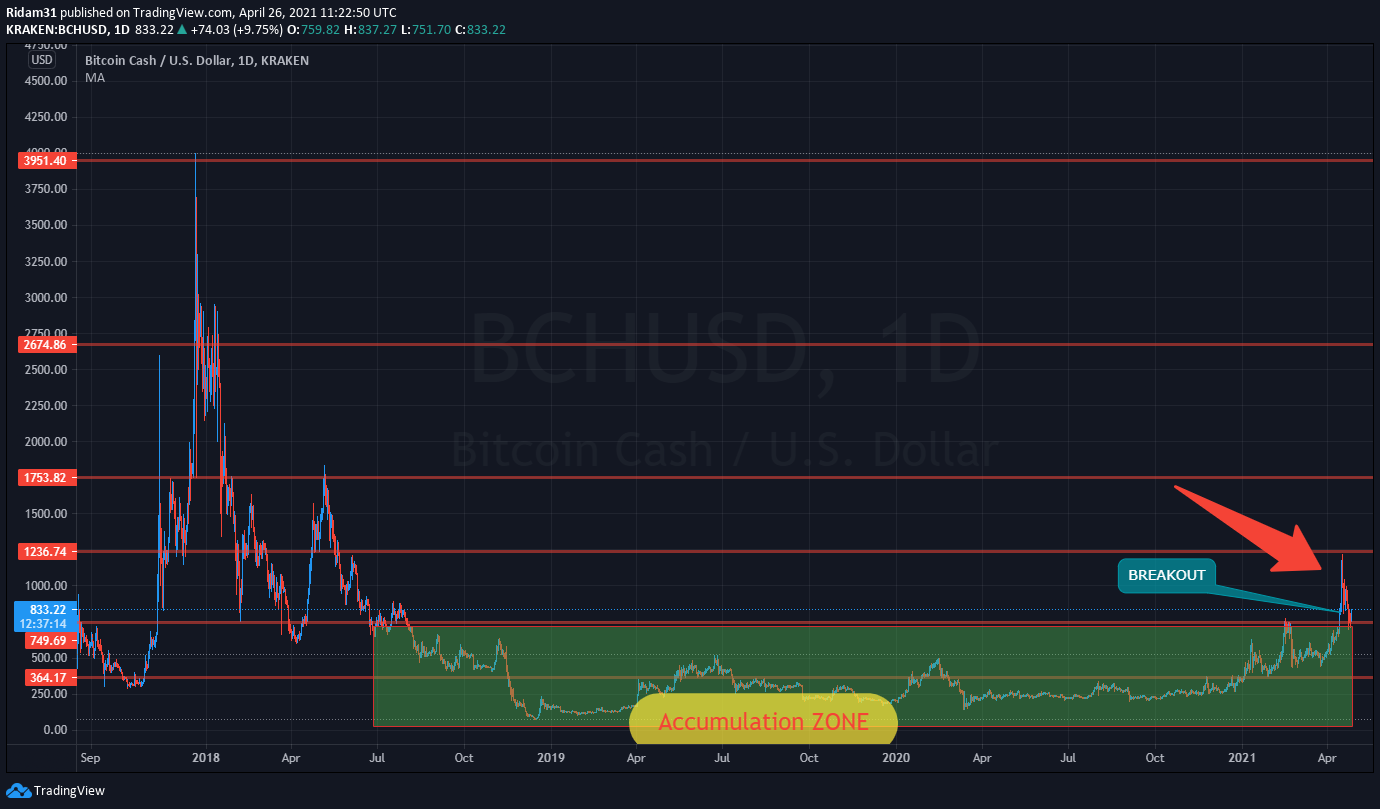
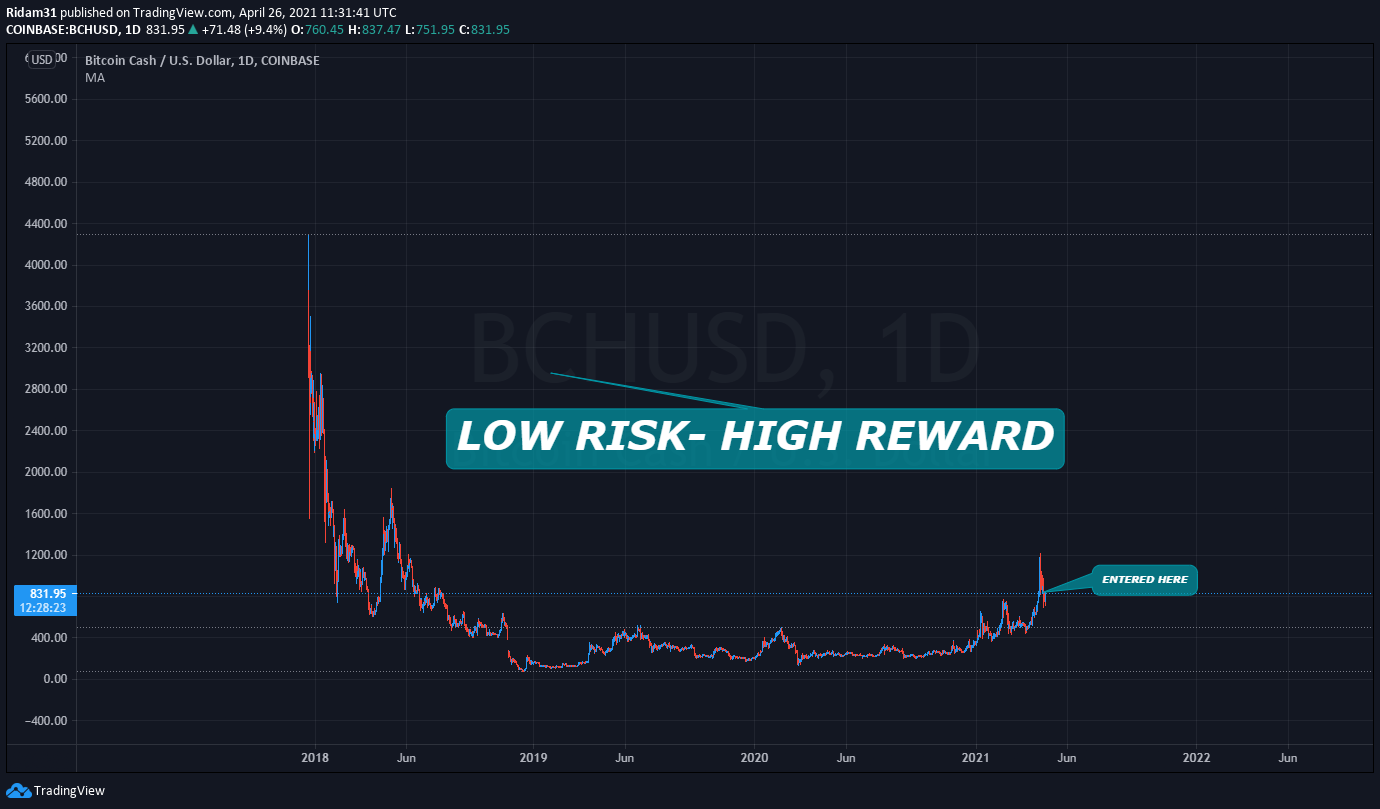
Bitcoin Cash (BCH) has made the ATH of 4000$ in the 2017 Bull market which is insane and all those who have entered the BCH have made an insane amount of profit. If we look at the current price of the BCH, It has already touched the 1200$ and the best thing is that Bitcoin Cash has entered into the bullish zone after being in the accumulation zone for a long period of time which is a great indication of taking our entry for getting the best profit.
Source-https://s3.tradingview.com/snapshots/l/lQh2KYvj.png
Risk VS Reward?
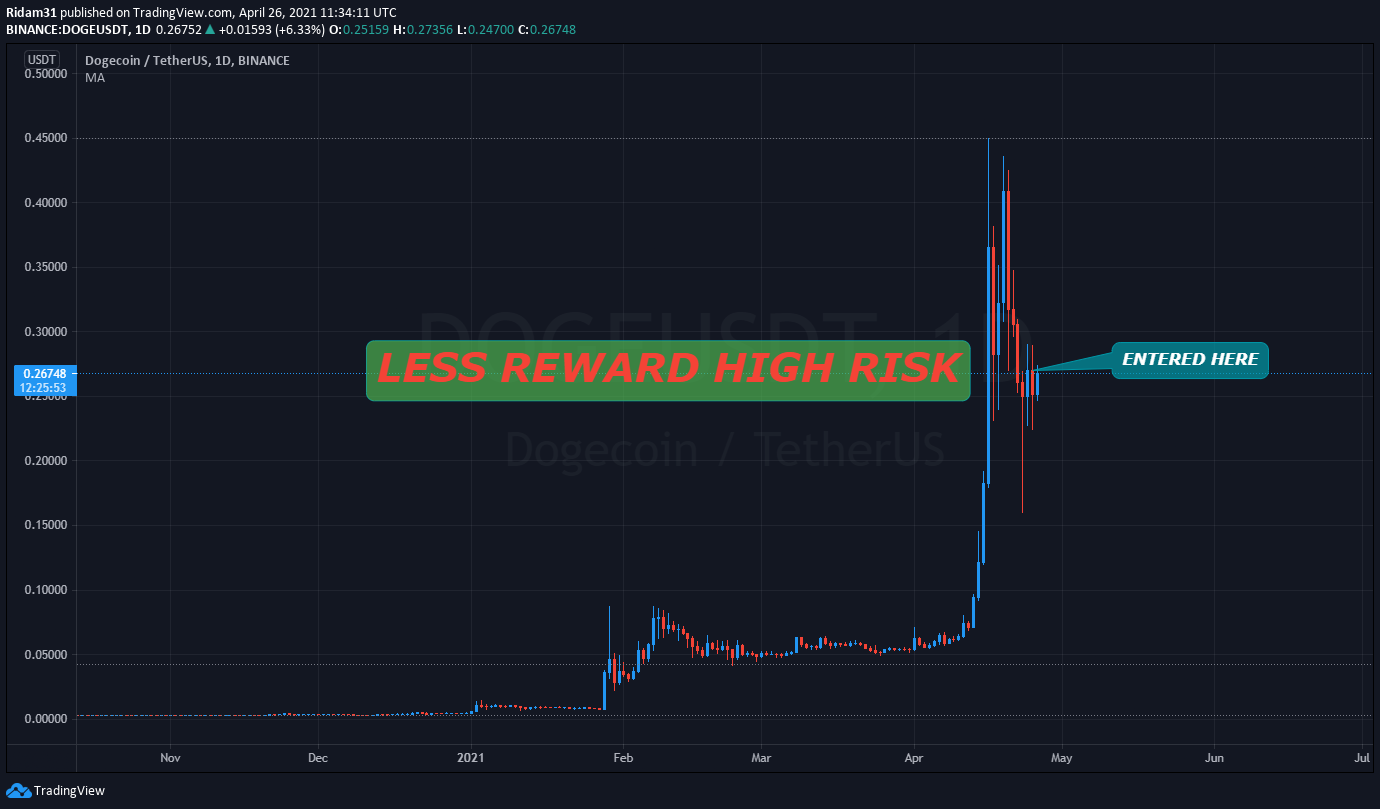
Before taking any position in any trade. The first thing that we should look into is Reward Vs Profit Ratio. Just like the name suggest Reward Vs Profit Ratio means how high the price could go vs how low the price can go in simple language. Also, we can say if we are at the peak level and still the bull market is ongoing then the risk would be much higher and reward would be much lower. You can calculate the same thing using the ratio for ease. The below picture shows the best explanation:
LOW RISK HIGH REWARD
HIGH RISK LOW REWARD
For Bitcoin Cash, we are only 79%% up from the local peak it had made several times in the bear market so we can take that level as the risk. For instance, In October 2018, June 2019, Feb 2020 the Bitcoin cash has made the local peak of 500$ and if we look at the current price 800$-830$ (At the time of the start of creating this post and end), the coin hasn’t made anything bigger like other coins. Even if we touch the ATH, there is a good chance of big profit for holders.
WHY I AM SO BULLISH ON BITCOIN CASH?
Let me present you one by one:
The current price of Bitcoin Cash is nowhere near the ATH of its previous cycle.
After 1000Days of being in the ACCUMULATION ZONE, the price has broken out of the accumulation zone and is further confirmed by a re-test.
Relatively Small Risk and Big Reward Opportunity.
Solid Fundamentals with a great team behind.
Bullish Cross over on MA-50 and MA-14.
Most of the Altcoins, crossing their ATH and the money flow may start any time.
Liquidity is insanely increasing in the overall crypto market.
FOMO in Retail Investors.
BCH/BTC pair has a 1000% Reward with almost no risk at all.
My TARGETS AND PROFIT TAKING STRATEGY?
T1-1700:
It would be the first target because from this level we had seen the resistance last time. And I would be selling only 20% of my total holdings which I had bought earlier in the dip of the bear market with around 600% gain from 300$.
T2-4000:
It would be the second target because we will see a major sell-off at this level being Previous ATH. At this level, I will sell my 30% of total holdings.
By this time, I would have already got my Invested amount return with good profit and I would let my profit rise without any worries about the market direction with the dynamic stop loss.
DISCLAIMER- All the information is my views and I may be completely wrong about this. Please do your own research before taking any financial move.
My other article: You may like to Check:
Create NFT for 0$, No coding-**https://read.cash/@Ridam/create-and-sell-nft-for-free-0-fee-no-coding-7bf90b6e**
WHY BITCOIN CASH IS SUPERIOR TO BTC?= https://read.cash/@Ridam/why-bitcoin-cash-is-superior-to-bitcoin-85573ba6
Crypto Trading Explained from 0-Hero=**https://read.cash/@Ridam/crypto-trading-technical-analysis-explained-from-zero-to-hero-d80da221**
My Bitcoin Cash Trading Strategy=**https://read.cash/@Ridam/my-bitcoincash-trading-strategy-630dab37**
Let's Talk About the DOGE COIN
DOGE:
Either you are monitoring the crypto market for a while or don't care about what's going on in the crypto market. In your journey, you must have heard about the DOGE. I amn't talking about the Dog that you feed Pedigree in your house but the one which is making many people millionaires these days. Yes, the same one Elon Musk Keeps shilling all the time.
Let's Talk about the Fundamentals:
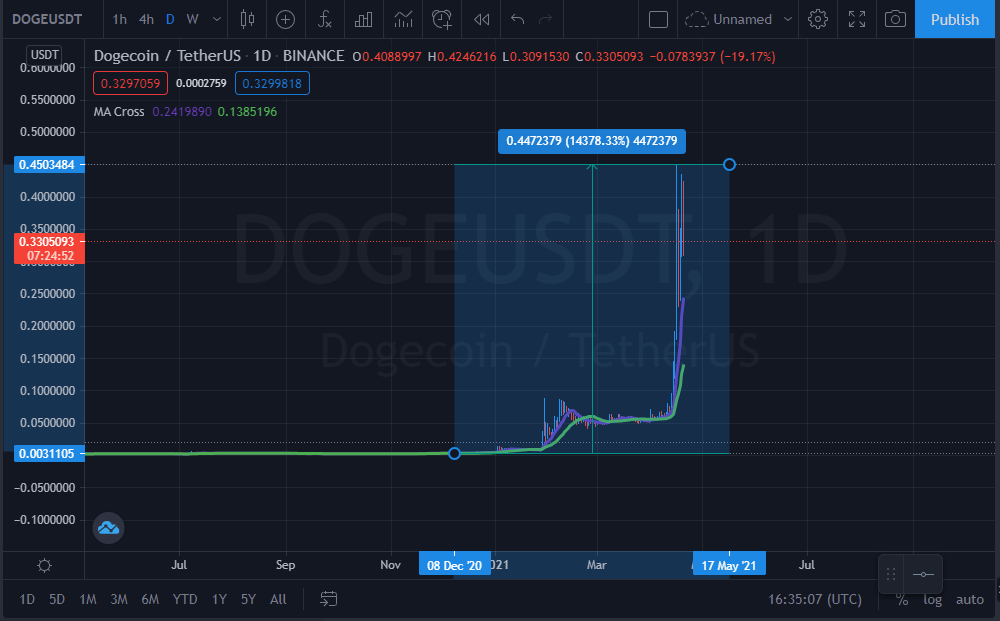
If you have made until this far, then I am sure you know that the DOGE was literally started as a meme coin. This token has a total supply(Units) of 129Billions and the same number of tokens are in circulation in the market. The current price of the token is 33 cents and in the 7 days, it had peaked at 41 Cents. The major thing to take note of is that the price of this Coin was 0.0034$ on December 1st, 2020.
What thing is driving the Doge-Rocket?
Image Direct Link- https://www.tradingview.com/chart/BgijmdkJ/
The image you are seeing is nothing but the chart of Doge/USDT pair and the steady growth seems mind-blowing. I know 14000% Gain in a asset is insane.
There are two factors causing the price of Doge to the moon. The first one is Elon Musk, CEO of TESLA INC.; Founder of PAYPAL; CEO of SpaceX; Co-founder of Neuralink, and many more. And the second factor is also Elon Musk.
Initially, he was giving hints regarding the Doge coin. But the things changed after he literally starts praising about the Doge token or starts shilling, with his tweets and memes, whatever you call it but after that time Doge was hitting one after another ATH breaking the previous one. After that time he is just praising the Doge coin and it was also anticipated that Elon is putting the DOGE coin in his SpaceX project and sending it to the MOON. It's not the moon we usually say when a price of an asset spike, he is sending the coin to the natural satellite of the Earth- the Moon. Elon Musk is fueling Doge by tweeting about Dogecoin and he has millions of followers who get influenced by his tweets and posts.
Is the SPIKE Sustainable?
The real question is how long Dogecoin stay at such peak pumping every month? If we look at the buyer of the Dogecoin, They have their targets and are thinking to sell their bought doge at around certain targets. The only difference is they aren't buying the Doge for any purpose or as a store of value like most of the Cryptocurrencies. People are just buying it because they want quick money and FOMO is hitting them causing the demand to skyrocket. The pump at the doge is looking even more than the parabola and it looks like a straight growth if we just look at the charts which is the bad thing for almost all so-called traders. The market will suffer bear trend and usually, the bear market is shorter and even faster than the bull market. Those who are early to the doge would face no worries, but I am sure many would be at the peak and they would face the most. Also, there are big whales in the doge who would dump their token at any point and this would change everything. Considering no real use cases, big whales holding a big percentage of tokens, people planning selling price before buying the token, and a whole community driven by a Multi-Billionaire Businessman, It is pretty difficult to analyze how bad the end will be. The irony is we are in the decentralized market and Blockchain technology driving the market but here are things completely different.
Effect of DOGE On Other Cryptos?
As you know there are other several projects in which developers are working day night to make the best futility of the coin and make their coin in the top crypto projects but when it comes to the marketcap, all of them, ADA; DOT; LINK; BCH, are lagging behind the Dogecoin. Although the liquidity and popularity of crypto space are increasing, the negative impression if happen in the end it would be just adding the fuel to the fire. And the traditional view of great projects, great development, great teamwork, the great roadmap will lead to the great market cap has become faulty after the Dogecoin massive performance.
So what do you think about the DOGE big performance? Are you happy with such a big performance from a crypto project and what do you think about the end result of doge price?Be sure to make a reply about your thoughts..
DISCLAIMER-
The above-mentioned are my thoughts and maybe faulty from someone else perspective. If you like to comment, you can do it wisely.
Investment is a matter of risk, Be sure to take your decisions on your own relying on your own research. This post should not be considered as a factor affecting your financial decisions either you are long or short.
My other article: You may like to Check:
Create NFT for 0$, No coding-**https://read.cash/@Ridam/create-and-sell-nft-for-free-0-fee-no-coding-7bf90b6e**
WHY BITCOIN CASH IS SUPERIOR TO BTC?= https://read.cash/@Ridam/why-bitcoin-cash-is-superior-to-bitcoin-85573ba6
Crypto Trading Explained from 0-Hero=**https://read.cash/@Ridam/crypto-trading-technical-analysis-explained-from-zero-to-hero-d80da221**
My Bitcoin Cash Trading Strategy=**https://read.cash/@Ridam/my-bitcoincash-trading-strategy-630dab37**
 @Ridam