 @OverThinker
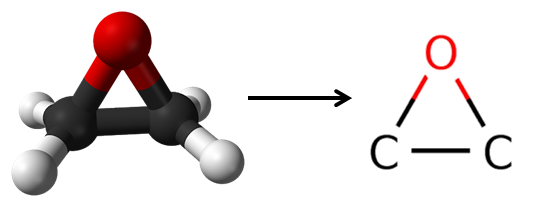
All About Epoxide

+14 more
Joined 7 July 2020 · 160 posts
Let’s make freedom through writing!
120 KT
0 KT · $29.04 received · 0 KT · $9.90 given
@OverThinker
All About Epoxide
+14 more
@OverThinker
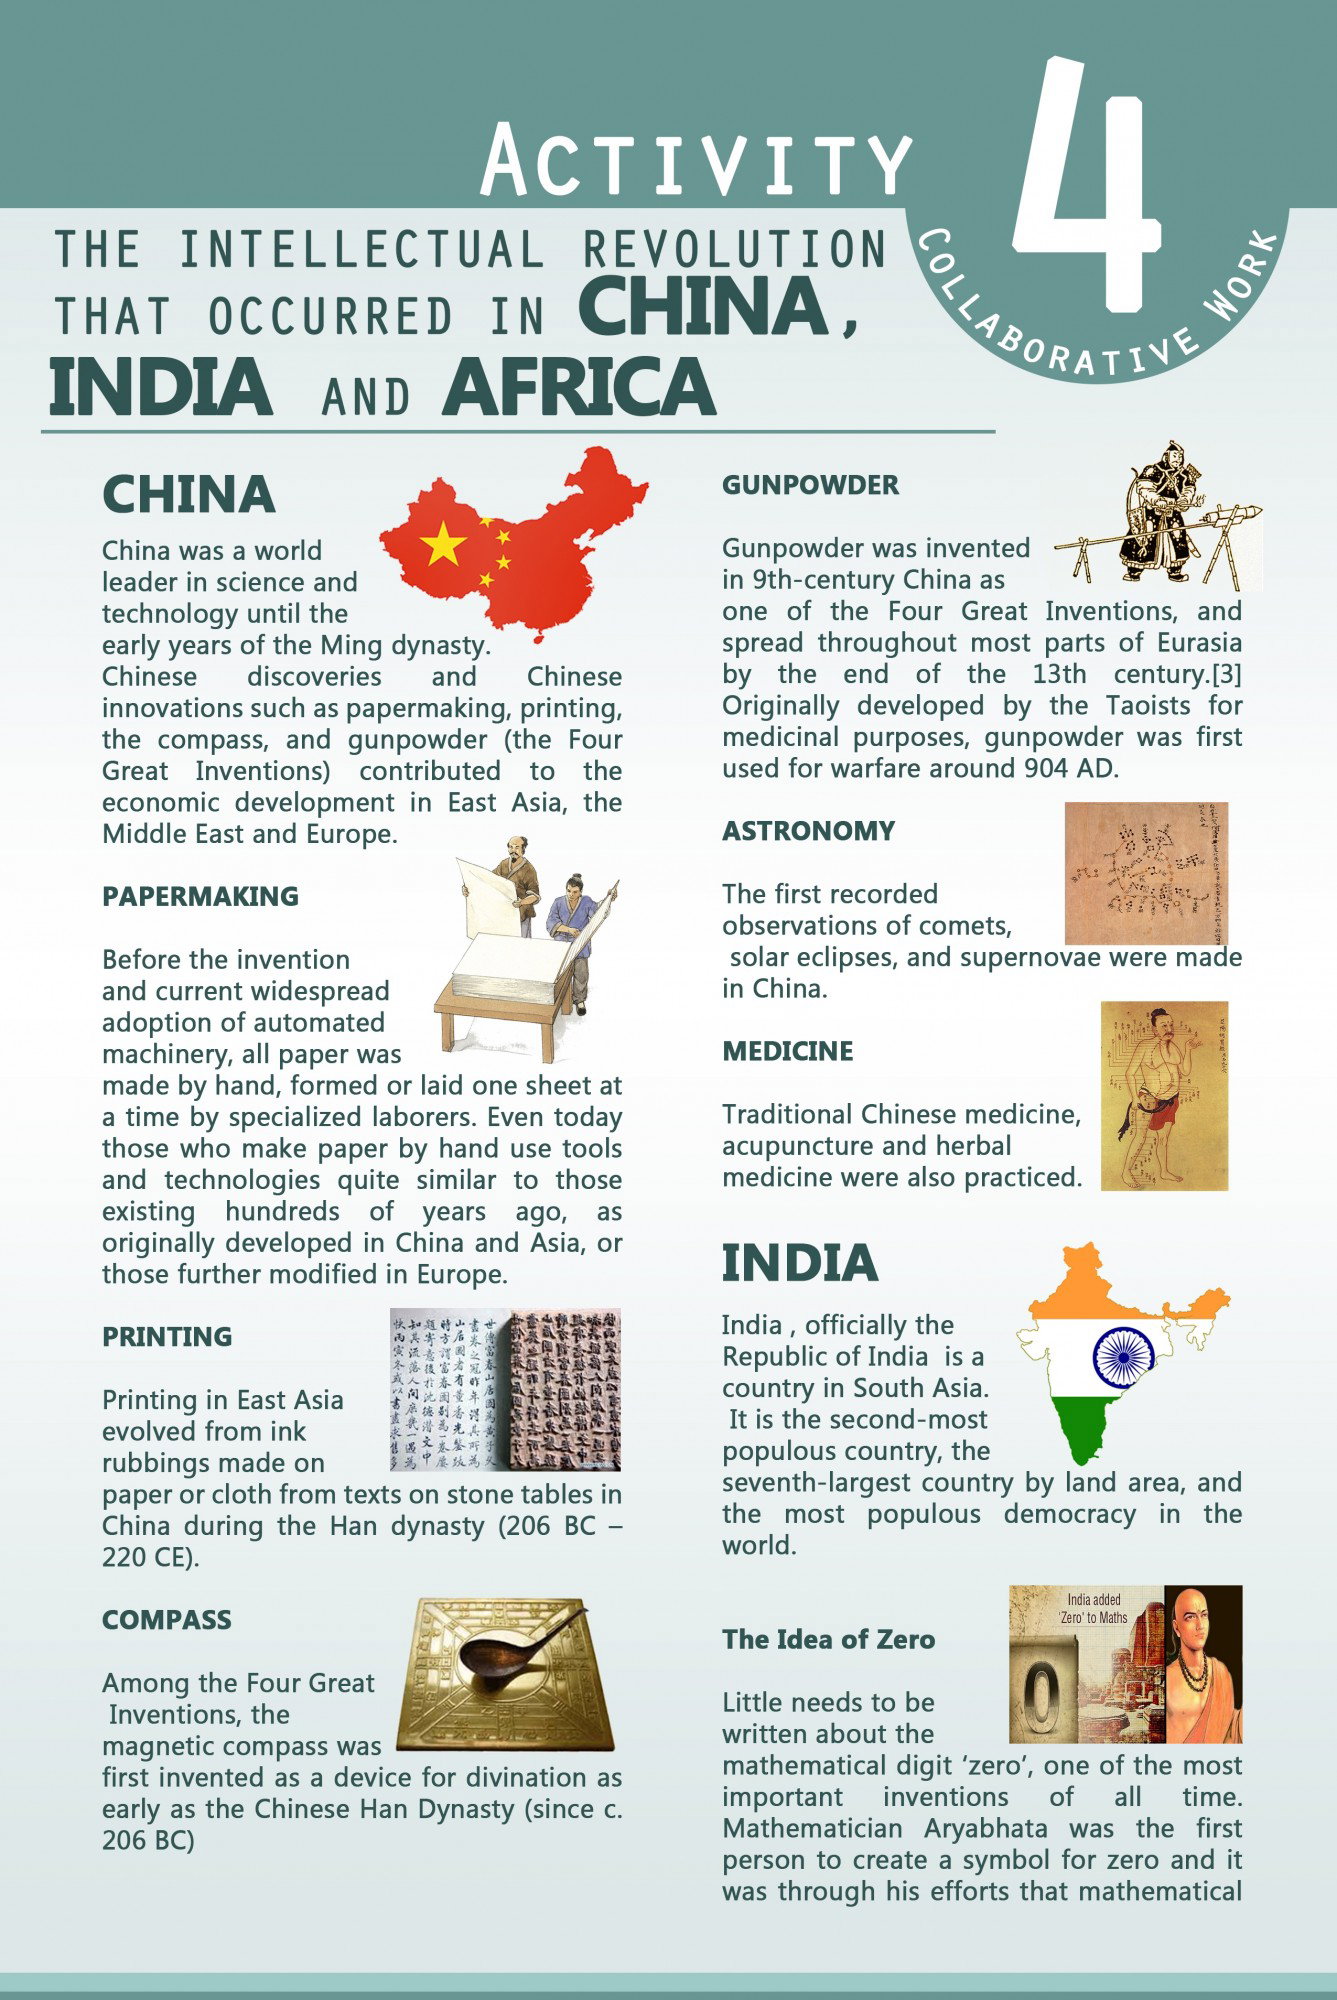
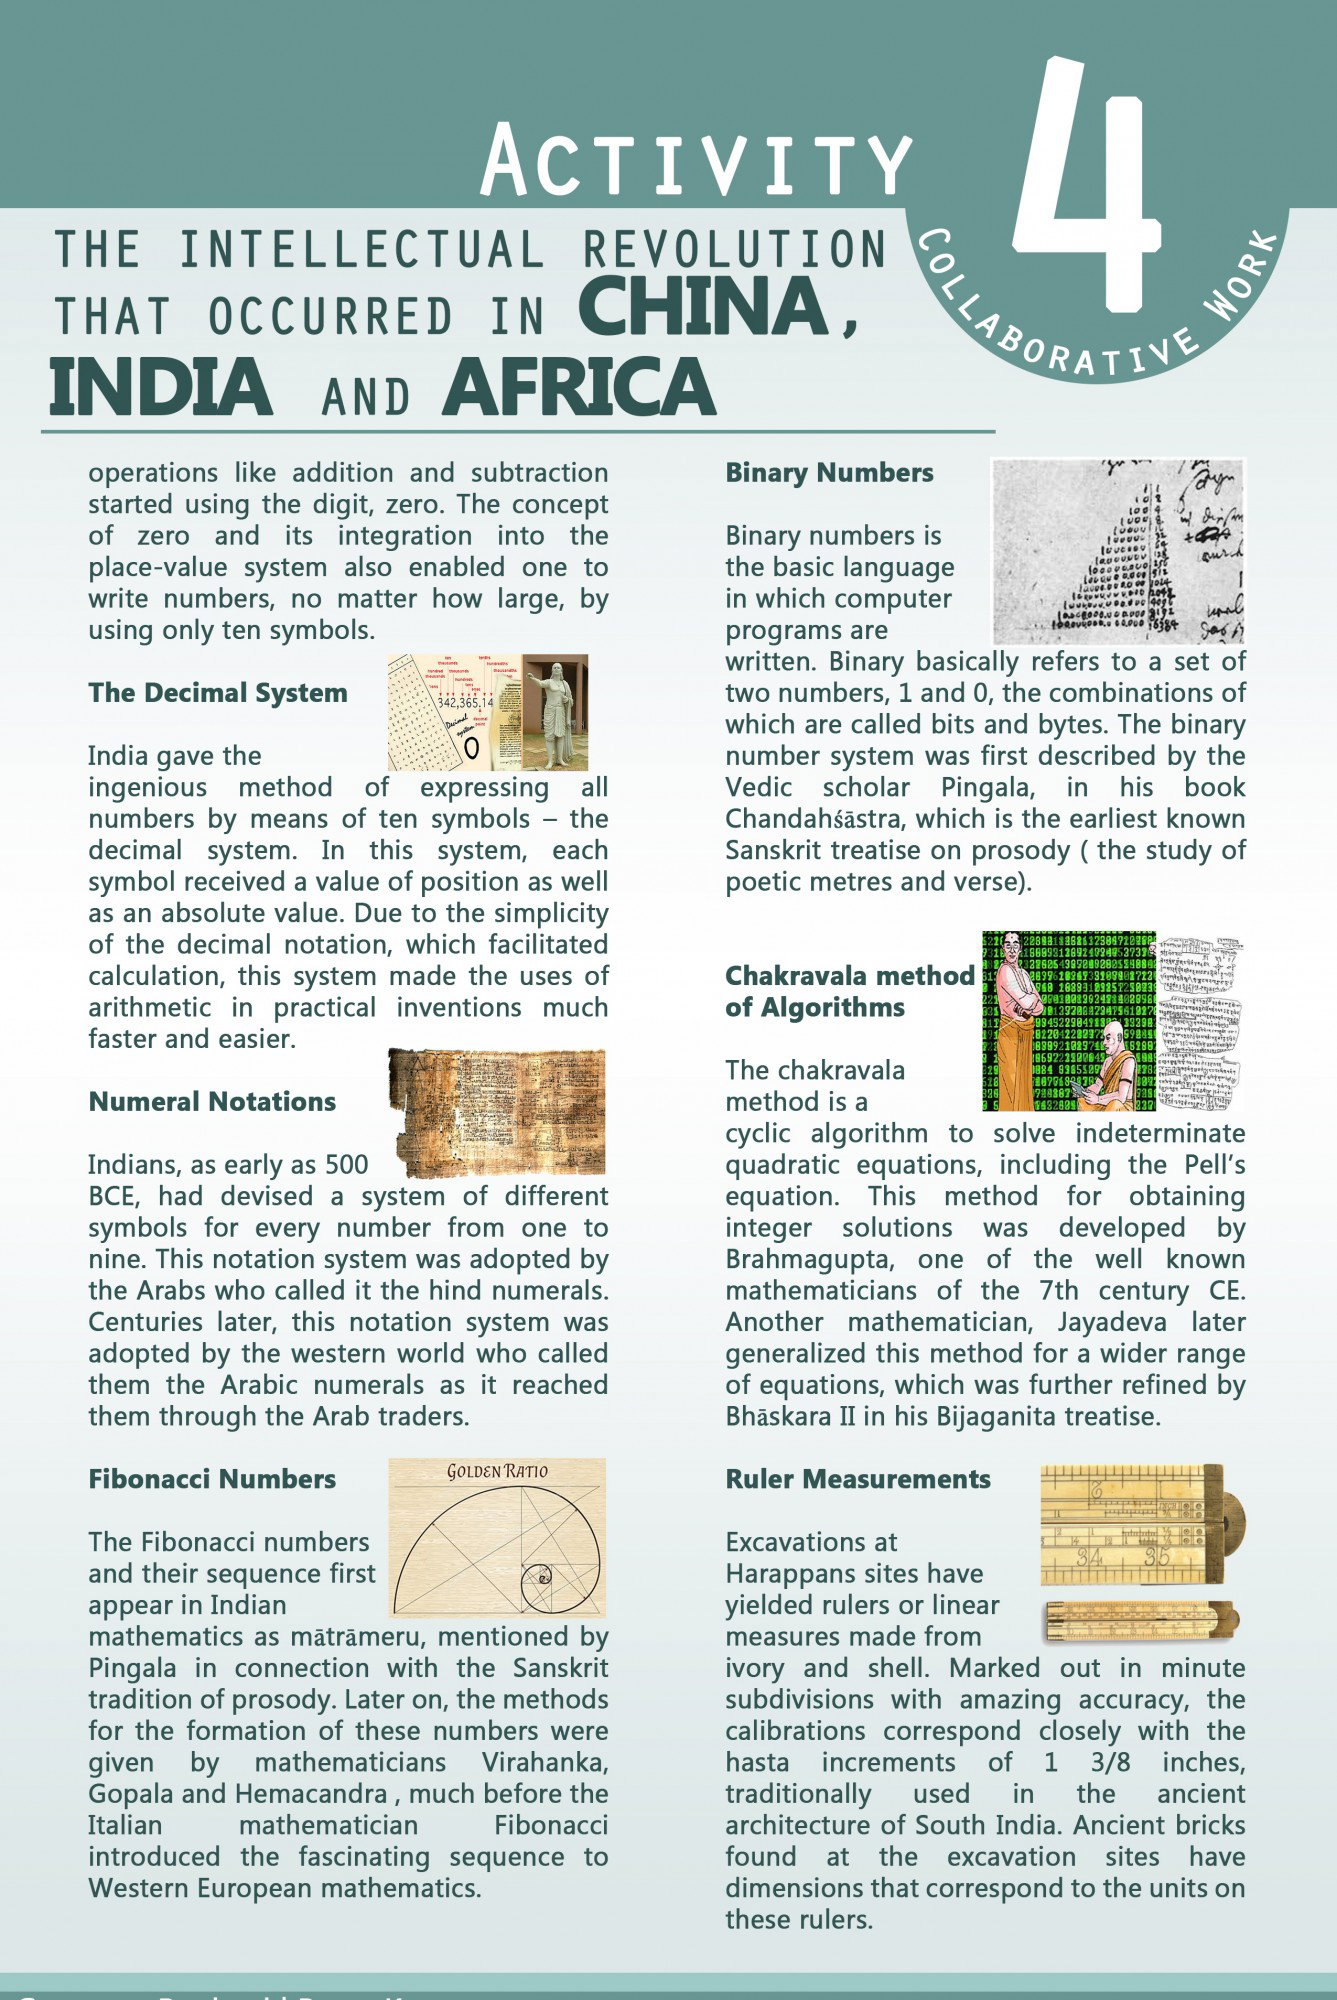
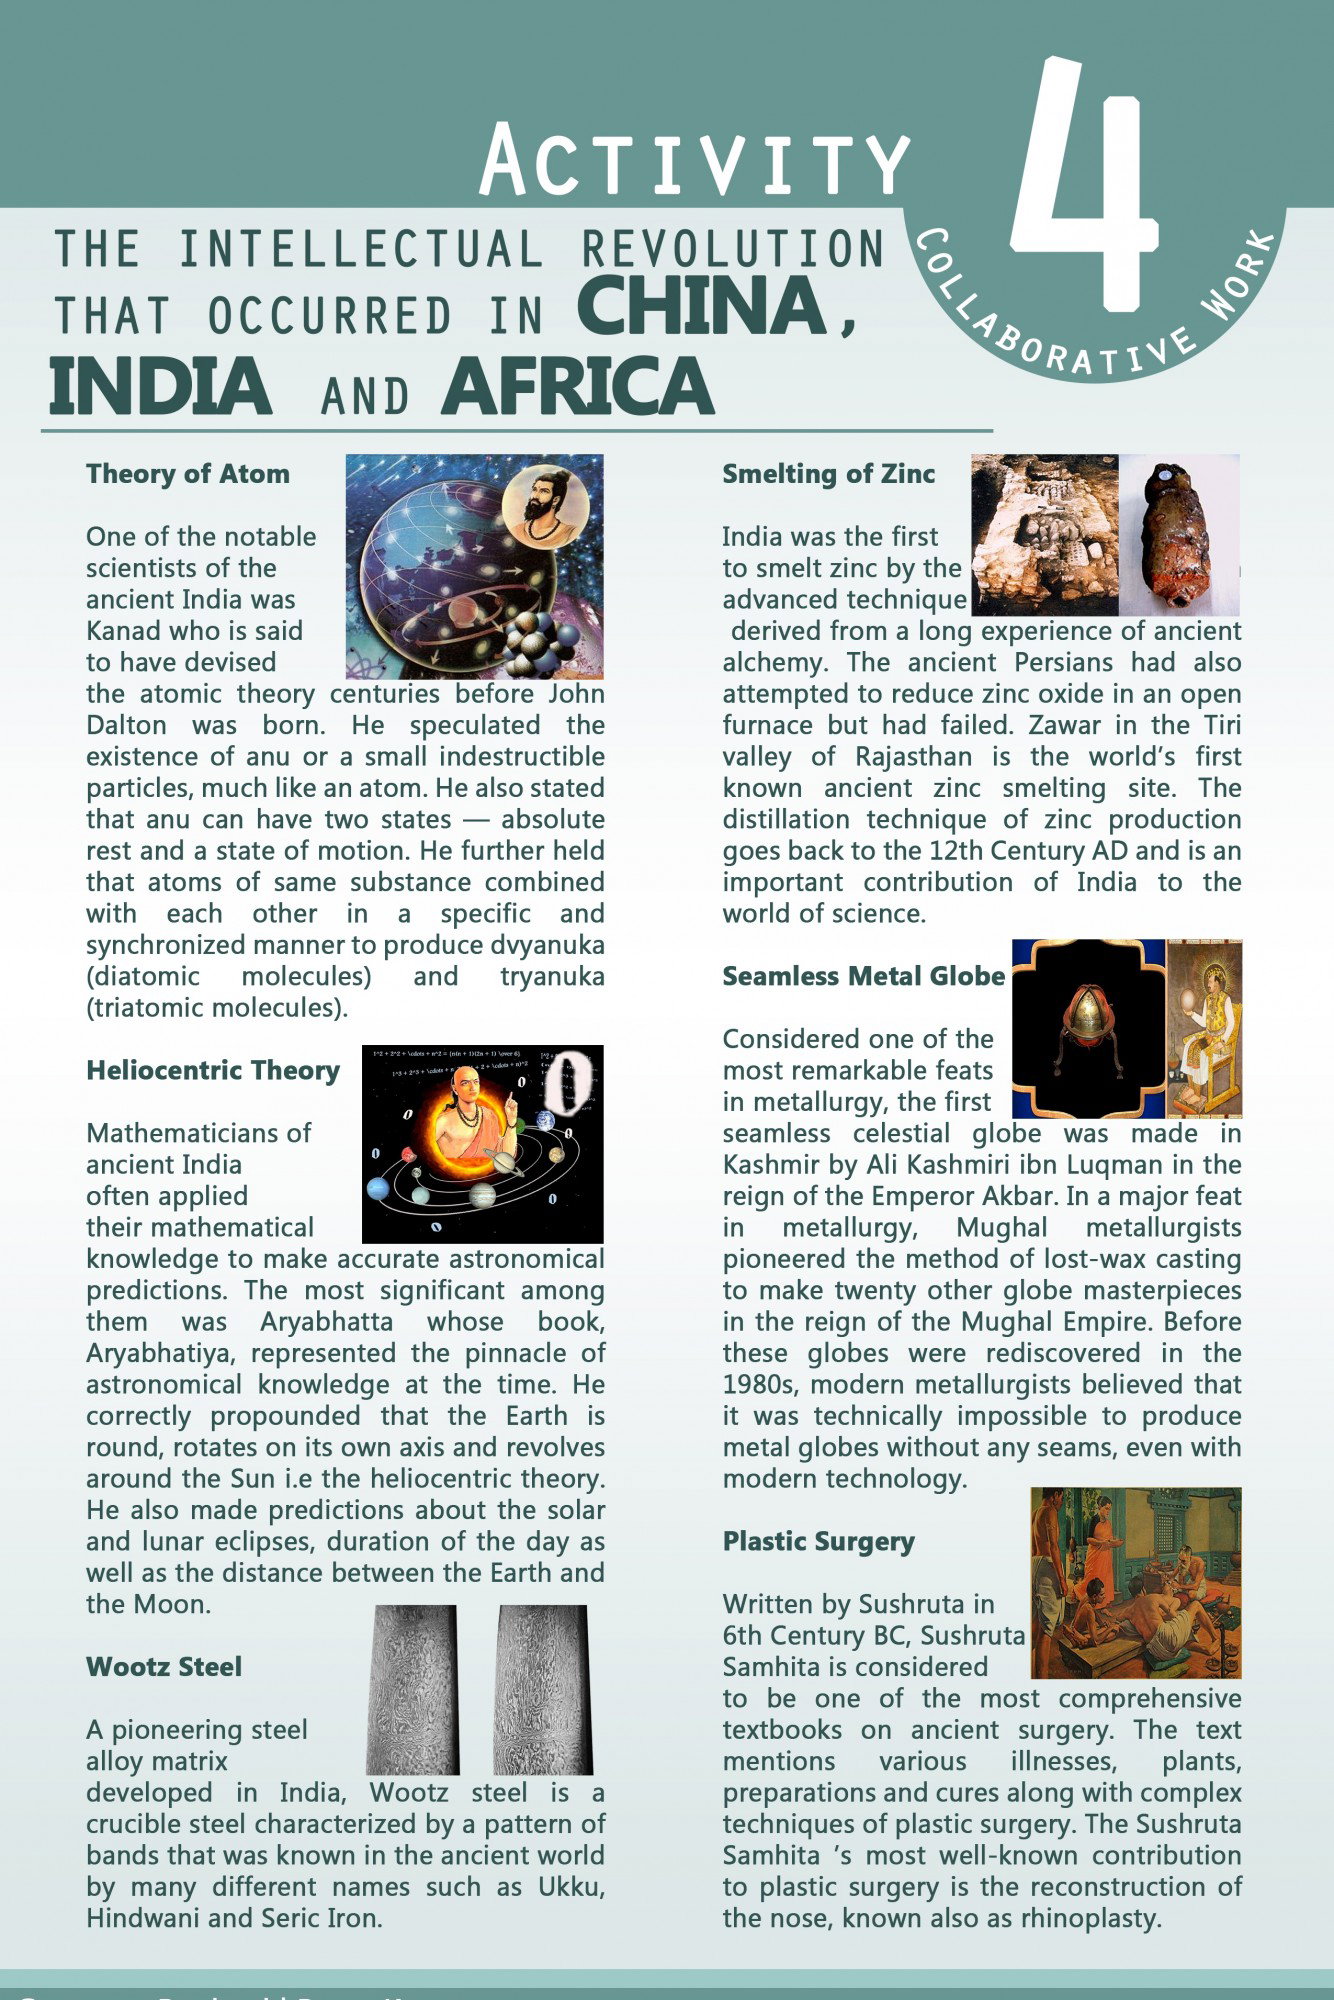
Intellectual Revolutions
+7 more
@OverThinker
Head, Hands and Heart: Arts and Crafts Movement on Society “He who works with his hands is a laborer. He who works with his hands and head is a craftsman. He who works with hands, head and heart is an artist.” It is factual that arts and craft is a significant part of every culture in our society. Arts and craftsmanship emphasizes the natural elegance of the material which expresses freedom and creativity of one’s soul. Freedom of creation do gives off satisfactory for its autonomy, but what if work that has to be done had become a listless enterprise with no other purpose but to create pieces that are called "soulless" for the sake of Industrial Revolution? Would you sought to compromise with the efficiency of machines or the skills of craftsmen? In the 19th-century, Britain established the Arts & Crafts Movement as a protest against the fashion of imaginative sham, over-executive architecture and as an effort to reverse the increasing dehumanization of labour in society. It was based on basic shapes, the truth of materials, and the use of nature as a basis of pattern. Young London architects are influenced by the ideas of John Ruskin and William Morris. The Art Workers' Guild was formed in 1884 to break down walls between architects, authors, and designers. The word 'Arts and Crafts' was first used at the request of the bookbinder T J Cobden-Sanderson, the Arts & Crafts Exhibition Society, founded in 1888. The Arts and Crafts Movement was a revolt of both material and form. Its influence originated from the idea that art and design could transform people's lives. Its strong social and spiritual function has ensured its on-going importance. A variety of guilds and workshops have been set up that have had a long-lasting effect on societies. The central characteristics of the Arts and Crafts movement are the belief in craftsmanship, which emphasizes the natural elegance of the material, the importance of nature as inspiration, and the appreciation of simplicity, usefulness and design. The movement has often promoted reform as part of its philosophy and advanced the idea response to industrialization, if we look at the European whole, it was neither anti- industrial nor anti-modern. Any European factions argued that computers were still important, but they could only be used to alleviate the tedium of mundane, repetitive activities. Around the same time, some Art & Design pioneers were of the view that artefacts should also be inexpensive. The tension between quality development and 'demo' design and the effort to reconcile the two prevailing discourse on design at the turn of the last century. One of the most important facets of the movement that would have had contemporary practice is the establishment of guilds. People within the guilds were trained by professional artists and finally, after gaining well-paid training and experience, they became instructors themselves in the artistic period represented within a sense of respect not just for art but also for individuals beyond the creative circle is a central element of the movement that has contributed to such a valuable and extraordinary extension of creative growth over time. The Industrial Revolution began at the end of the 18th century and grew into the second Industrial Revolution in Europe and North America during the 19th century. This was a period of transformation characterized by dramatic shifts in culture and business. With technical and science advances and new materials available, robots have increasingly displaced men in factories. It was possible to produce goods faster and cheaper, leading to mass production. This development has prompted significant questioning in the arts. What was the position of the artist or craftsman before the robots replaced them? The Arts and Crafts is an artistic movement that has developed from these interrogations. Nowadays, people don't know much about making things like they did in the past centuries. People rely heavily on machines and have lost their enthusiasm for creating and learning products. Factories manufacture items in an assembly of staff assigned to of a designer as a craftsman. Yet, while the Arts and Crafts movement was primarily A the guild system. A sense of identity, a sense of social obligation and, most particularly, a particular, routine role in the manufacturing line. Applying the educational component of the Arts and Crafts Movement to modem situations adds not only a greater production of products at an individual level, but also a potential at better wages as encountered by women in the movement at the beginning of the 20th century. Yet not all of the advances of the Industrial Revolution have been beneficial to society. Countries, mostly predominantly rural and pastoral, have developed into urban nations. Rural neighbourhoods appeared out-dated at the time. As cities grew, the increasing number of coal-fired plants hissed thick smoke in the air, and the climate worsened. Several citizens, including musicians and architects, have opted to leave bustling cities to the countryside. In summary, the social problems mentioned and dealt with during the Arts and Crafts movement can be seen very much today, albeit on a larger scale. People of today are producing massively produced goods for use by billions of people all over the world. Increasingly, demand for these products is not based on quality, but rather on quantity. People want inexpensive products, brand-name objects just to have them, not so much to fulfil a reason or to help an artist. In fact, the advocates of the Arts and Crafts movement were against the concept of division of labor which, in some cases, could be independent of the existence or absence of machines. They were in favor of the concept of a master craftsman, making all the parts of a furniture piece. The Arts and Crafts movement aimed to reunite what had been torn apart in the essence of human work, and to make the artist work with his hands at every point of production. Some of the most prominent apostles of the revolution, such as Morris, were more than happy to design computer manufacturing goods, when this did not entail the wretched division of labor and the destruction of craft ability, which they denounced. In the world where we are faced with modern technologies, where the essence of original arts and craftsmanship is steadily slipping away for money, I’d ask you, would you still sought to compromise with efficiency of machines or the skills of craftsmen?
 @OverThinker
Open for Commission Hello Everyone! Yes, you’re reading it right. @OverThinker is now open for commissions. I badly need money for Christmas so every commission would be a great help🥺🥺🥺. Hope you’d support me guys💕💕💕. So I will limit my service to the ff.: •Digital Arts (anime style, personalized wallpaper, etc) •Logo design Details: **Digital Arts** note: I am also open for generating Original Characters (price is negotiable) Head shot-$5 per head Head to bust-$6 per head Half Body-$8 per head Full Body -$10 per head Logo Design For logo design I usually rate $25-$50 per logo but everything is negotiable. Here are my sample works: You can contact me on telegram: @RCOverThinker for more details. Thank you all guys. Have a great day! #SupportArtists



+7 more
@OverThinker
Monsters of the Mind Typically, our fear of darkness is not fear of the dark. Rather, it is the anxiety of real or perceived danger obscured by darkness. Just say the word "***dark***" and the connection starts to flow. Demon, ghosts, haunted houses, caves, vampires, cemeteries, bad guys, monsters, devils, etc. And the stories I've heard have been without firm evidence, imagination has been strong in my young mind that often I experience nightmares. Luckily, reading the stories of the Bible and learning how to pray while we were children clearly made me rise above my worries when growing up. In the real world, darkness, in its various ways, reflects many of our fears. May it be physical, psychological, mental, relational, metaphysical darkness. Psychologists refer to any intense fear of darkness as nyctophobia in Greek terms. No matter what it's called, this debilitating illness produces multiple colored creatures in anyone's existence. When we age, we may no longer be as fearful of literal uncertainty as we dread uncertainties and unwelcome circumstances in our lives. Typically, our fear of shadows is not fear of shadows. Rather, it is the terror of real or perceived threats hidden by darkness. When we can not grasp or embrace things, or when they go beyond our influence, they inadvertently activate the so-called monsters of the mind. It's not the answer to run away from our terror. We need to face it, reach out, and guide our journey to the light. Psychological gloom occurs as a consequence of our habits of behavior — i.e. behavioral illnesses that cause anxiety and severe disability in education, at work, or in our social environment. Unfortunately, many live in the darkness of anxiety and depression, post traumatic experiences, the pressure to excel, and peer pressure. Those with personality dysfunctions such as eating disorders, panic attacks or post-traumatic stress, other neurological disorders as well as drugs and alcohol abuse, describe life in the dark, ironically, in a God-created light and magnificent world. People with emotional and relational issues typically have destructive habits that might spin out of control and lead to intense distress, depression, or anger. These can involve antagonism, promiscuous conduct, and irresponsibility related to dysfunctional and fractured marriages, health and economic difficulties, and, most specifically, loss of moral and spiritual perspectives. The enigma of spiritual darkness tells us of the hour of midnight when even shadow does not exist. It reflects total desperation and sorrow. Yet we should dream beyond that, where the bright light of a new day shines and empowers us to win and accept it with a sunny smile on our face. *We can learn to appreciate the darkness. After all, we need darkness in order to see light.*
 @OverThinker
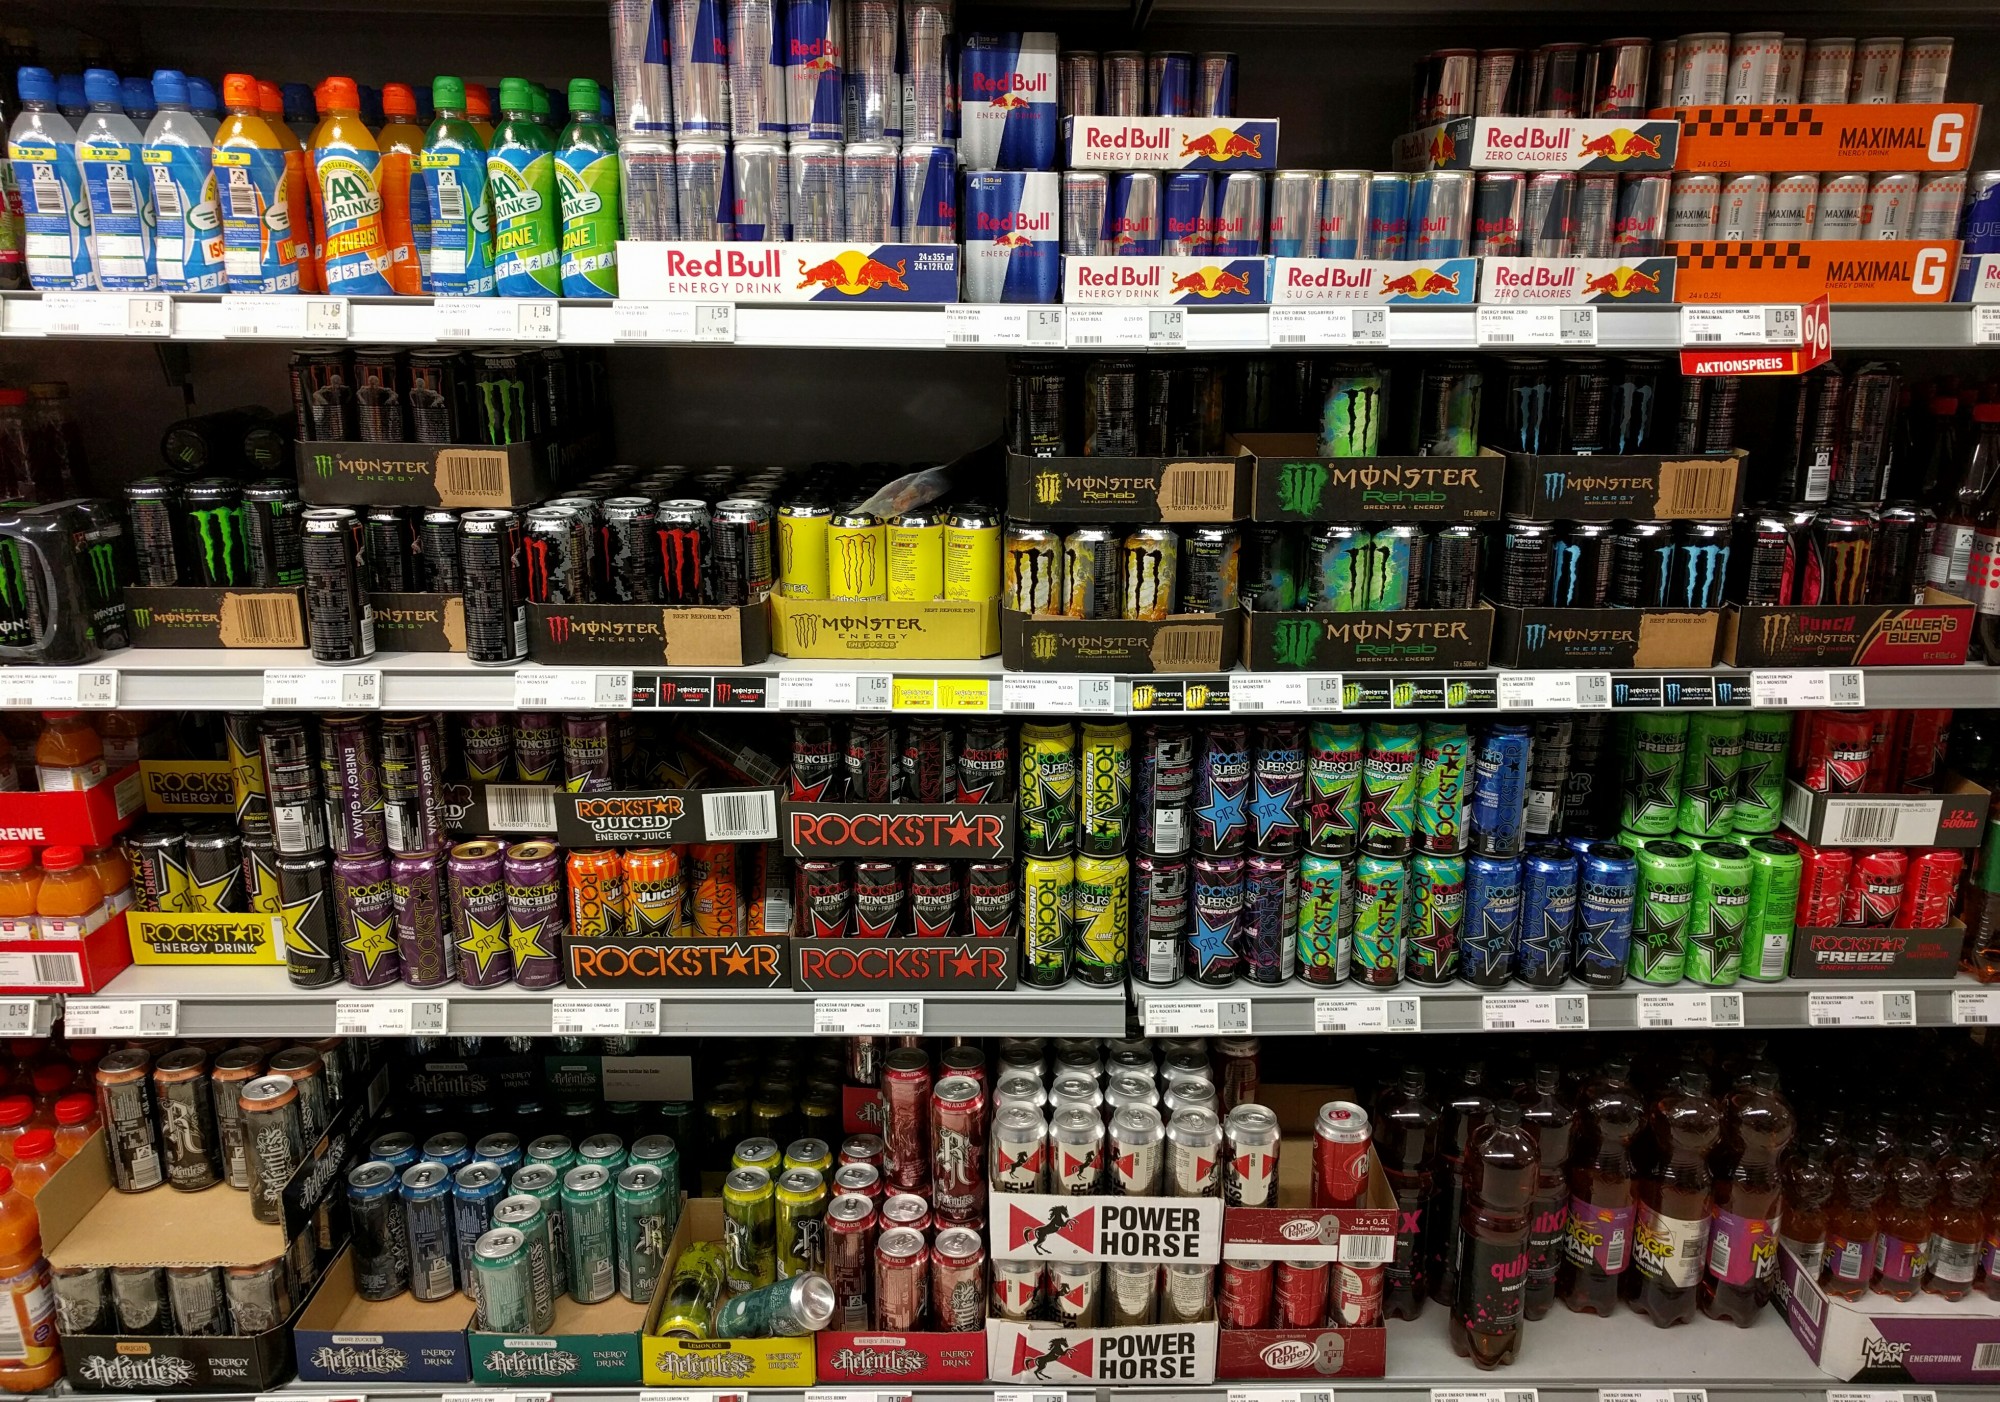
Negative Health Effects of Energy Drinks While energy drinks can give you a lift, research has found that they have a dark side. Toxic reactions and severe hospitalization have risen dramatically in young adults: adults who use energy beverages, high-caffeinated drinks, sugary drinks with a few ingredients to make them healthy — think taurine, ginseng, vitamins, and amino acids. But popular brands contain three to four times the amount of caffeine contained in a cola can! Considering that the average number of energy drinks consumed at any time is five (which means that 7.5 to 10 cups of coffee or 15 cola drinks are consumed in a relatively short period of time), you can see why these drinks are easy to overdose! Energy drinks are marketed heavily to teenagers, young adults, and professionals. Alarmingly, other coffee beverages, caffeine pills, alcohol, and even ecstasy are frequently ingested, making their effect all the more harmful. **HEALTH PROBLEMS** If the body appears to break down caffeine slowly (although there is a gene test that will assess this), even a small dose of energy drink will trigger complications. Typical signs reported to poison centers from frequent or high consumption of these beverages include heart palpitations, tremors, anxiety, stomach discomfort, although chest pain. There are also reports of caffeine-related deaths in young people reportedly caused by energy drinks. **ENERGY BOOSTING ALTERNATIVES** If you feel lacking in energy on a daily basis, you can listen to your body and take more rest breaks, catch up on sleep, and re-examine your diet. Energy drinks are a dangerous, short-term cure that can hurt the heart. Smarter drinks for cooling both young and old contain mineral water with a splash of juice,, pure chilled lemon water, freshly pressed juices, or smoothies.
 @OverThinker
Things to Do During Rainy Season The rainy season is a time when people are less interested in the outdoors, And have more calories to consume. It's quick to make reasons for skipping exercising when it's cold and uncomfortable outside. There are still fewer hours of sunshine, which may deter people from being involved. We wear coats to stay warm, which may make us less vigilant or less worried about weight gain. We may also argue that the accumulation of fat gives us extra warmth and energy. Although we already have access to a wide variety of technologies, tools, and knowledge that can help reduce weight gain during the rainy season. Below are five techniques that will help you keep focused through the rainy season and adhere to your balanced eating and workout schedule. **Prepare Meals in Advance** The rainy season can also be an impulsive time to pick a meal where people get fast and simple food that is warm and complete. On the other hand, preparing your meals in advance is a perfect tool to help you boost your health and lose weight. Weight loss is much like every other part of your life, and the more you plan and practice, the more likely you are to succeed. Don't make any assumptions about what you're going to eat at the last minute. Without a decent meal schedule, you're left to search and harvest food in the real world, and it'll be harder to make nutritious food options if you're not prepared. Being prepared helps you stop a last-minute disaster and makes it much easier to stick to it. A balanced diet schedule. In fact, meal preparation can reduce some of the discomfort associated with enjoyment. Getting nutritious food close at hand for breakfast, lunch, and dinner will reduce the chances of catching junk on the track. **Lighten Up On Hot Drinks** The cooler weather may increase your intake of hot drinks, which in turn may have an effect on your weight. When you start applying sugar, milk, and even cream to your coffee, the kilocalorie and fat content is rising significantly. **Have Some Soup** One of the easiest ways to decrease the kilocalorie content of food consumption and to shed some weight during the rainy season is to eat a lot of broth. Only make sure you skip cream-based soups that are filled with fat and kilocalorie. Ideal for lunch, dinner, or even as a snack, a rich, hearty soup may be a must. Soup is low in kilocalorie since it is usually eaten sweet, so people are very good at cutting back on their resulting consumption of calories. Soup is also a perfect time-saver, so you can make big quantities and easily reheat or freeze the leftovers. Fill your soup with legumes, onions, and a little tomato stock, and add a nutritious taste. **Do Some Indoor Exercise** Often when it's raining and wretched outside, we feel like going to a gym or going out the front door for that matter. It's going to help you stay on track if you have some exercise options that you can do indoors. If you feel comfortable, you are less likely to find excuses to avoid exercise. Some ideas include the use of exercise equipment, such as a treadmill or exercise bike, which can even be set up in front of the TV to make the bike. Time is getting quicker. There's also a wide range of fitness DVDs targeting various body parts by combining exercises from pilates and aerobics. Another nice choice is to build up your own in-house circuit, which is a mix of weight training and cardiovascular training. **Use Buddy System** Making improvements and operations with a company is often better.
 @OverThinker
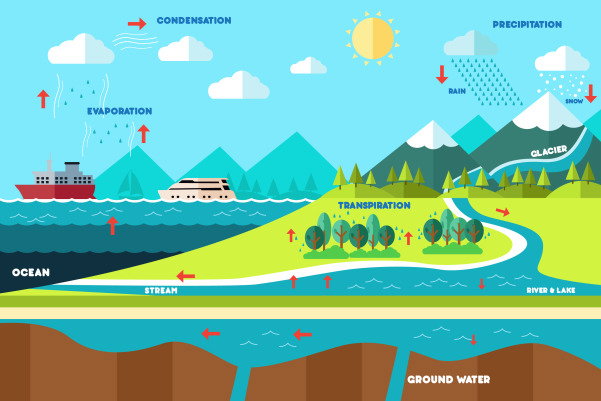
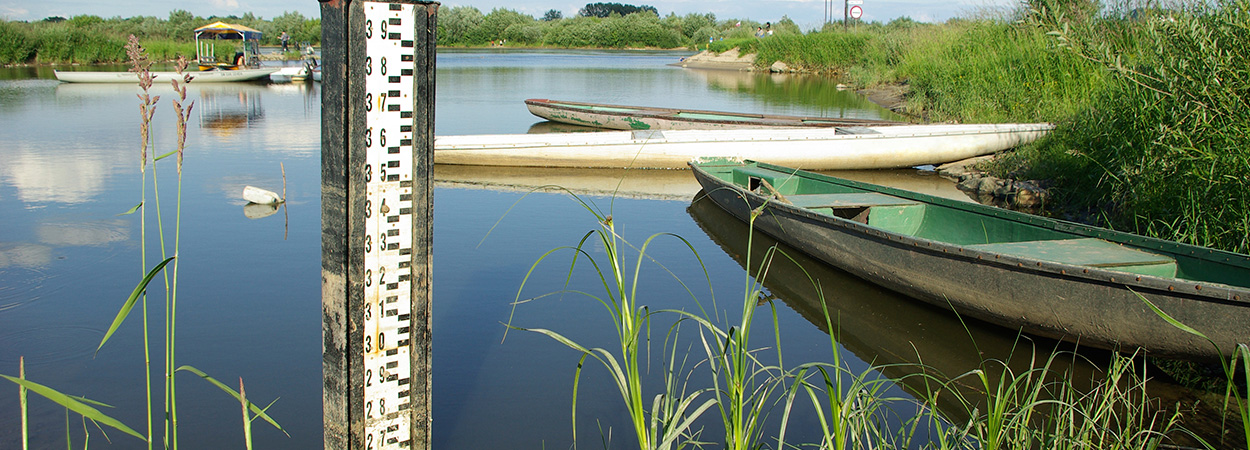
History of Hydrology Chow (1964) called the year 1930-1950 the Period of Rationalization since it is the era where a lot of inventors produced a significant step forward for the field of hydrology; as government agencies began to develop their own programs of hydrologic research. The period of rationalization (1930—1950) is the period during which we find the true gurus of modern hydrology. Advances like L.K. Sherman's unit hydrograph (1932), R.E. Horton's work on infiltration (1933), groundwater studies by C.V. Theis (1935), and flood frequency statistics by E.J. Gumble (1941) and A. Hazen (1930) are examples of contributions during this period. These pioneers published their research and developed procedures that are still very much in use today (Chow 1964). The following are the important research outputs during the 1930-1950: · Sherman’s unit hydrograph (1932) The Unit Hydrograph (UH) of a watershed is defined as the direct runoff hydrograph resulting from a unit volume of excess rainfall of constant intensity and uniformly distributed over the drainage area. The duration of the unit volume of excess or effective rainfall, sometimes referred to as the effective duration, defines and labels the particular unit hydrograph. The unit volume is usually considered to be associated with 1 cm (1 inch) of effective rainfall distributed uniformly over the basin area. · Horton’s infiltration theory (1933) This states that for excess rates of rainfall, the actual infiltration rate will follow the limiting curve. The capacity decreases with time and ultimately reaches a constant rate, caused by filling of soil pores with water, which reduces capillary suction. · Theis’s non-equilibrium equation (1935) in well hydraulics Theis’s non-equilibrium equation (1935) introduced a groundbreaking tool for determining the hydraulic properties (transmissivity and storativity) of nonleaky confined aquifers. Analysis with the Theis method is performed by matching the Theis type curve to drawdown data plotted as a function of time on double logarithmic axes. · Gumbel (1958) proposed the use of extreme-value distributions for frequency analysis of hydrologic data, thus forming the basis for modern statistical hydrology. During this period, the U.S. Army Corps of Engineers (ACOE), the NWS within NOAA, the U.S. Department of Agriculture (USDA), and the USGS made important contributions to the theory of hydrology and the establishment of a national network of precipitation, evaporation and calculation of stream flow. The NWS is still largely responsible for rainfall measurements, reporting and forecasting of severe storms and other related hydrologic investigations. During this time, the U.S. ACOE and the USDA Soil Conservation Service (now known as the Natural Resources Conservation Service [NRCS]) made important contributions to the field of hydrology including flood management, river growth, irrigation and soil conservation. More recently, for both quantity and quality data, the USGS has taken major measures to develop a regional network of stream gages and rainfall gages. In providing the study of dynamic hydrologic data to establish relationships and clarify hydrologic processes, their water supply publications and special studies have done much to advance the field of hydrology. The NWS and USGS both support numerous websites for the dissemination of watershed information and precipitation and streamflow data from thousands The following are the advancements in the field of hydrology for the following period. **1950s - 1960s** · Increase of urbanization following World War II in the United States and Europe led to better methods for predicting peak flows from floods, for understanding impacts from urban expansion, and for addressing variations in storage in water supply reservoirs. · Major expansion of cities and water systems within the United States during the 1950s led to a need for better understanding of floods and droughts, especially in urban areas. · Water resource studies became an everyday occurrence in many rapidly developing areas of the United States, tied to the expansion of population centers in the southern, southwestern, and western states. **1970s - 1980s** · The evaluation and delineation of floodplain boundaries became a major function of hydrologists, as required by the Federal Emergency Management Agency (FEMA) and local flood control or drainage districts. In order for communities to be eligible for flood insurance administered by FEMA, they are required to delineate floodplain boundaries using hydrologic analysis and models. This function has taken on a vital role in many urban areas, as damages from severe floods and hurricanes continue to plague the United States, especially in coastal and low-lying areas. **1980s - 1990s** · Late 1990 first detailed global water resources assessments comparing water availability with water use (Shiklomanov, 1997). Mostly relied on statistics of water use (e.g., AQUASTAT) and observations of hydrology. Shortly thereafter, first Macro scale hydrological models (MHMs), WaterGap (1997), WBM (1998) and MacPDM (Arnell, 1999). · Minimum stream power theory (Chang 1980) · Maximum sediment discharge and Froude number theory (Ramette 1980) · Maximum sediment discharge theory (White et al. 1982) · Maximum friction theory (Davies and Sutherland 1983) · Minimum unit stream power theory (Yang and Song 1986) · Thermodynamic theory (Yalin and da Silva 1997, 1999), minimum energy dissipation theory (Rodriguez-Iturbe et al. 1992) **1990s – 2020** · Principle of least action (Huang and Nanson 2000) · Entropy theory (Deng and Zhang 1964; Singh et al. 2003a, b; Singh and Zhang 2008a, b). Each theory leads to unique hydraulic geometry relations, meaning different values of exponents. · Singh (2003) has discussed characteristics of these relations with regard to their basis, tendency to equilibrium state, limitations of the equilibrium assumption, validity of power relations, stability of exponents in power relations, effect of channel patterns, effect of stream size, dependence of exponents on climatic and environmental factors and land use, extension to drainage basins, and impact of boundary conditions. These are of the some computer advances in hydrology since 1960s to present. · **1960-1970**- The introduction of the digital computer into hydrology during the 1960s and 1970s allowed complex water problems to be simulated as complete systems for the first time. · **1970-** Hydrologic computer models developed in the 1970s have been applied to areas previously unstudied or only empirically defined. For example, urban stormwater, floodplain and watershed hydrology, drainage design, reservoir design and operation, flood frequency analysis, and large-river basin management have all benefited from the application of computer models. · Single-event models such as HEC-HMS are used to simulate or calculate the resulting storm hydrograph (discharge vs. time) from a well-defined watershed area for a given pattern of rainfall intensity. · Continuous models such as the Hydrological Simulation Program Fortran (HSPF) and the Storm Water Management Model (SWMM) can account for soil moisture storage, evapotranspiration, and antecedent · Rainfall over long time periods. Statistical models can be used to generate a time series of rainfall or streamflow data, which can then be analyzed with flood frequency methods. · Newer distributed hydrologic models (i.e., VFLO and the MIKE series of models) can handle input, output, and data manipulation at the watershed level. · **1970-** Unquestionably new digital approaches combined with distributed terrain modeling have revolutionized hydrology in recent years, just as the original wave of models did in the decade of the 1970s. · The data revolution in hydrology and geographical information systems (GIS) have made available newer and more accurate datasets on topography, slope, rainfall, soils, land use, and channel characteristics for many areas. Moreover, most hydrological and meteorological data may be retrieved online from agencies such as the USGS and NWS, and various county and municipal sources. **References** G Johnston (2005). **HYDROGRAPH Sherman (1932) first proposed the unit hydrograph**. Retrieved from **https://studylib.net/doc/7268286/hydrograph-sherman--1932--first-proposed-the-unit-hydrograph** V Singh (2018). **Hydrologic modeling: progress and future directions**. Retrieved from **https://link.springer.com/article/10.1186/s40562-018-0113** **z?fbclid=IwAR2GZJ3UPiVnK5TGLC32E5mZwLGCmk7mQ58uO9lx62Nq6JYuIZuRvqw8En0** P Bedient et. al (2013). **Hydrology and Floodplain Analysis**.
 @OverThinker
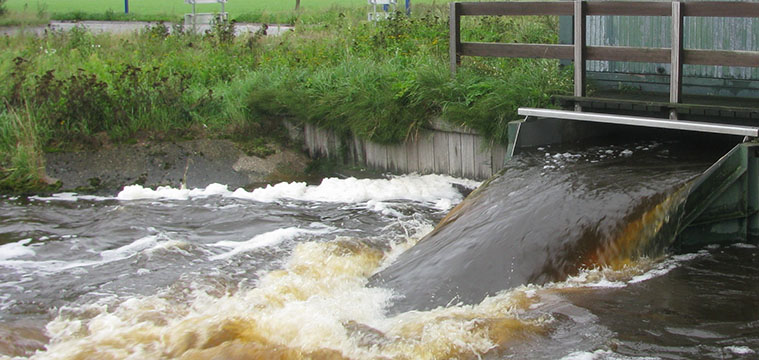
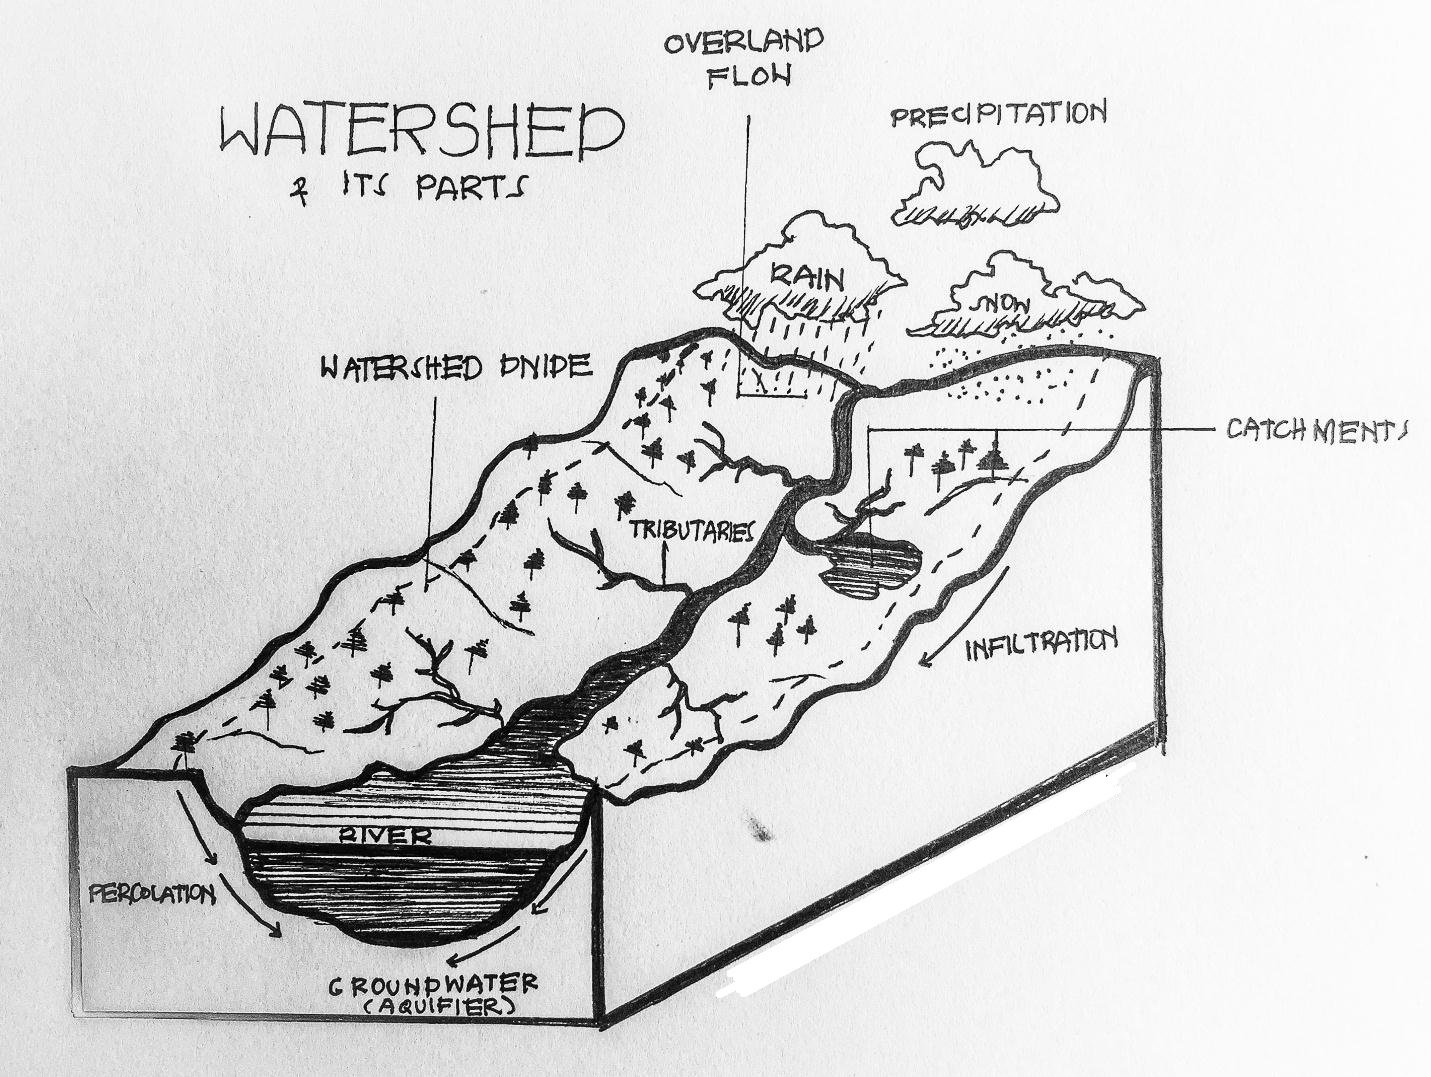
Watershed **Watershed** **I. Activities that Negatively Affect Watershed** **1.** **Conversion to impervious surfaces of woodland / natural areas.** Impervious surfaces and other forms of development reduce the infiltration of water into the ground. Impervious surfaces often contribute to higher storm water runoff, greater sediment yields, and increased pollutant loads, all of which can degrade water quality. **2.** **Stabilization of stream banks in very urban areas by concrete, cement, and riprap.** Stream bank stabilization is needed in areas where an existing structure is jeopardized, where the rate of and/or the potential for erosion could threaten future planned improvements, or where the actual or potential erosion puts significant environmental features at risk. **3.** **Impoundments of water (lakes or bassins).** This is obvious when one considers that as the watershed to lake area increases there are additional sources (and volumes) of runoff to the lake. In larger watersheds, there is also a greater opportunity for water from precipitation to contact the soil and leach minerals before discharging into the lake. **4.** **Power plants and industrial discharges.** The transport of thermal effluents along river reaches may lead to plant-to-plant interferences by elevating condenser inlet temperatures at downstream locations, which lower thermal efficiencies and trigger regulatory-forced power curtailments. **5.** **Removal of the cover for riparian tree near streams.** Road building may cause accelerated erosion, introduce oil and other pollutants to the stream, cut off subsurface water flow to the stream and threaten wildlife. Farming can increase erosion of stream banks if the riparian zones are cleared for more farmland. **6. Runoff from paved, hot surfaces.** These result from rapid heat transfer from low‐specific heat capacity surfaces to precipitation, which can cause thermally polluted surface run‐off to enter urban streams. **7.** **Sewage spills, household and animal waste, yard waste disposed of in streams.** Alternatively, leaking or flooding can cause completely untreated sewage to enter rivers and other water sources, causing them to become polluted. **8.** **Poorly maintained building sites, winter road sand, in stream erosion, barren soils, poor farming practices, over weeding.** Poor farming is probably the most significant activity that accelerates soil erosion because of the amount of land that is farmed and how much farming practices disturb the ground **9.** **Diverse leakage of underground storage facilities, surface leaks, unauthorized discharges, chlorine from the runoff of pools.** Polluted storm water contaminates streams, rivers and lakes. It can kill or damage plants, fish and wildlife, while degrading the quality of our water. **10. Improper application of fertilizers and manure for lawns or crops.** This excess nitrogen and phosphorus can be washed from farm fields and into waterways during rain events and when snow melts, and can also leach through the soil and into groundwater over time. High levels of nitrogen and phosphorus can cause eutrophication of water bodies. **II. Activities That Promote the Health of Watershed** **1. Consider using organic or slow release fertilizers instead**. As organic fertilizers break down, they improve the structure of the soil and increase its ability to hold water and nutrients. **2. Recycle yard waste in a compost pile & use a mulching mower.** Composting yard waste recycles nutrients back into the yard and saves landfill space. Composting reduces yard waste volume by 50 to 75 percent. Compost made with manure is questionable for use in food gardens due to newer strains of bacteria that cause food-borne illnesses. **3. Use surfaces like wood, brick or gravel for decks & walkway**. It allows rain to soak in & not run off. **4. Never pour used oil or antifreeze into the storm drain or the street.** It's very important that you help prevent contaminants from flowing into storm drains and never pour anything into them. **5. Avoid sewage spills, household and animal waste, yard waste disposed of in streams.** Proper waste disposal is critical due to the fact that certain types of wastes can be hazardous and can contaminate the environment if not handled properly. Avoiding sewage spills, household and animal waste, yard waste disposed of in streams would reduce the risk of water and soil pollution. 6. **If possible, limit the usage of cars for transportation instead walk, bike or environment friendly vehicles.** Many pollutants in our waters come from car exhaust and car leaks. **7. Conserve water every day.** Take shorter showers, fix leaks & turn off the water when not in use. **8. Don’t pour toxic household chemicals down the drain.** It is very important that you help prevent contaminants from flowing into the drains of storms and never pour into them. **9. Use hardy plants on your yard which require little or no watering, fertilizers or pesticides.** This would reduce the risk of water and soil pollution. **10. Help grow young trees, and reforest areas that have few trees, particularly near water sources.** The soil can retain moisture for a long time in the event of low rainfall thus benefiting plants and animals alike. Plants display transpiration which is a way of releasing excess water into the atmosphere. This also offers a cooling effect in the surrounding environment thus reducing heat build-up. This further leads to greater retention of soil water. III. **Watershed Related Study from Research Journal Publications** **Cumulative Environmental Effects of Contemporary Forest Management Activities in Headwater Basins of Western Oregon** *Arne E. Skaugset, Oregon State University; Robert E. Gresswell, USGS; Judith Li, Oregon State University; Michael Adams, USGS; Kermit Cromack, Oregon State University.* Most of Pacific Northwest timber harvest comes from the forested land base minority owned by the private industrial forest sector. For a continued supply of solid wood, society is more dependent than ever on the productivity and culture of those forest lands. One potential obstacle to the continued flow of solid wood from these lands is concern with respect to the anticipated environmental effects of intensive land management. The anticipated environmental effects result from a lack of knowledge about the actual environmental effects at a watershed scale caused by contemporary forest management activities. To fill that knowledge gap, the Hinkle Creek Paired Watershed Study was designed and initiated. The watersheds for the study at Hinkle Creek are owned by Roseburg Forest Products (RFP), which actively manages Douglas-fir 's young, harvest-regenerated stands on them. Hinkle Creek, the landowner, a research group, and private industrial, state, and federal forest land managers have collaborated on the development of a state-of-the-art, paired watershed study. The study comprises a control watershed, Hinkle Creek's North Fork, and the South Fork, a treatment watershed. The planned harvest schedule allows comparisons with and without fish before and after harvest, as well as between harvested and unharvested streams and for small and large streams. In these watersheds the research addressed: · the effects of forest management on the physical, chemical, and biological characteristics and habitat quality in small streams without fish · the influence of changes in the physical, chemical, and biological characteristics and habitat quality on amphibian and invertebrate abundance, distribution, and movement, in headwater streams with and without fish, and · the role of movement in maintaining abundance and diversity of fish and amphibians as habitat quality changes throughout the stream network. A tremendous amount of research on forestry's environmental effects was conducted in paired watershed studies, and a tremendous amount of knowledge was gained from that research. However, the congruence of recent technological innovations and the location of this study provide an excellent opportunity to significantly enhance the understanding of the environmental impacts of forest watershed management. The research approach will employ a new generation of sensors including passive integrated transponders (PIT tags) that enable daily and seasonal tracking of fish movement using both stationary readers and mobile antennas. Detailed and continuous measurement of the discharge, temperature and sediment load at spatially explicit locations will place the fish's movement in a physical context. Finally, recent innovations in GIS technologies allow for a description of the spatially dynamic interactions between physical and biological phenomena. These technological advances combined with the landowner's willingness to allow them to be used in a managed landscape will set a new standard for what we can learn and how we can truly better understand the environmental effects of forest management at a watershed and landscape level. **References** The Nature Conservacy (n.d.). **Journey with Nature: Watersheds 101**. Retrieved from **https://www.nature.org/en-us/about-us/where-we-work/united** **states/indiana** **/stories-in indiana/watersheds101/?fbclid=IwAR2Z3bWGO3Xn619E_** **f2dY1v7qPeiq7ADJwtSL03o2XHYI6S4LhS-CkQREhk** **Human Impacts Upon Watersheds.** (n.d.). Retrieved from **https://loudounwildlife.org/** **wp-content/uploads/2016/08/SM_Human_Impacts.pdf?fbclid=IwAR0s9-ljOlXEgki9L5PI16quy34uY2IBY3bFTjUnVRuKflYXZ4jo9ML7lc0** **The Effects of Human Activity on Surface and Ground Water in a Watershed.** (n.d.). Retrieved from **https://www.allenisd.org/cms/lib/TX01001197/Centricity** **/Domain/1400/WatershedKiser2015.pdf?fbclid=IwAR39JyFHqnk3KzW0hpHkRDwqretTSzHKme0lOSFAh3Sj55Yk7s26CXbIGQM** Skaugset A. et. al (2004). **Cumulative Environmental Effects of Contemporary** **Forest Management Activities in Headwater Basins of Western Oregon.** Retrieved **from** **http://watershedsresearch.org/sites/wsr/files/Hinkle%20PWS%20Study** **%20Proposal%205-25-2004.pdf** **Stream Bank Protection And Erosion Damage Mitigation Measures** (n.d). Retrieved from **https://mckinneytexas.org/DocumentCenter/View/419/** **StreamBankStabilizationCH-2?bidId=** Miara A. (2017). **Thermal pollution impacts on rivers and power supply in** **the Mississippi River watershed.** Retrieved from **https://www.nrel.gov/docs/fy18osti/70881.pdf**
 @OverThinker
Application of Hydrology to Irrigation, Drainage, and Soil And Water Conservation **HYDROMETEOROLOGY** Hydrology’s application to agriculture is found in irrigation, soil conservation and drainage. Agriculture, which for the most part is carried out in natural environments, varies from country to country in its water use. Therefore the way in which hydrology is applied to agriculture will differ according to each country's natural environments. **APPLICATION OF HYDROLOGY TO IRRIGATION** Hydrology helps in Irrigation Planning; it is usually done against such a droughty year as occurs several times over the course of several-ten years, so irrigation water can meet the requirements for most years. Estimation for effective rainfall is essential in irrigation scheduling decisions, is used to design new irrigation systems, and is a guiding factor for planning crop production practices. Estimation of evapotranspiration under various conditions is indispensable to the irrigation planning since evapotranspiration occupies a large part in consumptive use of water on paddy fields as well as on upland fields. Estimation of water resources for irrigation is essential to distinguish if water requirements of farm lands are met by effective rainfall and irrigation water taken from reservoirs and stream flow. The water balance analysis reveals the percentages of precipitation made up by surface flow, evapotranspiration, groundwater recharge and the change of soil storage, all of which are considered useful to the further understanding of the hydrological processes. **APPLICATION OF HYDROLOGY TO DRAINAGE** Hydrology is needed for all applications where drainage capacity is to be computed or analyzed for evaluation or design of drainage improvements. Hydrology is applied to the estimation of Design rainfall and Runoff computation. Design rainfall is defined as the total amount of rain during the cropping season at which or above which the catchment area will provide sufficient runoff to satisfy the crop water requirements. It is usually assigned to a certain probability of occurrence or excess. Runoff computation methods attempt to mathematically reproduce or simulate the hydrologic cycle. They treat rainfall as an input, converting it into estimates of resultant runoff volume and/or rate. **APPLICATION OF HYDROLOGY TO SOIL AND WATER CONSERVATION** Hydrology is applied to the estimation of Soil Conservation Planning and Runoff computation. Determined by the changes in soil water content over time, the soil moisture regime is the main single factor conditioning plant growth and crop production. Comprehensive plan should be worked out on drainage canal network and cropping system in order to maintain a high productivity of farm land. The evaluation of hydrological processes and the selection and development of methods and techniques for correcting or controlling them under different soil, topography and climate conditions are necessary in order to suppress or alleviate the negative effects of soil and water degradation on sustainable agricultural production, water supply in adequate quantities and quality for the different potential uses and on catastrophic events such as flooding, sedimentation, landslides, etc. Analyzing the hydrological approach to assessing and predicting soil and water conservation against processes of degradation would be essential for the adequate development, selection, and application of sustainable and effective use and management practices.
 @OverThinker
Who’s this sleepy head? Hello Everyone! I just wanna ask if there’s something wrong with my eyes? I can see a little fella here and I don’t know if I’m just imagining it or what. Hahahahahhaha So that’s it😂 Just dropping by. ps. I’m open for commissions
 @OverThinker
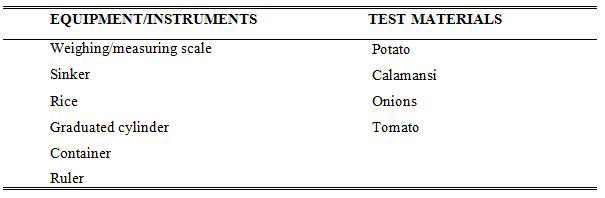
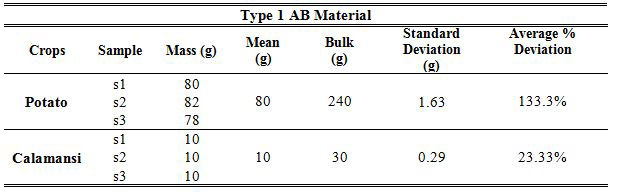
Determination of Physical Properties of AB materials (Mass, Volume, Density and Porosity) **METHODOLOGY** **I. Materials and Instruments** Available instruments and simple tools were utilized to conduct and record measurements. Table 1 shows the list of the materials, equipment and hand-held measuring tools and instruments used in conducting the activity. **Table 1.** Instruments and materials used in the performance evaluation of the physical properties. **I. Determination of Physical Properties of AB Materials- Mass, Volume, Density and Porosity** Selected physical properties of the test materials were determined by direct measurements such as: (a) Mass, Apparent Volume and Bulk Volume; (b) Apparent Density; (c) Bulk density and specific gravity ; and (e) Bulk Porosity. **A. Determination of Mass and Apparent Volume** Mass was measured using a weighing scale. Apparent volume was measured using the following methods; the **Volumetric Displacement method** (*Water Displacement Method* and *Solid Displacement Method*) and **Dimension method**. **Water Displacement Method** Using a graduated cylinder, the immersion liquid is used to measure the volume displacement caused by the sample inside the container. Weigh the desired quantity of the test samples using a weighing scale to get the mass. Table 2 shows the list of mass acquired using a weighing scale. Next is by conducting the water displacement method by using a graduated cylinder and water. Fill the graduated cylinder with enough water to completely immerse the desired quantity. Record the baseline initial measurement of the water then drop the sample. Lastly, record the final measurement and subtract the initial volume from the final volume to acquire the volume (Volume of the sample = Final water level - Initial water level). Sinkers are used in testing type 2 test materials for the samples to fully immerse on the liquid. The volume of the sinker used is 5cc subtracted to the final volume to acquire the apparent volume. The volume of the fluid displaced can then be measured, and from this, the volume of the immersed object can be deduced (the volume of the immersed object will be exactly equal to the volume of the displaced fluid). Table 3 shows the list of volumes acquired using LDM. **Table 2.** Mass of AB Materials **Table 3.** Volumes acquired using LDM. **Solid Displacement Method** The bulk density of rice is measured by evenly filling the graduated cylinder with a defined volume by tapping and smoothing the surface with a ruler. Both measurements are taken before the constant weight is reached for successive measurements. From the estimated weight of the rice and the volume of the container, the rice densities are determined. The samples and rice are then put in the graduated cylinder together. The graduated cylinder is tapped and a ruler is used to smooth the surface. Tapping and smoothing are continued until, across three consecutive measures, a constant weight is obtained. The sample volume is estimated using the given formulae: **Wseeds** = Wtotal − Wsample − Wcontainer **Vseeds** = Wseeds / ρseeds **Vsample** = Vcontainer – Vseeds where **W** = weight (kg), **V** = volume (m3), **ρ** = density (kg/m3). Table 4 shows the list of volumes acquired using SDM. **Table 4.** Volumes acquired using SDM. **Dimension method** The apparent density of a shape of regular geometry was determined from the volume calculated from the characteristic dimensions and mass. This method is only used for measuring the dimensions of calamansi and tomato. The sample volume is estimated using the given formula: Where: V= Volume of the sample material r= Radius The result summary of the Volume of Calamansi and Tomato using the Dimension Method presented in Table 5. . **Table 5.** Volume of Calamansi and Tomato using dimension method **B. Determination of Apparent Density** Apparent density is the density of a substance including all pores within the material (internal pores). Apparent density of regular geometries can be determined from the volume calculated using the characteristic dimensions and mass measured. Apparent density of irregularly shaped samples may be determined by solid or liquid displacement methods. It was obtained using the formula: where: **m** is the weight of the test sample, kg **V** is the volume of the test sample (m) The result summary of the apparent density of the test materials using LDM are presented in Table 6. Apparent Density of the test materials using SDM is presented in Table 7. **Table 6.** Apparent Density of the test materials using LDM **Table 7.** Apparent Density of the test materials using SDM **C. Determination of Bulk Density and Specific Gravity** **Bulk density (BD)** pertains to the ratio of the weight of the samples to its volume. It was obtained using the formula: **BD=W/V** where: W is the weight of the test sample, kg V is the volume of the test sample (m) **Specific gravity (** **).** It is the ratio of the bulk density to the density of water which is 1g/cc and it is dimensionless. **BD** is the bulk density (kg is the density of water (kg m-3) The result summary of the apparent density of the test materials are presented in Table 8. **Table 8.** Bulk Density and Specific Gravity of the test materials **D. Determination of Bulk Porosity** **Bulk porosity** (εB) is the volume fraction of voids outside the boundary of individual materials when packed or stacked as bulk. It was obtained using the formula: Where: **εB=**Bulk porosity **=** Bulk density **=**Particle Density The result summary of the apparent density of the test materials using LDM are presented in Table 8.Bulk Density of the test materials using SDM are presented in Table 9. **Table 8.** Bulk Porosity of the test materials using LDM **Table 9.** Bulk Porosity of the test materials using SDM **RESULTS AND DISCUSSION** The results obtained from the physical characteristics tests of a variety of AB materials characterized as *Type 1: Heavier than water* and *Type 2: Lighter than water* were analyzed and discussed using two methods-- the Liquid Displacement Method and Solid Displacement Method. The result summary of the physical properties of AB Materials such as Mass, Volume, Density and Porosity using LDM are presented in Table 10. **Table 10***. Physical Properties of AB Materials using Liquid Displacement Method* The table above displays the tabulated findings for the physical properties of potatoes, calamansi, tomatoes and onions using the liquid displacement method. Type 1 (*heavier than water*) test materials are Potato and Calamansi. The potato has a weight of 80 grams have an apparent volume of 70 cc, an apparent density of 1.14 g / cc and a specific gravity of 0.675. The greater quantity of the sample potato with a bulk weight of 240 g has a bulk volume of 355.56 cc, a bulk density of 0.0.675 g / cc and a bulk porosity of 41%. Calamansi with a weight of 10 grams have an apparent volume of 8.3 cc, an apparent density of 1.16 g / cc and a specific gravity of 0.41. The greater quantity of the sample potato with a bulk weight of 30 g has a bulk volume of 73.17 cc, a bulk density of 0.41 g / cc and a bulk porosity of 64.65%. Type 2 (*lighter than water*) test materials are Onion and Tomato. The onion has a weight of 21.33 grams have an apparent volume of 22.3 cc, an apparent density of 0.95 g / cc and a specific gravity of 0.55. The greater quantity of the sample onion with a bulk weight of 64 g has a bulk volume of 116.36 cc, a bulk density of 0.55 g / cc and a bulk porosity of 42.11%. Tomato with a weight of 29.67 grams has an apparent volume of 45cc, an apparent density of 0.66 g / cc and a specific gravity of 0.525. The greater quantity of the sample potato with a bulk weight of 89 g has a bulk volume of 169.52 cc, a bulk density of 0.525 g / cc and a bulk porosity of 20.45%. The result summary of the physical properties of AB Materials such as Mass, Volume, Density and Porosity using SDM are presented in Table 11. **Table 11***. Physical Properties of AB Materials using Solid Displacement Method* The table above displays the tabulated findings for the physical properties of potatoes, calamansi, tomatoes and onions using the solid displacement method. Type 1 (*heavier than water*) test materials are Potato and Calamansi. The potato has a weight of 80 grams have an apparent volume of 71.67 cc, an apparent density of 1.09 g / cc and a specific gravity of 0.47. The greater quantity of the sample potato with a bulk weight of 240 g has a bulk volume of 355.56 cc, a bulk density of 0.0.675 g / cc and a bulk porosity of 38%. Calamansi with a weight of 10 grams have an apparent volume of 8.67 cc, an apparent density of 1.16 g / cc and a specific gravity of 0.28. The greater quantity of the sample potato with a bulk weight of 30 g has a bulk volume of 73.17 cc, a bulk density of 0.41 g / cc and a bulk porosity of 64.65%. Type 2 (*lighter than water*) test materials are Onion and Tomato. The onion has a weight of 21.33 grams have an apparent volume of 24 cc, an apparent density of 0.88 g / cc and a specific gravity of 0.55. The greater quantity of the sample onion with a bulk weight of 64 g has a bulk volume of 116.36 cc, a bulk density of 0.55 g / cc and a bulk porosity of 64.65%. Tomato with a weight of 29.67 grams has an apparent volume of 45cc, an apparent density of 0.66 g / cc and a specific gravity of 0.525. The greater quantity of the sample potato with a bulk weight of 89 g has a bulk volume of 169.52 cc, a bulk density of 0.525 g / cc and a bulk porosity of 20.45%. **Evaluation of the Physical Characteristics** **Apparent Volume** As shown in table 10 and 11, the apparent Volume of potato acquired using SDM is 1.67 cc greater than volume acquired using LDM having a mean of 70.83 cc, standard deviation of 0.88cc and average deviation of 83.5%. The apparent Volume of calamansi acquired using SDM is 0.37 cc greater than volume acquired using LDM having a mean of 8.49 cc. The apparent Volume of onion acquired using SDM is 1.7 cc greater than volume acquired using LDM having a mean of 23.15 cc. The apparent Volume of tomato acquired using SDM and LDM are the same. **Apparent Density** As shown in table 10 and 11, the apparent density of potato acquired using SDM is 0.05 g/cc greater than density acquired using LDM having a mean of 1.12 g/cc. Apparent density of calamansi acquired using SDM and LDM are the same. The apparent density of onion acquired using LDM is 0.7 cc greater than density acquired using SDM having a mean of 0.92g/ cc. The apparent Volume of tomato acquired using SDM and LDM are the same. **Bulk Volume and Bulk Density** Data acquired for Bulk volume and Density for the test materials using both SDM and LDM are similar. **Specific Gravity** The density of the liquid using LDM is 1g/cc while the density of rice using SDM is 1.45 g/cc. As shown in table 10 and 11, the specific gravity of potato acquired using LDM is 0.205 greater than SG acquired using LDM having a mean of 0.573. The apparent Volume of calamansi acquired using LDM is 0.13 greater than SG acquired using LDM having a mean of 0.345 cc. The apparent Volume of onion acquired using LDM is 0.17 greater than SG acquired using LDM having a mean of 0.47. The apparent Volume of tomato acquired using LDM is 0.17 greater than SG using SDM having a mean of 0.445. **Bulk Porosity** As shown in table 10 and 11, the bulk porosity of potato acquired using LDM is 3% greater than Bulk porosity acquired using SDM having a mean of 39.5%. The bulk porosity of calamansi acquired using LDM and LDM are both 64.65%. Bulk porosity of onion acquired using LDM is 4.61% greater than bulk porosity acquired using SDM having a mean of 39.81%. The bulk porosity of tomato acquired using LDM and SDM have a value of 20.45%. It is vital to be precise in calculating the data in order to evaluate the volume of the sample such that you have a correct test. The most critical data to record is the volume since volume plays a vital role is acquiring other physical properties. The findings reveal that calculations of the volume density and porosity of the potatoes, calamansi, tomatoes and onions have a significant disparity when measured between the liquid displacement method and the solid displacement method. The method of liquid displacement is an effective method of volume estimation which has been proved by the Archimedes theorem. The solid displacement method has much greater data calculated compared to the liquid displacement method. This shows that sand as a solid sample to be weighed in a solid displacement system is not advisable to be used, provided that it is not as fine as anything that can fully fill the container with the sample with minimal pore, particularly when evaluating the amount. Comparing the two techniques when it comes to calculating the volume of a sample, it can be found that the process of water displacement is more effective. In the course of calculating the quantities by liquid, you will easily see that the liquid fills all the spaces without reserves, unlike rice, which has a number of pores within, which would influence the data of the samples. **SUMMARY AND CONCLUSION** **Summary** This activity aimed to determine the physical properties of AB materials mass, volume, density and porosity. The physical characteristics of the test materials were evaluated in terms of Mass (g), Apparent Volume (cc) and Bulk Volume (cc); Apparent Density ( ); Bulk density ( ) and specific gravity (SG) ; and Bulk Porosity (%). Type 1 (*heavier than water*) test materials are Potato and Calamansi. The potato has a weight of 80 grams have an apparent volume of 71.67 cc, an apparent density of 1.09 g / cc and a specific gravity of 0.47. The greater quantity of the sample potato with a bulk weight of 240 g has a bulk volume of 355.56 cc, a bulk density of 0.0.675 g / cc and a bulk porosity of 38%. Calamansi with a weight of 10 grams have an apparent volume of 8.67 cc, an apparent density of 1.16 g / cc and a specific gravity of 0.28. The greater quantity of the sample potato with a bulk weight of 30 g has a bulk volume of 73.17 cc, a bulk density of 0.41 g / cc and a bulk porosity of 64.65%. Type 2 (*lighter than water*) test materials are Onion and Tomato. The onion has a weight of 21.33 grams have an apparent volume of 24 cc, an apparent density of 0.88 g / cc and a specific gravity of 0.55. The greater quantity of the sample onion with a bulk weight of 64 g has a bulk volume of 116.36 cc, a bulk density of 0.55 g / cc and a bulk porosity of 64.65%. Tomato with a weight of 29.67 grams has an apparent volume of 45cc, an apparent density of 0.66 g / cc and a specific gravity of 0.525. The greater quantity of the sample potato with a bulk weight of 89 g has a bulk volume of 169.52 cc, a bulk density of 0.525 g / cc and a bulk porosity of 20.45%. **Conclusion** In conclusion, the most accurate technique used to determine the physical properties of the materials is the Liquid Displacement Technique, where the quantity of fluid displaced is closely proportional to its volume relative to the use of the Solid Displacement Method, provided that it is not as fine as one that would absolutely fill the container with the sample. In evaluating the volume of the sample for two techniques, certain drawbacks that can influence the effects of the measurements have been found, first, that the use of larger samples, along with water or rice, can overflow the graduated cylinder, may not reach the highest volume calibrated in the graduated cylinder. Often, in the solid displacement process, use a finer substance that fills the graduated cylinder entirely than sand to provide precise measurements. The various physical properties of the solution are interrelated as observed on the conduct of laboratory exercise. It was proven that apparent densities of type 1 materials are less dense than 1 g/cc which is the density of liquid. The apparent densities of type 2 material are greater than water density. It was also observed that bulk density is less dense that the apparent density.
+17 more
@OverThinker
Levi and I Hello everyone! As I scroll on my gallery, I saw one of my artworks and noticed that I haven’t posted it here yet. I’ve made this art for a long time now and I made it using adobe photoshop. So here it is. Hope ya’ll like it😂
 @OverThinker
Tsukki and I Hello everyone! It has been very busy since online classes commenced last August and that is the reason why I kinda lie low on doing my personal hobbies especially doing some arts or commissions. In the midst of all the endless school works that I should finish ASAP, I just decided to have a short break and make time for myself. Since my hands itched to draw and at the same time waiting for the update of my favorite anime series, I've decided to make a digital art. So I forgot to take screenshots of the steps on the progress of my art work but anyways I'll just post the final piece. So here it is. I find it really cute and decided to make this as my wallpaper. And this is how it looked like: Kyaaaaa, internal self is screaming out loud😂. Guess like I'll be back at doing this hobby as a stress reliever. So I hope you like it❤️ Have a great day ahead

 @OverThinker
Recreational Activities **What is RECREATION?** Recreation is an activity of leisure, leisure being discretionary time. The "need to do something for recreation" is an essential element of human biology and psychology. Recreational activities are often done for enjoyment, amusement, or pleasure and are considered to be "fun". **What is the difference between LEISURE and RECREATION?** Leisure is spare or free time that we happen to have at our disposal and the time we tend to spend in our own characteristic style while Recreation are activities that are meant to bring joy and involve fun and excitement are referred to as recreational activities. These activities are taken up during leisure time and are generally out door in nature. **What are the types of recreation? Give examples.** Breaking recreation down into various areas, classifications, or types might be done in numerous ways. The listing below represents one of the ways that recreation could be categorized for individuals, groups, or leaders planning programs. The listing is shown in random order and does not indicate any order of importance. • Physical activities (sports, games, fitness, etc.) • Social activities (parties, banquets, picnics, etc.) • Camping and outdoor activities (day camps, resident camps, backpacking, float trips, etc.) • Arts and crafts activities (painting, scrapbooking, ceramics, woodworking, etc.) • Dramatic activities (plays, puppetry, skits, etc.) • Musical activities (singing, bands, etc.) • Cultural activities (art appreciation, music appreciation, panels, discussion groups, etc.) • Service activities (fun in doing things for others) **What is indoor and outdoor recreation? Give example** • Indoor recreation activities are undertaken on the comfort of one’s home or more specifically indoor and they are to recreate the mind and soul. For such indoor recreation activities there are well established clubs or recreation centers offer a varied programme of activities throughout the year . • Activities on offer include basketball, swimming, volleyball, chess, table tennis, bowling, singing, reading, listening to music, watching movies and more of the same. **What is indoor and outdoor recreation? Give example** · Outdoor recreation activities like the ones mentioned, also provide us with the means to exercise and hence happen to be one of the best forms of recreation. • Outdoor recreation sport examples include nature walks, river rafting, cycling, camping, fishing, hiking, adventure park, surfing and sports. Outdoor recreational activities can range from nature walks to river rafting **PATINTERO AND ITS MECHANICS** **WHAT IS PATINTERO?** • Patintero, also known as harangang-taga or tubigan, is a traditional Filipino children's game. Along with tumbang preso, it is one of the most popular outdoor games played by children in the Philippines. **MECHANICS:** 1. Each team is composed of 5 players and a coach. The official of the game is the scorer, timekeeper, and 5 linesmen. The objective of a team is to accumulate as many points by passing the lines without being tagged. A defensive team is called line guard while an offensive team is called the passer. 2. The game is started with toss of a coin. Whoever wins becomes the passer. A time limit of two minutes is given to each team to score 3. Once the limit elapses, the line guards assume the positions of the passer, and vice-versa. Passers are supposed to cross the lines from the starting point and back. 4. Four line guards are positioned on the vertical line and one on the horizontal line of the court. Their feet always be on the line. Line guards tag the passer with powered hands. 5. If any of the passer is tagged, the line guard immediately assumes the position of passer even if the 2- minute limit has not elapsed. 6. System of Scoring from Entry Point From Exit Point First line - 1 pt. Fourth line - 2 pt. Second line - 2 pts. Third line - 3 pts. Third line - 2 pts. Second line - 3 pts. Fourth line - 2 pts. First line - 5 pts (Home)
 @OverThinker
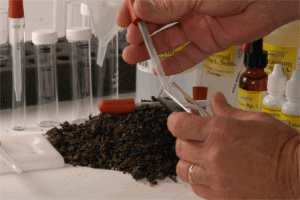
Determining Soil Physiological Characteristics **I. Determining Soil Morphological Characteristics** **a. Objective:** · Enumerate the process of the identification of basic soil physical properties (color, depth, soil layer boundary, pores, pebbles, gravels and stones) of soil samples. **b. Materials:** · Munsell color chart · Shovel · *Bolo* · Sticks/ Markers · Meter stick **c. Procedure:** · **Identifying soil layer boundaries** **1.** Create a pit for approximately 2 meters using shovel **2.** Choose a section or phase in the created pit that is exposed to sunlight **3.** Identify the change in color of the soil sample **4.** Establish points with the aid of sticks/markers to identify soil layer boundaries **5.** Enumerate the number of layers · **Identifying soil depth** **1.** Choose at least three (3) points in the established soil layer boundaries **2.** Measure the soil using the meter stick vertically from the surface of the soil down to the chosen established points **3.** Record and tabulate the acquired data. The depth of the soil is in negative value since the soil is measured vertically downward. (e.g 0 to -40cm) **4.** Sketch the chosen region with its established point to identify the soil’s transition. · **Describing soil pores** **1.** Observe visible pores present in every layer of the soil **2.** Measure the diameter of each pores present in every layer of the soil **3.** Categorize the measured pores by setting range of sizes from small, medium and large. (e.g. small 0.5- 2.0 , medium 2.1-4.0, large 4.4-5.1) **4.** Record and tabulate data. · **Describing present gravels, stones, and pebbles** **1.** Observe visible sedimentary fragments present in every layer of the soil **2.** Measure the diameter of each sedimentary fragments present in every layer of the soil **3.** Categorize the measured sedimentary fragments by the ranges of sizes from course sand (0.5 mm - 1.9mm), granule (2mm- 4mm), and pebble (4mm-64mm). **4.** Record and tabulate data. · **Describing present plant roots** **1.** Observe for visible plant roots present in every layer of the soil region. **2.** Measure the apparent roots through its diameter. **3.** Categorize the measured diameter by the range of the sizes of the present plant roots. (e.g. small 0.005-0.01, medium 0.02-0.09, and large (0.1-0.5) **4.** Record and tabulate the data gathered in each layer. **II. Determining Soil Physical Characteristics** **a. Objective:** · Enumerate the process of the identification of basic soil physical properties (color, structure, and texture) of soil samples. **b. Materials:** · Water **c. Procedures:** · **Soil Color** 1. Observe the change in color in every layer. 2. Using a *bolo* get a sample of the soil in each layer 3. Identify the color of the soil with the aid of Munsell Color Chart. 4. Record and tabulate the data. · **Soil Texture** **1.** Take a handful of soil about 25 grams. **2.** Remove the impurities (pebbles and visible bits of organic matter like roots etc.) in the soil sample. **3.** Break apart the aggregates to find the differing proportions of each of the components in the soil. **4.** Identify soil texture in every layer through field method (feel, roll,and ribbon). **5. Perform Feel Method**. ***A.*** Add a little bit of water to the soil sample until it is kind of moist putty. ***B.*** Adjust this by adding either dry soil or water. ***C.*** Form the soil in to a ball but some will not form into a ball. This means that the soil is sandy soil. ***D.*** Distinguish whether it is gritty, smooth or sticky. **a.** Take a small amount from the soil sample and put it on the palm of your hand **b.** Add quite a bit of water and then using your finger rub the soil against your palm. **c.** If there are bits of sand then it is gritty, if silt is dominant then it feels floury or smooth and if the soil sample is abundant in clay then it is dine or sticky. **6. Conduct the Ribbon Method.** ***A.*** Take a ball of soil and gently push it into a ibbon between your thumb and forefinger. (as if you try to form a ribbon) ***B.*** If the soil does form a ribbon, just keep pushing the soil out until the ribbon breaks from its own weight. ***C.*** Distinguish whether it is Weak, Medium or Strong Ribbon. Ø **Weak Ribbon**- an inch or less before breaking Ø **Medium Ribbon** – one to two inches (1.0-2.0 in) before breaking Ø **Strong Ribbon**- longer than two inches (2 in) **7. Operate Roll Method.** ***A.*** Take a handful of soil and wet it so that it begins to stick together, but without sticking to your hand. ***B.*** Roll the soil sample for about 3 cm in diameter. ***C.*** Put the ball down – if it falls apart it is sand. ***D.*** If it sticks together, roll the ball into a sausage shape 6-7 cm long. If it does not remain in this form, it is loamy sand. ***E.*** If it remains in its shape, continue rolling until it reaches 15-16 cm long, if it does not remain in its shape then it is sandy loam. ***F.*** If it is still in shape, try to bend the sausage into a half circle, if not possible then it is a loam soil. ***G.*** Continue to bend the sausage to form full circle, if not it is heavy loam but if it can still continue then it is light clay ***H.*** Lastly, if the soil is still in shape then it is clay. **8.** Refer to the textural triangle. · **Soil Structure** **1.** Identify Soil Structure in every layer. Ø **Grades of soil structure** o **0 Structureless** has no observable aggregation or no definite orderly arrangement of natural lines of weakness, such as: o **Massive structure** (coherent) where the entire soil horizon appears cemented in one great mass; o **Single-grain structure** (non-coherent) where the individual soil particles show no tendency to cling together, such as *pure sand*; Ø **Classes and Types of Soil Structure** · **Granular** and **Crumb** structures are individual particles of sand, silt and clay grouped together in small, nearly spherical grains. · **Blocky** and **sub-angular** blocky structures are soil particles that cling together in nearly square or angular blocks having more or less sharp edges. · **Prismatic** and **Columnar** structures are soil particles which have formed into vertical columns or pillars separated by miniature, but definite, vertical cracks. · **Platy structure** is made up of soil particles aggregated in thin plates or sheets piled horizontally on one another. Plates often overlap, greatly impairing water circulation. **2.** Using the Classifications given above, observe and record the data gathered. · **Soil Consistence** ***A.*** **Determination of wet-soil consistency** Press a small amount of wet soil between your thumb and forefinger to see if it will stick to your fingers. Then slowly open your fingers. Rate the stickiness as follows: § 0 Non-sticky, if no soil or practically no soil sticks to your fingers; § 1 Slightly sticky, if the soil begins to stick to your fingers but comes off one or the other cleanly and does not stretch when the fingers are opened; § 2 Sticky, if the soil sticks to both the thumb and forefinger and tends to stretch a little and pull apart rather than pulling free from your fingers; § 3 Very sticky, if the soil sticks firmly to both thumb and forefinger and stretches when the fingers are opened. ***B.*** **Determination of moist-soil** Try to crush a small amount of moist soil by pressing it between your thumb and forefinger or by squeezing it in the palm of your hand. Rate moist soil consistency as follows: § 0 Loose, if the soil is non-coherent (single-grain structure); § 1 Very friable, if the soil crushes easily under very gentle pressure but will stick together if pressed again; § 2 Friable, if the soil crushes easily under gentle to moderate pressure; § 3 Firm, if the soil crushes under moderate pressure but resistance is noticeable; § 4 Very firm, if the soil crushes under strong pressure, but this is difficult to do between the thumb and forefinger; § 5 Extremely firm, if the soil crushes only under very strong pressure, cannot be crushed between the thumb and forefinger, but must be broken apart bit by bit. **C. Determination of dry-soil consistency** Try to break a small amount of dry soil by pressing it between your thumb and forefinger or by squeezing it in the palm of your hand. Rate dry soil consistency as follows: § 0 Loose, if the soil is non-coherent (single-grain structure): § 1 Soft, if the soil is very weakly coherent and friable. breaking to powder or individual grains under very slight pressure; § 2 Slightly hard, if the soil resists light pressure, but can be broken easily between thumb and forefinger; § 3 Hard, if the soil resists moderate pressure, can barely be broken between the thumb and forefinger, but can be broken in the hands without difficulty; § Very hard, if the soil resists great pressure, cannot be broken between the thumb and forefinger but can be broken in the hands with difficulty; § Extremely hard, if the soil resists extreme pressure and cannot be broken in the hands. **D.** Record and tabulate the observed soil consistence in every layer of the soil sample. **III. Determining Soil Chemical Characteristics** · **Determining Soil pH** **1.** Using the Soil Test Kit, layout all the materials needed in the conduct of the Soil pH test such as test tubes, CPR, BCG, CPR, and color indicator chart. **2.** Fill the tube with soil sample to scratch the mark **3.** Add twelve (12) drops of CPR pH indicator dye. **4.** Mix by gently swirling the test tube 20 times **5.** Repeat step three (3) after about two (2) minutes and let the test tube stand for five (5) minutes **6.** To get the pH of the soil with the corresponding color chart of the pH indicator dye used. **7.** If the soil pH used to or greater than six (6) repeat steps 1 to 5 using BCG instead of CPR. **8.** Record the acquired data **9.** Wash test tubes with tap water then rinse with distilled water. **10.** Repeat all the steps for each soil samples. · **Determining soil Potassium level** **1.** Using the Soil Test Kit, layout all the materials needed in the conduct of the Soil Potassium test such as test tubes, K, K1, K2. **2.** Fill the test tube up to the scratch mark with soil sample. **3.** Add 24 drops (or 1 ml) as solution K and 8 drops of solution K1. **4.** Mix well by gently swirling the tube for about 1 minute. **5.** Repeat step 3 after about 3 minutes and let stand for 5 minutes or until the soil particles have settled at the bottom of the tube. **6.** Add solution K2 as follows: **A.** Slowly insert the dropper containing 0.6 ml of solution K2 inside the test tube so that its tip is about 2 cm above the solution. **B.** Slowly add 12 drops of K2 one drop at a time **C.** Do not mix or shake the solution. **7.** Let it stand for 2 minutes. Then observe the appearance of a cloudy yellow layer on top of the orange solution. A distinct cloudy yellowish layer indicates that the soil has sufficient available potassium. There is no need to apply potassium fertilizer. **8.** If no distinct cloudy yellowish layer appears on top of the orange solution, the soil is deficient in available potassium. Refer to the table on fertilizer recommendation for different crops. **9.** Record the acquired data. **10.** Repeat all the steps for every soil sample · **Soil Phosphorus Test** **1.** Using the Soil Test Kit, layout all the materials needed in the conduct of the Soil Phosphorus test such as test tubes, P, P1, and color indicator chart. **2.** Fill the test tube with the soil sample up to the scratch mark. **3.** Add 24 drops (or 1 ml) of solution P and 4 drops of solution P1. **4.** Mix well by gently swirling the tube for about 1 minute. **5.** Repeat step 3 after about 3 minutes and let the test tube stand for 3 minutes. **6.** Take one foil or tin strip and wrap it firmly at one end of the plastic stick. **7.** Without disturbing the soil, stir the solution slowly with the tin strip for 1 minute. Repeat the step for about 2 minutes. (Note: The tin strip attached to the plastic can be still used for another set of four samples provided that the analyses are done on the same day. Rinse the tin strip with distilled water after each analysis.) **8.** Match the blue color intensity of the solution with the color chart below and take note if the soil is low, medium or high in available phosphorus. **9.** Refer to the table on fertilizer recommendations for each crop. **10.** Wash the test tube with tap water and then rinse with distilled water. **11.** Record the acquired data **12.** Repeat all the steps for every soil samples. · **Soil Nitrogen Test** **1.** Using the Soil Test Kit, layout all the materials needed in the conduct of the Soil Nitrogen test such as test tubes, N solution, and color indicator chart. **2.** Fill the test tube with soil sample up to the scratch mark. **3.** Add 24 drops (1 ml) of solution N. **4.** Mix well by gently swirling the test tube 30 times. **5.** Repeat step 3 after about 5 minutes and let the tube stand for 30 minutes. **6.** Match the color of the resulting solution on top of the soil with the color chart below and take note if the soil is low, medium, or high in available nitrogen. **7.** Refer to the table on fertilizer recommendation for different crops. **8.** Wash the test tube with tap water and then rinse with distilled water. **9.** Record the acquired data. **10.** Repeat all the steps for every soil layer sample. **IV. Determining Soil Biological Characteristics** · **Describing soil pores** **1.** Observe visible roots present in every layer of the soil **2.** Measure the diameter of each roots present in every layer of the soil **3.** Categorize the measured roots by setting range of sizes from small, medium and large. (e.g. small 0.005-0.01, medium 0.02-0. 09 , large 0.1-0.5) **4.** Record and tabulate data.
 @OverThinker
Heat Capacities **I. Introduction** Heat capacity is a term in physics that describes how much heat must be added to a substance to raise its temperature by 1 degree Celsius. This is related to, but distinct from, specific heat, which is the amount of heat needed to raise exactly 1 gram (or some other fixed unit of mass) of a substance by 1 degree Celsius. Deriving a substance's heat capacity C from its specific heat S is a matter of multiplying by the amount of the substance that is present and making sure you are using the same units of mass throughout the problem. Heat capacity, in plain terms, is an index of an object's ability to resist being warmed by the addition of heat energy. **I. Pre-test** 1. The specific heat capacity of aluminum is 0.897 J/g°C. Determine the amount of heat released when 10.5g of aluminum cools from 240°C to 25°C. 2. The specific heat capacity of aluminum is 0.897 J/g°C. What mass of aluminum can be heated from 33°C to 99°C using 450J of heat? 3. 84.0g of a metal are heated to 112ºC, and then placed in a coffee cup calorimeter containing 60.0g of water at 32ºC. The final temperature in the calorimeter is 42ºC. What is the specific heat of the metal? 4. Determine the amount of heat needed to raise the temperature of 15.0g of lead from 22°C to 68°C. The specific heat capacity of lead is 0.13 J/g°C. 5. What mass of water can be heated from 15°C to 75°C using 6500J of heat? The specific heat of water is 4.18 J/g°C. 6. What mass of lead can be heated from 23°C to 44°C using 125J of heat? The specific heat capacity of lead is 0.129 J/g°C. 7. When 32.0g of a substance cools from 85°C to room temperature (25°C), 2400J of heat are released. Find the specific heat capacity of the substance. 8. A 16-g piece of iron absorbs 1090 joules of heat energy, and its temperature changes from 25ºC to 175ºC. Calculate the heat capacity of iron. 9. How many joules of heat are needed to raise the temperature of 10.0 g of aluminum from 22ºC to 55ºC, if the specific heat of aluminum is 0.90 J/gºC? 10. To what temperature will a 50.0 g piece of granite raise if it absorbs 5275 joules of heat and its heat capacity is 0.50 J/gºC? The initial temperature of the granite is 20.0ºC. **II. Discussion** **Heat Capacities of Gases** The basis of our analysis is that heat is energy in transit. When we add heat to a substance, we are increasing its molecular energy. In this discussion the volume of the gas will remain constant so that we don’t have to worry about energy transfer through mechanical work. If we were to let the gas expand, it would do work by pushing on moving walls of its container, and this additional energy transfer would have to be included in our calculations. For now, with the volume held constant, we are concerned with the molar heat capacity at constant volume. In the simple kinetic-molecular model, the molecular energy consists only of the translational kinetic energy of the pointlike molecules. This energy is directly proportional to the absolute temperature T. When the temperature changes by a small amount dT, the corresponding change in kinetic energy is Ktr= 3/2 nRT. When the temperature changes by a small amount dT, the corresponding change in kinetic energy is From the definition of molar heat capacity at constant volume, we also have where dQ is the heat input needed for a temperature change dT. Now if Ktr represents the total molecular energy, as we have assumed, then dQ and dKtr must be equal. This surprisingly simple result says that the molar heat capacity at constant volume is 3R/2 for any gas whose molecules can be represented as points. For comparison, Table 18.1 gives measured values of for several gases. We see that for monatomic gases our prediction is right on the money, but that it is way off for diatomic and polyatomic gases. This comparison tells us that our point-molecule model is good enough for monatomic gases but that for diatomic and polyatomic molecules we need something more sophisticated. For example, we can picture a diatomic molecule as two point masses, like a little elastic dumbbell, with an interaction force between the atoms of the kind shown in Fig. 18.8. Such a molecule can have additional kinetic energy associated with rotation about axes through its center of mass. The atoms may also have vibrating motion along the line joining t hem, with additional kinetic and potential energies. When heat flows into a monatomic gas at constant volume, all of the added energy goes into an increase in random translational molecular kinetic energy. But when the temperature is increased by the same amount in a diatomic or polyatomic gas, additional heat is needed to supply the increased rotational and vibrational energies. Thus polyatomic gases have larger molar heat capacities than monatomic gases, as Table 18.1 shows. But how do we know how much energy is associated with each additional kind of motion of a complex molecule, compared to the translational kinetic energy? The new principle that we need is called the principle of **equipartition of energy**. It can be derived from sophisticated statistical-mechanics considerations; that derivation is beyond our scope, and we will treat the principle as an axiom. The principle of equipartition of energy states that each velocity component (either linear or angular) has, on average, an associated kinetic energy per molecule of or one-half the product of the Boltzmann constant and the absolute temperature. The number of velocity components needed to describe the motion of a molecule completely is called the number of **degrees of freedom**. For a monatomic gas, there are three degrees of freedom (for the velocity components and this gives a total average kinetic energy per molecule of 3(1/2 kT )consistent with Eq. (18.16). For a diatomic molecule there are two possible axes of rotation, perpendicular to each other and to the molecule’s axis. (We don’t include rotation about the molecule’s own axis because in ordinary collisions there is no way for this rotational motion to change.) If we assign five degrees of freedom to a diatomic molecule, the average total kinetic energy per molecule is instead of The total kinetic energy of n moles is and the molar heat capacity (at constant volume) is This agrees within a few percent with the measured values for diatomic gases given in Table 18.1. Vibrational motion can also contribute to the heat capacities of gases. Molecular bonds are not rigid; they can stretch and bend, and the resulting vibrations lead to additional degrees of freedom and additional energies. For most diatomic gases, however, vibrational motion does not contribute appreciably to heat capacity. The reason for this is a little subtle and involves some concepts of quantum mechanics. Briefly, vibrational energy can change only in finite steps. If the energy change of the first step is much larger than the energy possessed by most molecules, then nearly all the molecules remain in the minimum-energy state of motion. In that case, changing the temperature does not change their average vibrational energy appreciably, and the vibrational degrees of freedom are said to be “frozen out.” In more complex molecules the gaps between permitted energy levels are sometimes much smaller, and then vibration does contribute to heat capacity. The rotational energy of a molecule also changes by finite steps, but they are usually much smaller; the “freezing out” of rotational degrees of freedom occurs only in rare instances, such as for the hydrogen molecule below about 100 K. In Table 18.1 the large values of Cv for some polyatomic molecules show the contributions of vibrational energy. In addition, a molecule with three or more atoms that are not in a straight line has three, not two, rotational degrees of freedom. From this discussion we expect heat capacities to be temperature-dependent, generally increasing with increasing temperature. Figure 18.19 is a graph of the temperature dependence of for hydrogen gas showing the temperatures at which the rotational and vibrational energies begin to contribute. **Heat Capacities of Solids** We can carry out a similar heat-capacity analysis for a crystalline solid. Consider a crystal consisting of N identical atoms (a monatomic solid). Each atom is bound to an equilibrium position by interatomic forces. The elasticity of solid materials shows us that these forces must permit stretching and bending of the bonds. We can think of a crystal as an array of atoms connected by little springs (Fig. 18.20). Each atom can vibrate about its equilibrium position. Each atom has three degrees of freedom, corresponding to its three components of velocity. According to the equipartition principle, each atom has an average kinetic energy of for each degree of freedom. In addition, each atom has potential energy associated with the elastic deformation. For a simple harmonic oscillator (discussed in Chapter 14) it is not hard to show that the average kinetic energy of ½ kT an atom is equal to its average potential energy. In our model of a crystal, each atom is essentially a three-dimensional harmonic oscillator; it can be shown that the equality of average kinetic and potential energies also holds here, provided that the “spring” forces obey Hooke’s law. Thus we expect each atom to have an average kinetic energy 3/2 kT and an average potential energy or an average total energy 3kT per atom. If the crystal contains N atoms or n moles, its total energy is At low temperatures, the heat capacities of most solids decrease with decreasing temperature (Fig. 18.21) for the same reason that vibrational degrees of freedom of molecules are frozen out at low temperatures. At very low temperatures the quantity kT is much smaller than the smallest energy step the vibrating atoms can take. Hence most of the atoms remain in their lowest energy states because the next higher energy level is out of reach. The average vibrational energy per atom is then less than 3kT, and the heat capacity per molecule is less than 3k. At higher temperatures when kT is large in comparison to the minimum energy step, the equipartition principle holds, and the total heat capacity is 3k per molecule or 3R per mole as the Dulong and Petit rule predicts. Quantitative understanding of the temperature variation of heat capacities was one of the triumphs of quantum mechanics during its initial development in the 1920s. **I. Post-Test** 1. It takes 487.5 J to heat 25 grams of copper from 25 °C to 75 °C. What is the specific heat in Joules/g·°C? https://www.thoughtco.com/copper-facts-chemical-and-physical-properties-606521 2. Calculate the amount of heat released when 7.40 g of water cools from 49° to 28°C. 3. A 500 gram cube of lead is heated from 25 °C to 75 °C. How much energy was required to heat the lead? The specific heat of lead is 0.129 J/g°C. 4. A 25-gram metal ball is heated 200 °C with 2330 Joules of energy. What is the specific heat of the metal? 5. A hot 1 kg chunk of copper is allowed to cool to 100°C. If the copper gave off 231 kJ of energy, what was the initial temperature of the copper? The specific heat of copper is 0.385 J/g°C. 6. A 15.0g15.0g piece of cadmium metal absorbs 134J134J of heat while rising from 24.0oC24.0oC to 62.7oC62.7oC. Calculate the specific heat of cadmium. 7. What quantity of heat is transferred when a 150.0 g block of iron metal is heated from 25.0°C to 73.3°C? What is the direction of heat flow? 8. A 10.3 g sample of a reddish-brown metal gave off 71.7 cal of heat as its temperature decreased from 97.5°C to 22.0°C. What is the specific heat of the metal? 9. The specific heat capacity of aluminum is 0.897 J/g°C. Determine the amount of heat released when 10.5g of aluminum cools from 240°C to 25°C. 10. The specific heat capacity of aluminum is 0.897 J/g°C. What mass of aluminum can be heated from 33°C to 99°C using 450J of heat? **SOLUTIONS(Post-Test)** **1**. It takes 487.5 J to heat 25 grams of copper from 25 °C to 75 °C. What is the specific heat in Joules/g·°C? Solution: Use the formula q = mcΔT where q = heat energy m = mass c = specific heat ΔT = change in temperature Putting the numbers into the equation yields: 487.5 J = (25 g)c(75 °C - 25 °C) 487.5 J = (25 g)c(50 °C) Solve for c: c = 487.5 J/(25g)(50 °C) c = 0.39 J/g·°C **Answer:** **The specific heat of copper is 0.39 J/g·°C.** ***2.*** *Calculate the amount of heat released when 7.40 g of water cools from 49° to 28°C.* q = m × C × ΔT q = 7.40 g × 4.184 J/g∙°C × (28°C – 49°C) q = 7.40 g × 4.184 J/g∙°C × (-21°C) **q = -6.5×10² J** **3**. Question: A 500 gram cube of lead is heated from 25 °C to 75 °C. How much energy was required to heat the lead? The specific heat of lead is 0.129 J/g°C. Solution: First, let’s the variables we know. m = 500 grams c = 0.129 J/g°C ΔT = (Tfinal – Tinitial) = (75 °C – 25 °C) = 50 °C Plug these values into the specific heat equation from above. Q = mcΔT Q = (500 grams)·(0.129 J/g°C)·(50 °C) Q = 3225 J **Answer: It took 3225 Joules of energy to heat the lead cube from 25 °C to 75 °C.** **4**. A 25-gram metal ball is heated 200 °C with 2330 Joules of energy. What is the specific heat of the metal? Solution: List the information we know. m = 25 grams ΔT = 200 °C Q = 2330 J Place these into the specific heat equation. Q = mcΔT 2330 J = (25 g)c(200 °C) 2330 J = (5000 g°C)c Divide both sides by 5000 g°C **c = 0.466 J/g°C** **Answer: The specific heat of the metal is 0.466 J/g°C.** **5**. Question: A hot 1 kg chunk of copper is allowed to cool to 100°C. If the copper gave off 231 kJ of energy, what was the initial temperature of the copper? The specific heat of copper is 0.385 J/g°C. Solution: List our given variables: m = 1 kg Tfinal = 100 °C Q = -231 kJ (The negative sign is because the copper is cooling and losing energy.) c = 0.385 J/g°C We need to make our units consistent with the specific heat units, so let’s convert the mass and energy units. m = 1 kg = 1000 grams 1 kJ = 1000 J Q = -231 kJ · (1000 J/kJ) = -231000 J Plug these values into the specific heat formula. Q = mcΔT -231000 J = 1000 g · (0.385 J/g°C) · ΔT -231000 J = 385 J/°C · ΔT ΔT = -600 °C ΔT = (Tfinal – Tinitial) Plug in the values for ΔT and Tfinal. -600 °C = (100 °C – Tinitial) Subtract 100 °C from both sides of the equation. -600 °C – 100 °C = – Tinitial -700 °C = – Tinitial **Tinitial = 700 °C** **Answer: The initial temperature of the copper chunk was 700 °C.** **6.** A 15.0g15.0g piece of cadmium metal absorbs 134J134J of heat while rising from 24.0oC24.0oC to 62.7oC62.7oC. Calculate the specific heat of cadmium. **Solution:** *Step 1: List the known quantities and plan the problem.* **Known** Heat =q=134J=q=134J Mass =m=15.0g=m=15.0g ΔT=62.7oC−24.0oC=38.7oCΔT=62.7oC−24.0oC=38.7oC **Unknown** cpcp of cadmium =?J/goC=?J/goC The specific heat equation can be rearranged to solve for the specific heat. *Step 2: Solve.* cp=qm×ΔT=134J15.0g×38.7oC=0.231J/goC(3.12.2)(3.12.2)cp=qm×ΔT=134J15.0g×38.7oC=0.231J/goC *Step 3: Think about your result.* The specific heat of cadmium, a metal, is fairly close to the specific heats of other metals. The result has three significant figures. Since most specific heats are known (Table 3.12.13.12.1), they can be used to determine the final temperature attained by a substance when it is either heated or cooled. Suppose that a 60.0g60.0g of water at 23.52oC23.52oC was cooled by the removal of 813J813J of heat. The change in temperature can be calculated using the specific heat equation. Since the water was being cooled, the temperature decreases. The final temperature is: **Tf=23.52oC−3.24**°C **=20.28**°C 7. What quantity of heat is transferred when a 150.0 g block of iron metal is heated from 25.0°C to 73.3°C? What is the direction of heat flow? **SOLUTION** We can use heat = *mc*Δ*T* to determine the amount of heat, but first we need to determine Δ*T*. Because the final temperature of the iron is 73.3°C and the initial temperature is 25.0°C, Δ*T* is as follows: Δ*T* = *T*final − *T*initial = 73.3°C − 25.0°C = 48.3°C The mass is given as 150.0 g, and Table 7.3 gives the specific heat of iron as 0.108 cal/g•°C. Substitute the known values into heat = *mc*Δ*T* and solve for amount of heat: **SOLUTION** The question gives us the heat, the final and initial temperatures, and the mass of the sample. The value of Δ*T* is as follows: Δ*T* = *T*final − *T*initial = 22.0°C − 97.5°C = −75.5°C If the sample gives off 71.7 cal, it loses energy (as heat), so the value of heat is written as a negative number, −71.7 cal. Substitute the known values into heat = *mc*Δ*T* and solve for *c*: −71.7 cal = (10.3 g)(*c*)(−75.5°C) **9. The specific heat capacity of aluminum is 0.897 J/g°C. Determine** the amount of heat released when 10.5g of aluminum cools from 240°C to 25°C. H = m x (sh) x ΔT = 10.5g (0.897 J/g°C) (215) = **2024.98 J** **10.** The specific heat capacity of aluminum is 0.897 J/g°C. What mass of aluminum can be heated from 33°C to 99°C using 450J of heat? H = m x (sh) x ΔT 450 J = m (0.897 J/g°C) (66) **7.6g = m**


+16 more
@OverThinker
Processing Operations and Industry Situationer of Papaya (Carica papaya) Leaves **INTRODUCTION** *Carica papaya*, which comes from Caricaceae family, is native to eastern Central America and was cultivated long before the arrival of the Europeans; Spanish and Portuguese invaders took the fruit and quickly spread it to their other settlements. "Papaya" is the most widely cultivated and best known species. It is cultivated nearly all over the tropics and subtropics for its luscious fruits and source of commercial papain, an enzyme, with pronounced proteolytic activity, valuable in the pharmaceuticals, cosmetics and textile industry. Papaya is a fast-growing, short-lived, single-stemmed small tree, 2-10 m tall, with a straight, cylindrical, soft hollow gray trunk roughened by large leaves and scars of inflorescence. Papaya leaves contain phenolic compounds papain and alkaloids that act as strong antioxidants which, in turn, enhance the immunity of the body. It is widely used due to its medicinal properties. Leaves of this plant have been used by various indigenous populations. Several studies have found that papaya extract has improved the number of platelets in dengue patients. Papaya leaves have been successfully used in folk medicine for the prevention of dengue infections by palm oil suspensions of powdered leaves. The leaf may potentially serve as a good therapeutic agent for protection against gastric ulcer and oxidative stress (IJPPR, 2014). Various experiments have been carried out on the use of the different portions of Papaya tree in the search of human wellbeing and wellness. Various researchers have concentrated on the use of Papaya leaves for organic tea production and food supplements. A number of government departments are specifically using Papaya leaves to fulfill particular objectives. Papaya leaf has a numberless of benefits. In some parts of Asia, the young leaves of the papaya are steamed and eaten like spinach. Fresh, green papaya leaf is an antiseptic, whilst the brown, dried papaya leaf is the best as a tonic and blood purifier (Atta, 1999). Recent reports have claimed possible beneficial effects of papaya leaf juice in treating patients with dengue viral infections (Yunita et al., 2012). The extracts of both the leaves and fruit are known to contain several proteins and alkaloids with important pharmaceutical, medical, and industrial applications. Interestingly, papaya fruit juice and leaf extract have demonstrated anti-cancer (Rahmat et al., 2002). In a recent study it is found that, the powder from papaya leaves has substances responsible for the release and production of thrombocytes/platelets (Sathasivam et al., 2009). The increasing intake of herbal tea made from raw Papaya leaves (Carica papaya L.) is now recognized for its importance to human health and lifestyle. People who want to follow a healthier lifestyle tend to minimize the consumption of fast food drinks and to prefer healthier drinks such as herbal teas. In addition, the health and wellness food industry is rising due to an increasing number of people with health problems. Consumer preferences for more unprocessed food lead to a huge appetite for organic ingredients, such as herbal tea. In USA, almost 80 percent of the household drinks tea whether it is consumed as hot or iced cold. In 2016, almost 84 billion serving of tea or more than 3.8 billion gallons were consumed (Tea Association of the USA, 2016). Development comes from all sectors led by diversity, simplicity, health benefits, affordability, affordability, increased creativity and the discovery of exclusive, tasty and high-quality specialty teas. Despite the strong prospects for the market for herbal teas, the conventional method of processing these products is still practiced. In the case of papaya leaves, the dried leaves are ground or turned into powder by means of mortar and pestle, a local grain grinder or by rubbing the dried leaves against a thin screen. Papaya Leaves powder is considered a natural multivitamin supplement. Papaya dried leaves pulverized into fine powder has a fine grain size and can be converted into organic papaya leaves tea. Microwave process, infrared, lyophilization process, oven drying or convection drying, solar drying and shadow drying are various techniques used to dry papaya leaves. The general term size reduction includes the mechanical cutting, shearing, crushing, grinding and milling of dried papaya leaves. Without making a big difference in the chemical properties of the material, these procedures reveal more surface space for digestion. Around the same time, the removal of scales facilitates uniform mixing. And while uniformity in the size and shape of the reduced particles is generally expected, it is rarely obtained. With a lack of pulverizing technology, farmers are facing weak agricultural productivity and lower income prospects, resulting in a deliberate increase in the demand for manufactured goods. (ECHO,2007). The manufacturing of organic powdered products offers a simpler way of promoting the powder of papaya leaves and maintaining a balanced lifestyle. Processing them into powder can help to improve the living conditions of laborers, processors and farmers by earning extra income. The extension of production for both domestic and export markets could also be of benefit. In addition, demand for goods purchased by health-conscious customers may be targeted. **Processing Operations and Product Standards of Papaya Leaves** The growing interest and growing use of herbal products as herbal medicines has stimulated the need for control. Significant attention must be paid to the essence and features of herbal drugs in the light of statutory requirements and procedures. (World Health Organisation Western Pacific Regional Office, 1997). Changes to other areas of the industry, such as organic tea, should also be promoted and the health advantages of tea consumption should be used more widely to support usage in both producing and importing countries. However, knowledge of and compliance with food protection and quality requirements is important in reaching future growth markets. The herbal tea powder is processed for human consumption. It is produced by grinding the dried leaves into fine particles. The process is shown in Figure 1 consists of four stages: harvesting of leaves, drying, grinding and packaging. Even before current period, the Philippines did not have standard varieties of papaya leaves. **Industry Situationer** Over the last decades, organic food goods have been the most natural alternative to traditional food consumption. Of the many organic food qualities that consumers identify in organic food, wellbeing has been identified as the primary reason to purchase organic-certified products. The changing customer purchasing habits, increasing customer worries about health, the atmosphere and animal welfare, along with their ability to pay high prices for healthier food, are fuelling demand for organic food and beverage products in the Asia-Pacific region. Huge corporations see this as an advantage that has a beneficial impact as a result of the growing demand in the local and global industries. Major industry participants competed in terms of growing, selling and spending in the production of papaya powder and its by-products. **Organic Tea Industry** Tea is the second most commonly consumed drink in the world, after water. There are several types of teas, based on their oxidation: green, yellow, oolong and black. Well recognized varieties of black tea include Darjeeling, Assam, Turkish and Ceylon teas. This fragrant beverage emerged in 2737 BC in China. According to tradition, the Chinese emperor was seated under the tree of Camellia Sinensis, while his servant boiled drinking water. The wind blows some leaves from the tree into the bath, and the emperor wanted to try the drink that his servant had mistakenly made. This fragrant drink emerged in China in 2737 BC. According to the story, the Chinese emperor stood under the tree of Camellia sinensis while his servant boiled drinking water. The wind blows some leaves from the tree into the bath, and the emperor wanted to try the drink that his servant had made by mistake. The tea community had been developed in China for many centuries before it had come to the West. Tea drinking was introduced in Japan in the late eighth century and became an important part of Japanese society. Tea is regarded as one of the country's cultural drinks in the United Kingdom. Tea is also a popular drink in Middle Eastern cultures. In 2016, Turkey was the highest tea-consuming country in the world, with per capita tea intake of about 6.96 pounds per year. On the other hand, China had an annual intake of 1.25 pounds per person. In 2015, China was the world's top producer of tea, followed by India and Kenya. Around 5.2 million metric tons of teas were produced worldwide that year. The production of tea in the Philippines is not yet widespread. However, herbal tea is a popular beverage in the Philippines produced by the spread or boiling of herbs, spices, fruits, etc. It is believed that herbal teas support to improve the mind and body and encourage a person's general well-being. The most popular herbal teas on the market are malunggay, ginger, banaba, guyabano, ampalaya and pito-pito. People are actually seeking better health and more fresh food, which is why this would be a huge opportunity for the tea industry. In order to help trends in the tea industry, more investigation and analysis is needed to recognize market needs and produce the right product. **Processing Technologies** Several innovations have been patented for fast and comfortable production of pulverized and formed products, such as herbal teas and organic sweeteners. Traditional manufacturing processes are increasingly being replaced by emerging developments. Popular herbal tea processing processes were the use of mortar and pestle, wheel press, water mill and animal mill (horse mill). Mortar and pestle is a tool used in the West-African countryside. In this method, the crushing mortar is disrupted by many sievings that allow the processing of a range of different products, from meal to the finest flours. Its efficiency is the advantage of this system. In the other side, the process of the wheel mill (original of the Neolithic period) uses a flat stone slab as well as a grinding stone. The hand-operated wheel is used to grind grains deposited on the slab. Two or three loops of the wheel are enough to get a meal of food that eventually comes out of the slab. This is a form that is still used in rural parts in East Africa. In the case of papaya leaves, the dried leaves are ground or turned into powder by means of mortar and pestle, a local grain grinder or by rubbing the dried leaves against a thin screen. Papaya Leaves powder is considered a natural multivitamin supplement. Papaya dried leaves pulverized into fine powder has a fine grain size and can be converted into organic papaya leaves tea. Microwave process, infrared, lyophilization process, oven drying or convection drying, solar drying and shadow drying are various techniques used to dry papaya leaves. **Existing Technology** The devolved nature of organic tea production in the country has made it difficult to ascertain due to the traditional production processes used. In view of this matter, the traditional methods were adapted into modernized processes in producing valued products. Throughout the years, several pulverizing machines were invented. Developing countries such as the USA, China, and Japan are the leading manufacturers of improved processing technologies for this particular industry. In the Philippine, the modernized machinery is not yet competitive due to the lack of processing facilities and the unavailability of processing machines in different areas. Thus, the processors need to upgrade their processing technology and standard operating parameters to be able to cope with the increasing demand in both local and export markets for these particular by-products. If the herbal and organic sugar industry is rapidly growing due to consumers’ awareness, the local producers should upgrade their processing technologies in order to produce quality nutritious products. **References** Dev et al (2014). **Processing and Quality Evaluation of Green Papaya (Carica** **papaya L.) Leaf Tea.** Retrieved from ***http://www.jakraya.com/journal/pdf/3-jacsArticle_1.pdf*** Nafiu et al (2019). **Papaya (Carica papaya L., Pawpaw).** Retrieved from ***https://www.sciencedirect.com/topics/agricultural-and-biological-*** ***sciences/*** ***carica-papaya*** Ugo et al (2019). **Nutrient Composition of Carica Papaya Leaves Extracts.** Retrieved *from* ***http://www.fortunejournals.com/articles/nutrient-composition-of-carica-papaya-leaves-extracts.pdf*** Chua, G. (2018). **The Philippines Fresh Papaya Export Value Chain.** Retrieved from ***https://cpb-ap-se2.wpmucdn.com/blog.une.edu.au/dist/4/1340/files/2018/03/AAP-Vol-21-Paper-7-Chua-2nz75wa.pdf*** The Philippines Recommends for Papaya Committee 2005. **The Philippines recommends for papaya. Los Baños, Laguna: PCARRD-DOST, 2006**. 91p. – (Philippines Recommends Series No. 27-C). Rizzo et al (2020). **Organic Food Consumption: The Relevance of the Health** **Attribute.** Retrived from ***https://www.mdpi.com/2071-1050/12/2/595/pdf*** Juárez-Rojop IE, et al. **Hypoglycemic effect of Carica papaya leaves in streptozotocin-** **induced diabetic rats.BMC Complement Altern Med. 2012** Nov 28;12:236 Sudhakar N, Vidhya (2014) **TRM Potential medicinal properties of carica papaya** **linn.- A mini review.** International Journal of Pharmacy and Pharmaceutical Sciences 6(2): 1-4 Yogiraj V, et. al (2014). **Carica papaya Linn: An Overview. International Journal** **Herbal Medicine** 2(5): 1-8 Isa, M. (2010). **Extraction Of Papain Enzymes From Papaya Leaves.** Retrieved from ***http://umpir.ump.edu.my/id/eprint/3422/1/CD5947_MASITA_MAT_ISA_X.pdf*** Campostrini, E. (2018). **Environmental Factors Controlling Carbon Assimilation,** **Growth, and Yield of Papaya (Carica papaya L.) Under Water-Scarcity Scenarios.** Retrieved from ***https://www.sciencedirect.com/*** ***science/article/pii/*** ***B9780128131640000193***
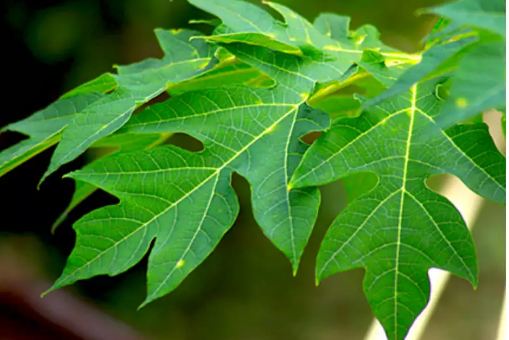
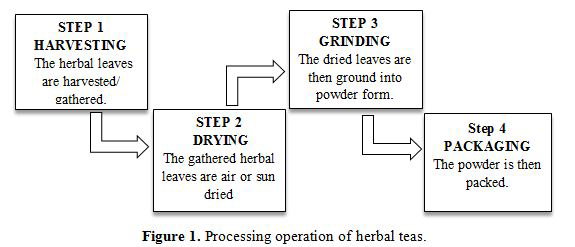
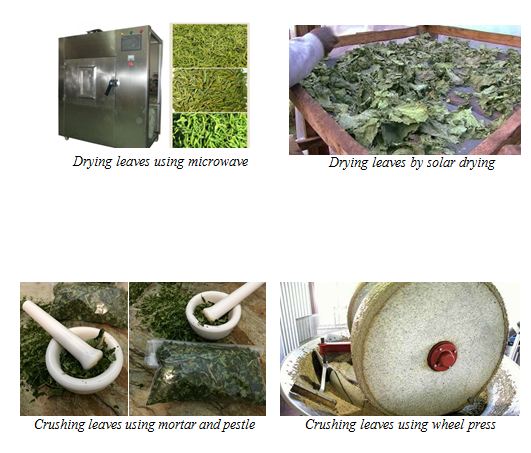 @OverThinker
Historical Antecedents that Changed the Course of Science and Technology Timeline showing the paradigm shifts Historical Antecedents that Changed the Course of Science and Technology **IMPORTANCE OF SCIENCE AND TECHNOLOGY** **Why is it important to study history of science and technology?** In the talk explained by Hannu Rajaniemi, a mathematical physicist, science innovator, and writer, entitled “The Big History of Modern Science”, he discussed his belief that science and technology are amongst the most important factors driving societal change and that modern physics is full of beautiful ideas that resonate with stories he would like to tell. Progress at some point is often related to technology and where there is progress in research, technology occurs. The research, technology, and growth are also equal to each other. Growth in every person to a nation is needed in all respects, and science and technology go hand in hand for growth to happen. Science is generally defined as the study of information which is translated into a method that relies on the interpretation which comprehension of evidence. Technology is simply the implementation of an understanding of science. **What are the implications of Science and Technology to society?** Science, technology and engineering are essential criteria for any prosperous society, especially in today's search for knowledge-based economies. If nations struggle to adopt science and technology, then the chances of improving themselves become negligible, and hence may even be listed as an undeveloped country. Science and technology have profoundly affected society, and its effect is on the rise. By fundamentally altering our ways connection, how we work, our shelter, clothes and food, our transport systems, and even the duration and also the quality of life itself, science has brought about improvements in morale values and fundamental human philosophies. Science has changed how we live, and what we believe, starting with the plow. Science has given man the ability to address social issues such as economics, architecture, schooling, and justice by making life easier; to build cultures; and to change the human circumstances. Yet it has also placed us in the special place that could destroy ourselves. It was also claimed by Hannu Rajaniemi that the observation of how the nucleus was made of protons and neutrons surrounding a cloud of electrons allowed use of Hiroshima and Nagasaki, in which atomic power and missiles were created that caused horrible things to happen. In addition, he clarified that what caused the major explosion was a small system called a transistor, which was designed by a team headed by William Shockley at Bells Laboratories in 1947. It's also the basic building block in computers. It can store 1 or 0 much like a nuclear bomb. I was struck by how seeing the large in the small and vice-versa of this stuff really put a lot of lives upside down. Until people with power understand that violence and devastation are not the means of achieving purposes, the capacity for such applications of disruptive technologies will still be a possible threat to the dignity of society , culture, and life on earth as we know it. He continued to address topics that I felt were minor but that played an significant role in our lives; such as how we assumed that only 2 percent of DNA was useful and rest was garbage, but now we've discovered that 98 percent of our DNA is actually the cell control mechanism. Without proper adoption of science and technology, no country will develop, and all those nations that were considered low-growth have proven where they stand today and this has happened only because of science and technology. **What pushed people to invent different technologies?** According to the well-known expression, "necessity is the mother of invention;" in other words, people create things because society has complicated issues that need to be overcome. There is some reality in this, but less than you would think. It would be more appropriate to claim that innovations work because they perform practical jobs that people know need to do. But in the first place, the motivations for innovations also have little or nothing to do with 'necessity,' particularly in the modern era, where practically any need we have is fulfilled with any number of current gadgets and machines.
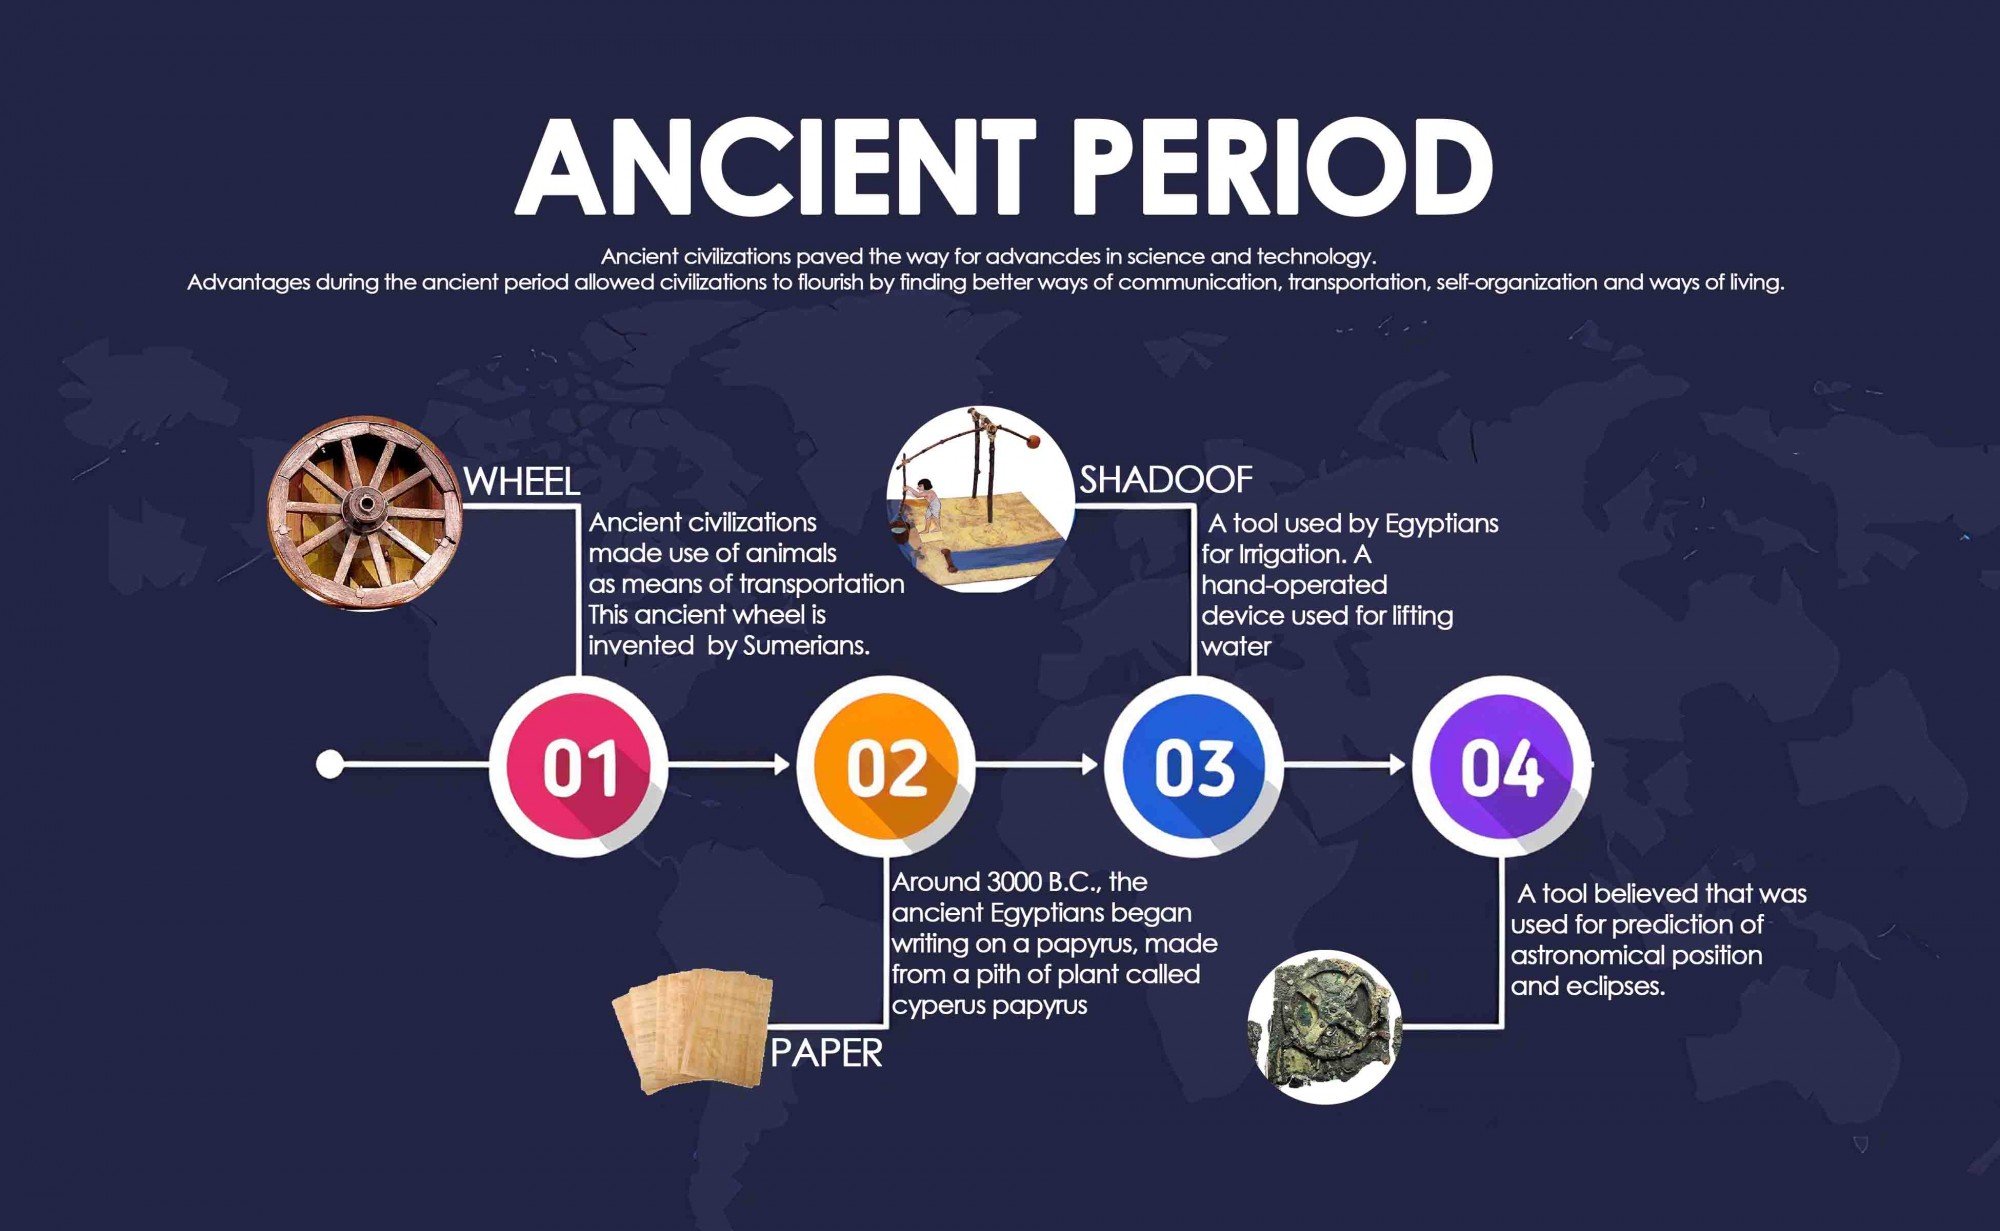
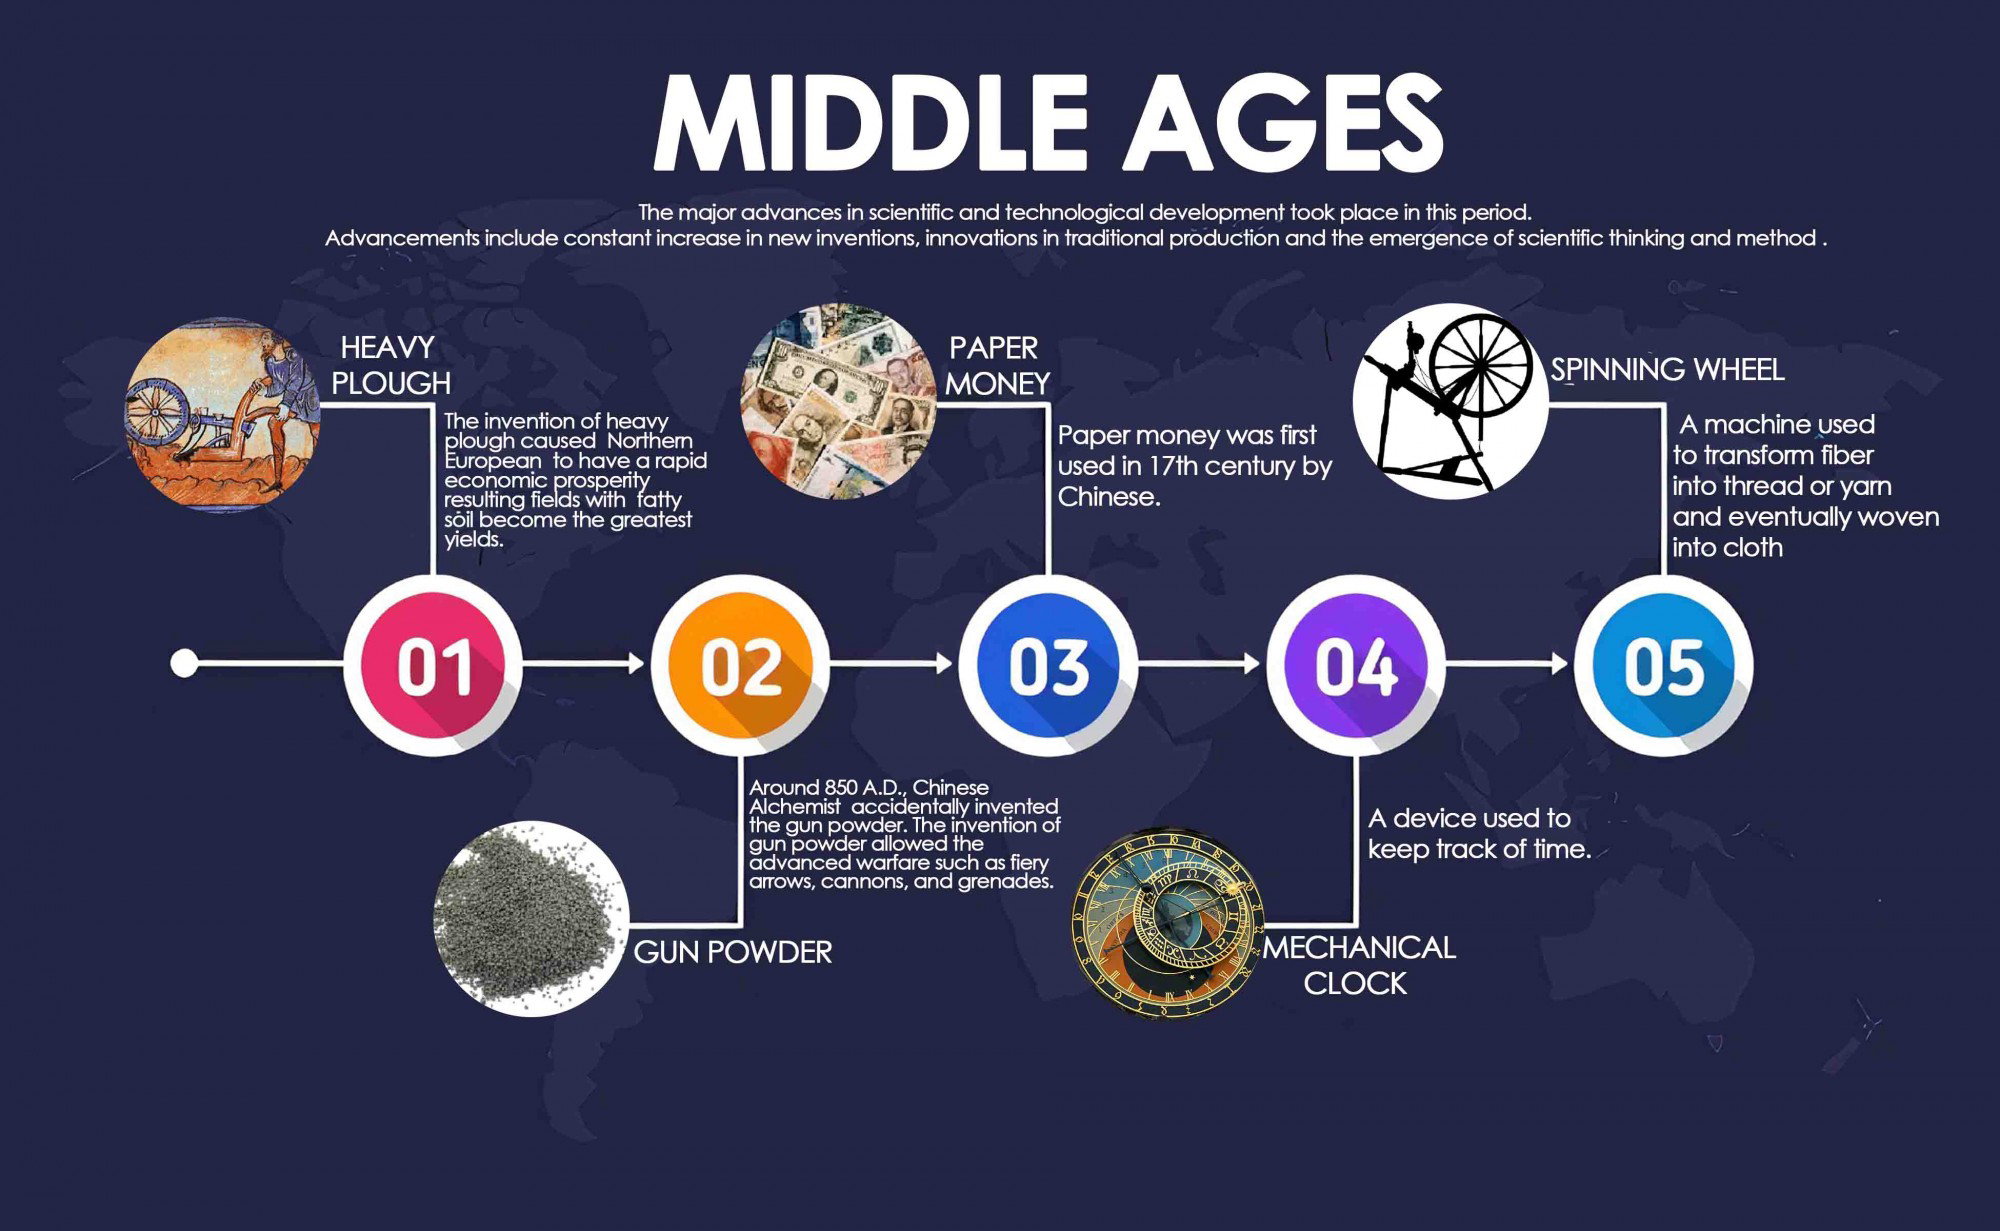
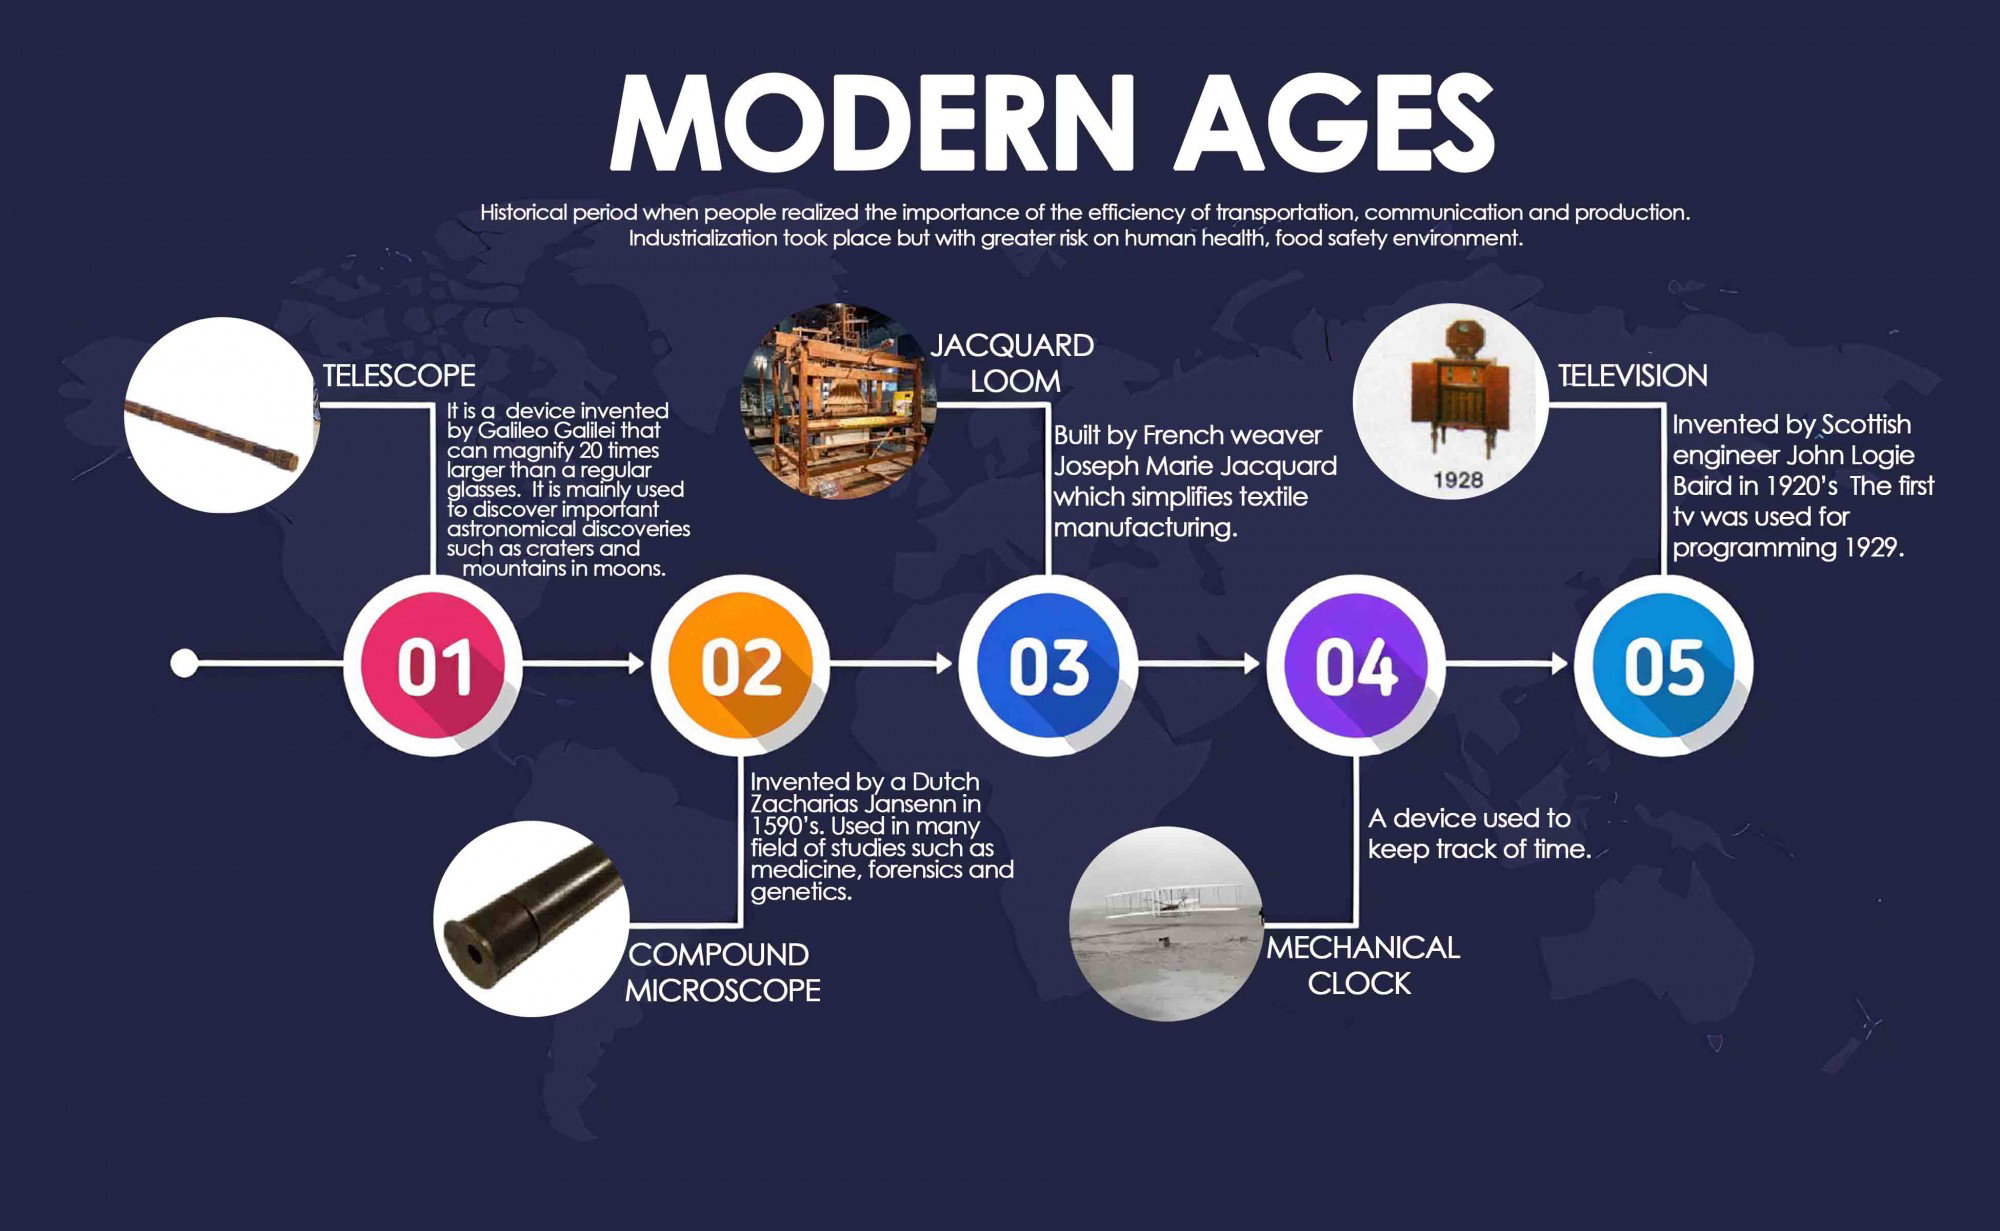 @OverThinker
Physical Properties of Papaya (Carica papaya) Leaves Health benefits from the use of naturally grown and plant-derived food and food products have earned a great deal of attention. This is due to the fact that these food products contain health-promoting nutrients and dietary phytochemicals, are considered to be an important tool for the treatment of body diseases and are believed to have no harmful effects on the biological system. *Carica papaya L.* is an herbaceous laticiferous plant commonly cultivated in the tropics as a food and cash crop. C. papaya cultivars have been developed to increase yield, fruit quality, and nutritional content. Native to tropical America and first introduced in the Philippines during the Spanish regime (1521–1898), papaya is a fast-growing, short-lived, single-stemmed, polygamous, arborescent herb that grows up to 10 m tall. Its trunk is usually cylindrical, hollow, 10-30 cm in diameter and roughened by large, prominent leaf, and inflorescence scars. Leaves are dark green, alternate, crowded at apex of trunk, long-petioled, 25–75 cm in diameter, and deeply lobed. Papaya grows best in light, well-drained, slightly acidic soils (pH 5.5–6.5) rich in organic matter. Plants grown on clay soils that lack good aeration are spindly and produce less fruits. Furthermore, those grown on low-lying areas where rain water accumulates and remains after heavy rains wilt and die due to root rot disease. Papaya is adapted to low and medium altitudes with warm weather and abundant rainfall. Growing temperature, ranging from 21ºC to 33ºC, is preferred. Areas with evenly distributed rainfall are ideal, although areas with a distinct dry season can also be used if provision for irrigation could be made. Papaya has been commonly used in traditional medicine for many diseases. Extracts of papaya leaves accelerate the rise of platelet counts and shorten the hospitalization time during dengue fever. (Yunita *et al*., 2012). Brown dried papaya leaves are best used as a tonic to help improve balance and reinforce structures as well as a blood purifier. It has the potential to clean the intestines that facilitate healthy digestion and helps to treat diseases such as overweight and obesity, arteriosclerosis, elevated blood pressure and weakness of the core. (Ayoola & Adeyeye, 2010). Papaya leaf can be used for the processing of green tea. Nwofia et al. (2012) referred that papaya leaf can be used for the preparation of tea and mentioned different medicinal values of papaya leaf tea. Aqueous extract of papaya leaf tea plays an important role as a tumor destroying agent. Papaya leaf tea is the most powerful anti-cancer agent. Doctors and researchers from US and Japan have discovered that enzymes found in papaya leaf tea have dramatic cancer fighting properties against a broad range of tumors. In a bid to promote good health and make a genuine effort in assisting the prevention of cancer papaya leaf tea is very effective (Otsuki et al., 2010). A recent study by Purdue University showed that Papaya Leaf Tea consists of over 50 active ingredients found to kill fungi, worms, parasites, bacteria, and many forms of cancer cells (McLaughlin, 2008). In addition to its long list of cancer fighting substances, papaya leaves boast large doses of important nutrients that support the immune system, including vitamins A, C, and E. Most importantly, it contains vitamin B-17, which in concentrated form is already used as part of traditional chemotherapy treatments. Papain, an important enzyme in papaya leaves is also a powerful digestive aid. It breaks down proteins naturally and eases the burden of digestion on the pancreas and stomach. Scientific research shows that papain is most active at higher tea temperatures. The papaya leaves were analyzed using standard method such as moisture content, protein, ash, fat (AOAC, 2005), Vitamin C content (Ranganna, 2004) while carbohydrate content was calculated by difference (Pearson, 1981). Proximate composition of fresh papaya leaves is shown in Table 1. **Table 1.** Proximate composition of fresh and dried papaya leaves. A one way analysis of variance (ANOVA) was carried out to analyze the color, flavor, taste and overall acceptability of papaya leaf tea. Then, Duncan’s Multiple Range Test (DMRT) was used to find significant differences between the sample if exist. The first judgment of any product is done by seeing. So, color is one of the most important sensory attributes which add to the aesthetic value of a product. Result (Table 3) shows that there was significant difference in color. The sample S2 secured the highest mean score (7.7) and ranked as ‘like moderately’. There was no significant difference of color between the samples S1 and S2. The samples S1 and S2 Secured 6.9 and 6.6 mean score respectively and both the samples were ranked as ‘like slightly’. Table 3: Mean scores for color, flavor, taste and overall acceptability of papaya leaf tea. *Mean values with the different alphabets in the column are significantly different at (p<0.05).* *Where, S1 = Papaya leaf tea of 1 minute brewing time, S2 = Papaya leaf tea of 2 minute brewing time, S3 = Papaya leaf tea of 5 minute brewing time* *Mean values with the different alphabets in the column are significantly different at (p<0.05).* *Where, S1 = Papaya leaf tea of 1 minute brewing time, S2 = Papaya leaf tea of 2 minute brewing time, S3 = Papaya leaf tea of 5 minute brewing time* Reference: Dev et al (2014). **Processing and Quality Evaluation of Green Papaya (Carica** **papaya L.) Leaf Tea.** Retrieved from ***http://www.jakraya.com/journal/pdf/3-jacsArticle_1.pdf***
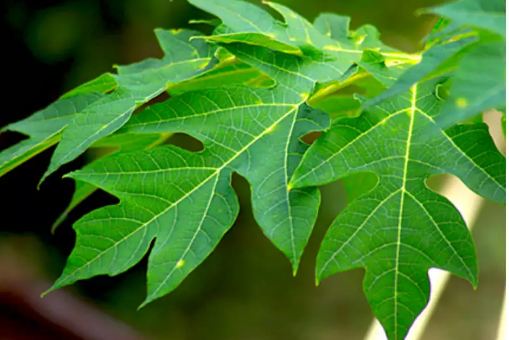
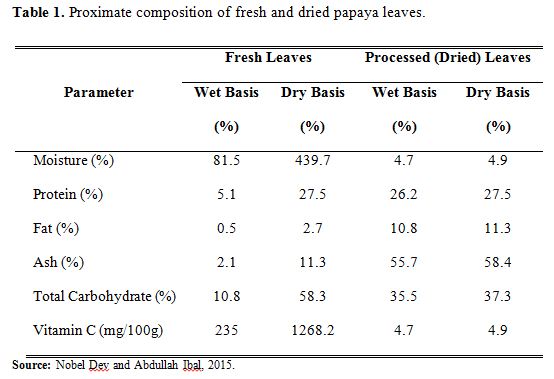
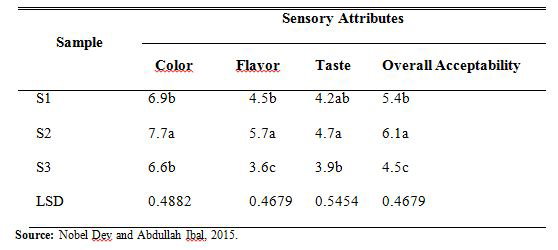 @OverThinker
Determining the Density and Porosity of Moringa oleifera Seed **INTRODUCTION** Moringa oleifera is native to certain parts of Africa and Asia and is the only genus in the Moringaceae family of flowering plants (Zaku et al., 2015). Moringa oleifera has been in use in traditional alternative medicine for many centuries to cure or prevent hundreds of illnesses (Aremu and Akintola, 2014). Moringa oleifera seeds contain a large amount of oil, known commercially as "Ben oil" or "Behen oil." Because of the evidence M. Oleifera is harvested and collected manually by hand picking, and in all the seeds harvested there are always unwanted materials which require the cleaning of the seeds. The structural properties of this AB material are significant for characterizing and predicting processed product quality. There is a need for further processing of the harvested seeds to establish engineering properties, such as physical, chemical and oil properties among others. The knowledge of these properties is highly relevant to agricultural engineers due to the increasing economic importance of food materials, together with the complexity of modern technology for their production, handling, storage, processing, preservation, value addition and utilization (Adebayo and Nwankwo, 2013). Among these, the most common structural properties are density and porosity. In addition to characterizing the product quality, these are critical parameters in process equipment design. They include the necessary information for the design of drying, storage, aeration and ventilation equipment for materials handling. A logical approach to agricultural machinery, equipment, and facilities design requires knowledge of the properties of the related agricultural product. The need for detailed information about its properties is important, since these properties influence the design and evaluation of the product's processing and handling. **METHODOLOGY** **I. Determination of solid density** The true or solid density can be defined as the ratio of a given mass of sample to its volume and was determined by using **water displacement method**. Weigh the desired quantity/sample of Moringa seeds using precision balance to get the mass. Next is by conducting the water displacement method by using a graduated cylinder and water. Fill the graduated cylinder with enough water to completely immerse the desired seed quantity. Record the baseline initial measurement of the water then drop the sample. Lastly, record the final measurement and subtract the initial volume from the final volume to acquire the volume. Displacement occurs when an object is largely immersed in a fluid, pushing it out of the way and taking its place. The volume of the fluid displaced can then be measured, and from this, the volume of the immersed object can be deduced (the volume of the immersed object will be exactly equal to the volume of the displaced fluid). The solid density was calculated using equation below. The test should be done in more replicates and get the mean value for a more precise data. **Determination of bulk density** Bulk density was determined by weighing the grains packed in a container of known volume. The container should be filled to the brim with the samples and gently taped many times for the samples to consolidate. The weights of the samples should be noted and the volume of the container should be estimated by filling with water, which was then poured into graduated measuring cylinders to determine the volume. The equation below was used to determine the bulk density of the grain sample. Where: ρb = Bulk density of the seeds (g/cm3) Mb= mass of seeds in the beaker (g) Vb= volume of beaker (cm3) **Determination of porosity** The porosity of the seeds will be calculated using the equation below. Where: ρb = bulk density (g/cm3 ) ρs = solid density (g/cm3 ) The bulk density is important for calculating thermal properties in heat transfer processes, for determining hydraulic material handling, for separating the product from unwanted materials, and for predicting physical structures and chemical composition. The porosity provides knowledge of the Moringa seed percentage void, and is important in heat and airflow studies. **References** Abubakar et. al (2018, June). Determination of selected engineering properties of Moringa oleifera seed. Retrieved from ***https://www.myfoodresearch.com/uploads/8/4/8/5/*** ***84855864/_2__fr-2018-124.r1_abubakar.pdf*** Stupoop (2018). Volume of Spheres. Retrieved from ***https://www.instructables.com/id/Volume-*** ***of-a-Sphere-2/*** Boukouvalas et. al (2005). Density and Porosity: Literature Data Compilation for Foodstuffs. Retrieved from ***https://www.tandfonline.com/doi/full/10.1080/10942910600575690***
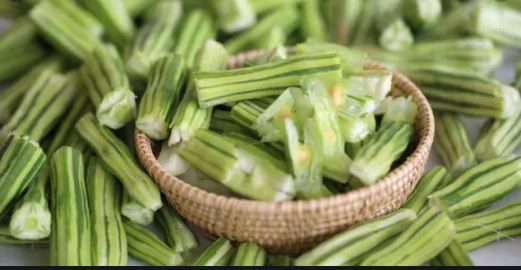
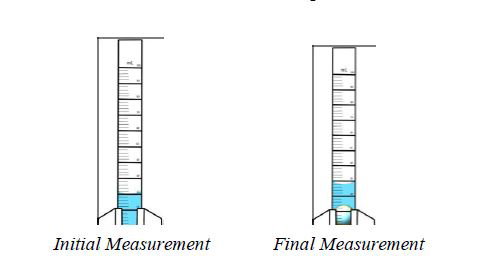

+2 more
@OverThinker
Hello Everyoneeee!!!!!! I'm back! hahahahaha We somehow managed to finish the two week long activity that we were conducting huhuhuhu. I can finally rest in peace, jk. I'll be posting more articles soon!
@OverThinker
Hello Everone! I would like to ask for your support. My friend @Charlotte entered a singing contest here in readcash and the said contest requires voting. Please vote for @Charlotte's entry. It'll be a great help. Here's the link directing to her entry: https://read.cash/@Charlotte/leaving-on-a-jet-plane-cover-7a7943fe Please vote here: https://docs.google.com/forms/d/e/1FAIpQLSfJiJD-2RzA5XYeM76_5dsb8IvuKVzSerVICLKJBhRnFslnNQ/viewform Love you all readcashers!
@OverThinker
Hello Everyone! I just dropped by to say "Good night". All the activities I'm doing are all giving me stress not to mention that it's starting to affect my health. I lost my sense of hearing in my right ear a while ago and fortunately it came back. I'm also having a lot of bruises for no reasons. I really don't know the reasons why I'm experiencing this. Anyways, hope that all of this would be gone for good. Have a great day ahead!
@OverThinker
Hello Everyone! I would like to greet one of my bestfriends @Charlotte a Happy Birthday . We were friends since highschool. We’ve been through a lot and I saw how she grew into a beautiful(ehem may tip to catay hahahaha), smart, strong and proper lady. We’re like sisters because yes, we do fought a lot back then hahahahha cringe moments but I can say that she’s one of the best sister you’ll ever have. Ps. I remembered a lot of moments when we were in annex but the best part was when I thought I could save you from a muddy situation. Tanjoubi Omedetoo! Saengil chuka Hamnida! Maligayang Bati! Happy Birthday Cataaayyy🎉 Always remember that I’m always here to back you up. Love You💕
@OverThinker
Good Morning Everyone! It'll be another busy day but I just dropped by to greet my readcash family. Hope you are all doing fine.☀️ I would also like to promote our community wchich is the *Learner's Community*. Hope you'd join. Here's the link: https://read.cash/c/learners-community-b5b5 P.s. I'm willing to tip authors who'll post in this community.
@OverThinker
Know the Measures of Central Tendency Hello Everyone! I would like to share my personally made module regarding Measures of Central Tendency. I made this when I was still a freshman as a requirement for my math subject. Hope you'd like it! **To all students out there that are having online classes and making endless paperwork and activities, welcome to the learner's community!** **Here, you are free to share your outputs and turn it into an Article for others to learn from it as well.** **Here's the link:** ****https://read.cash/c/learners-community-b5b5****
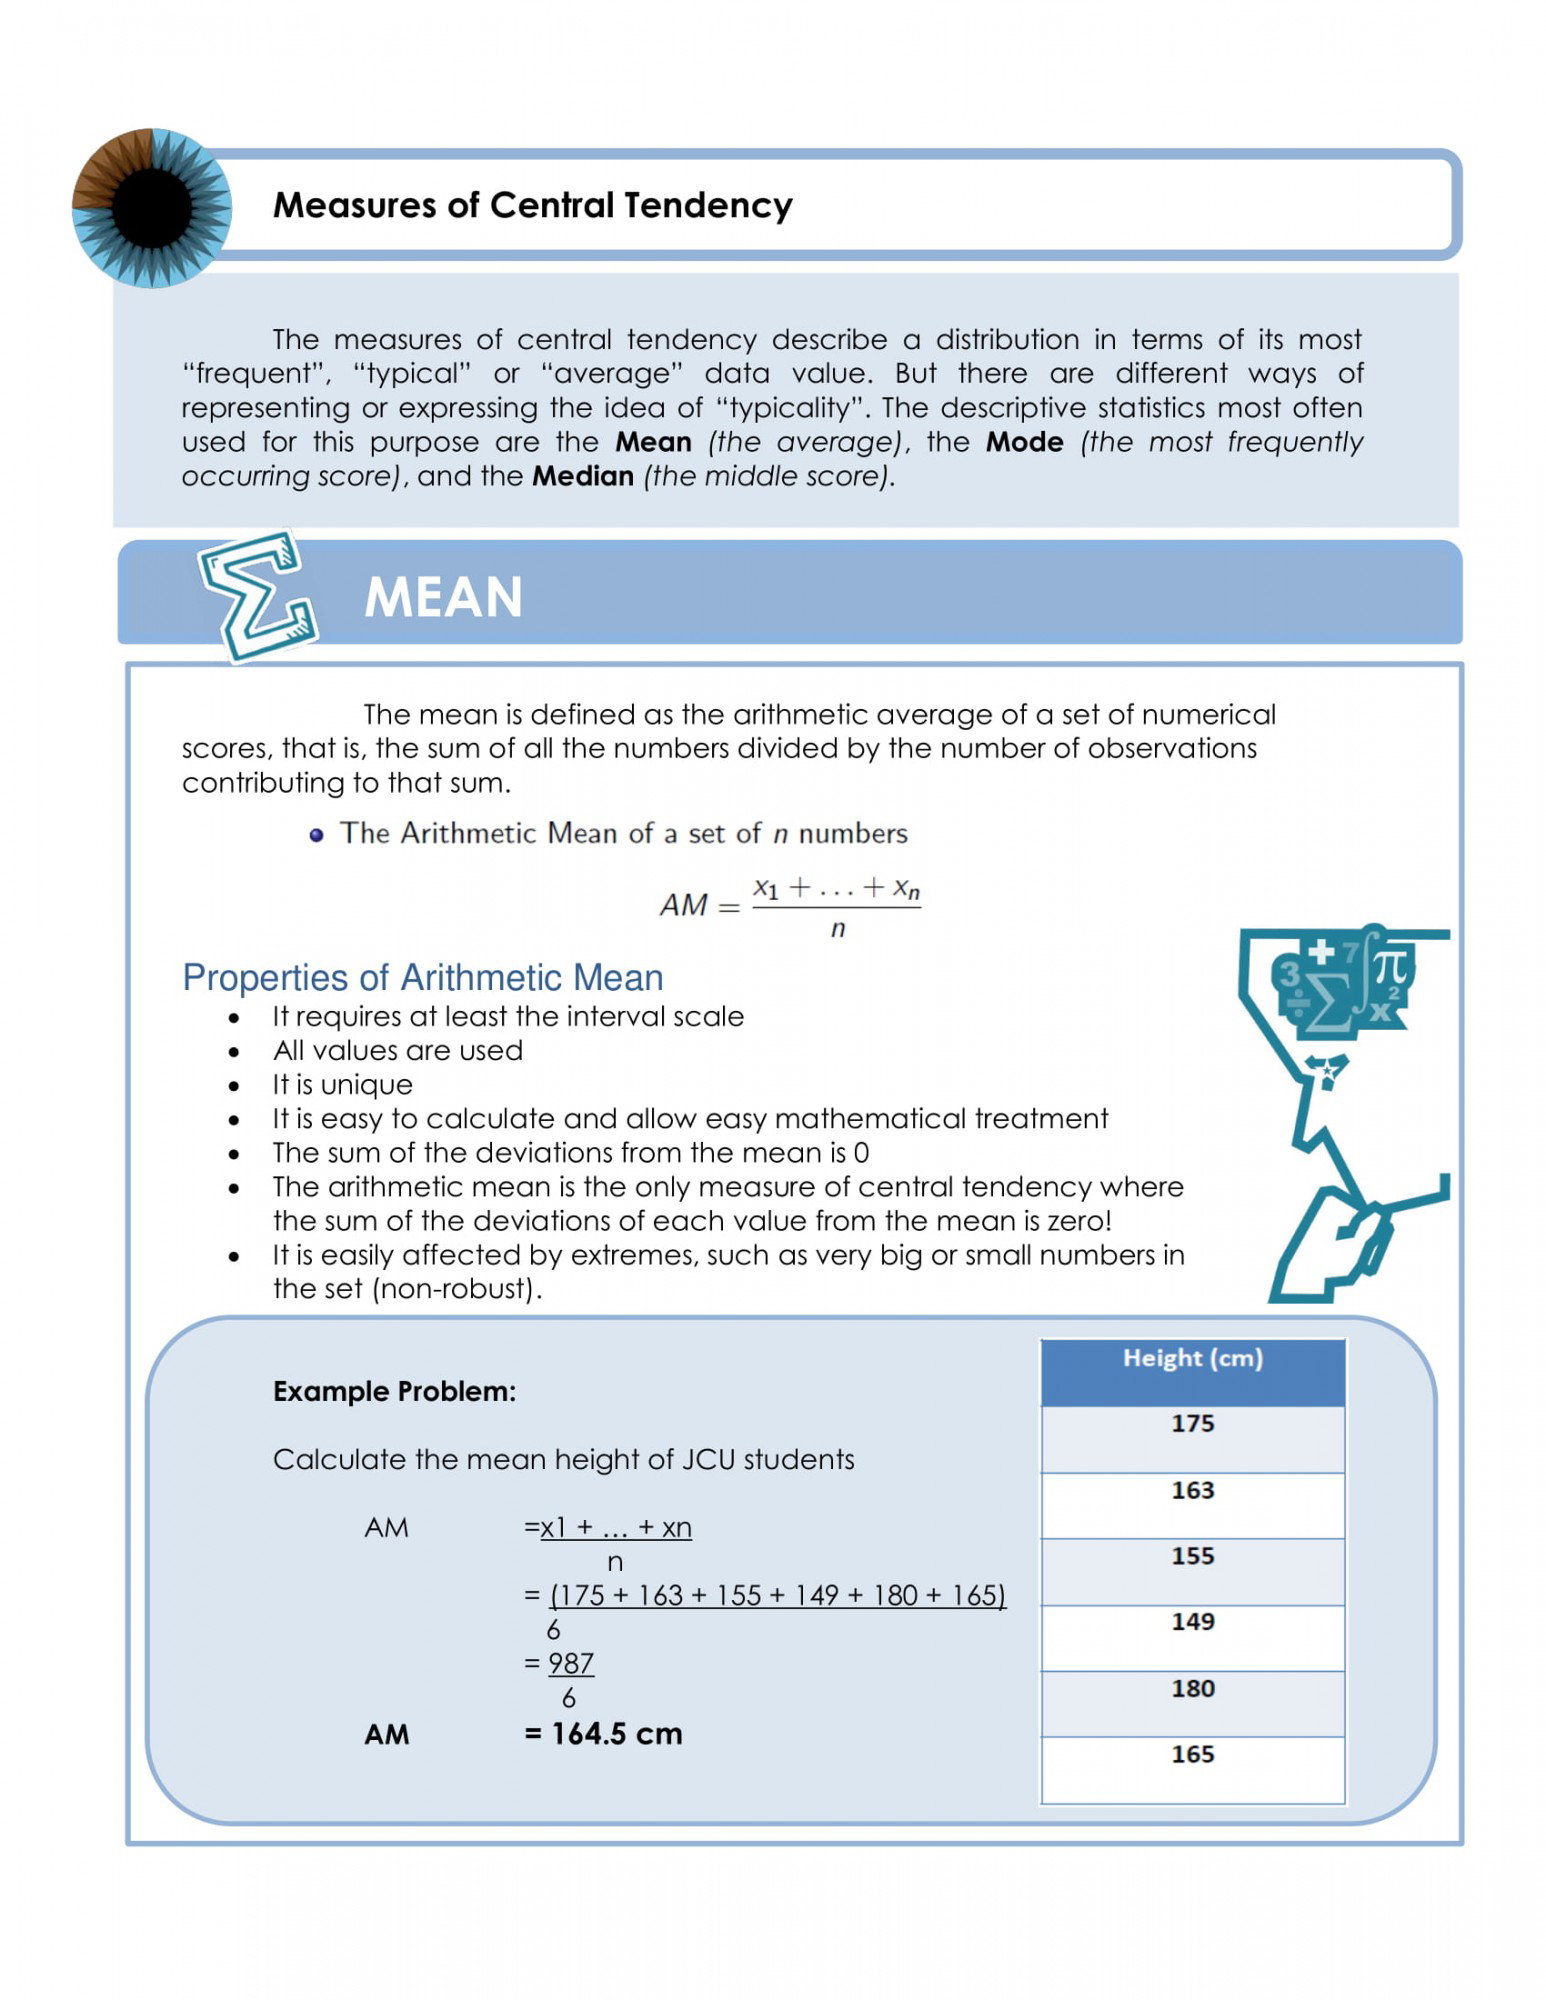
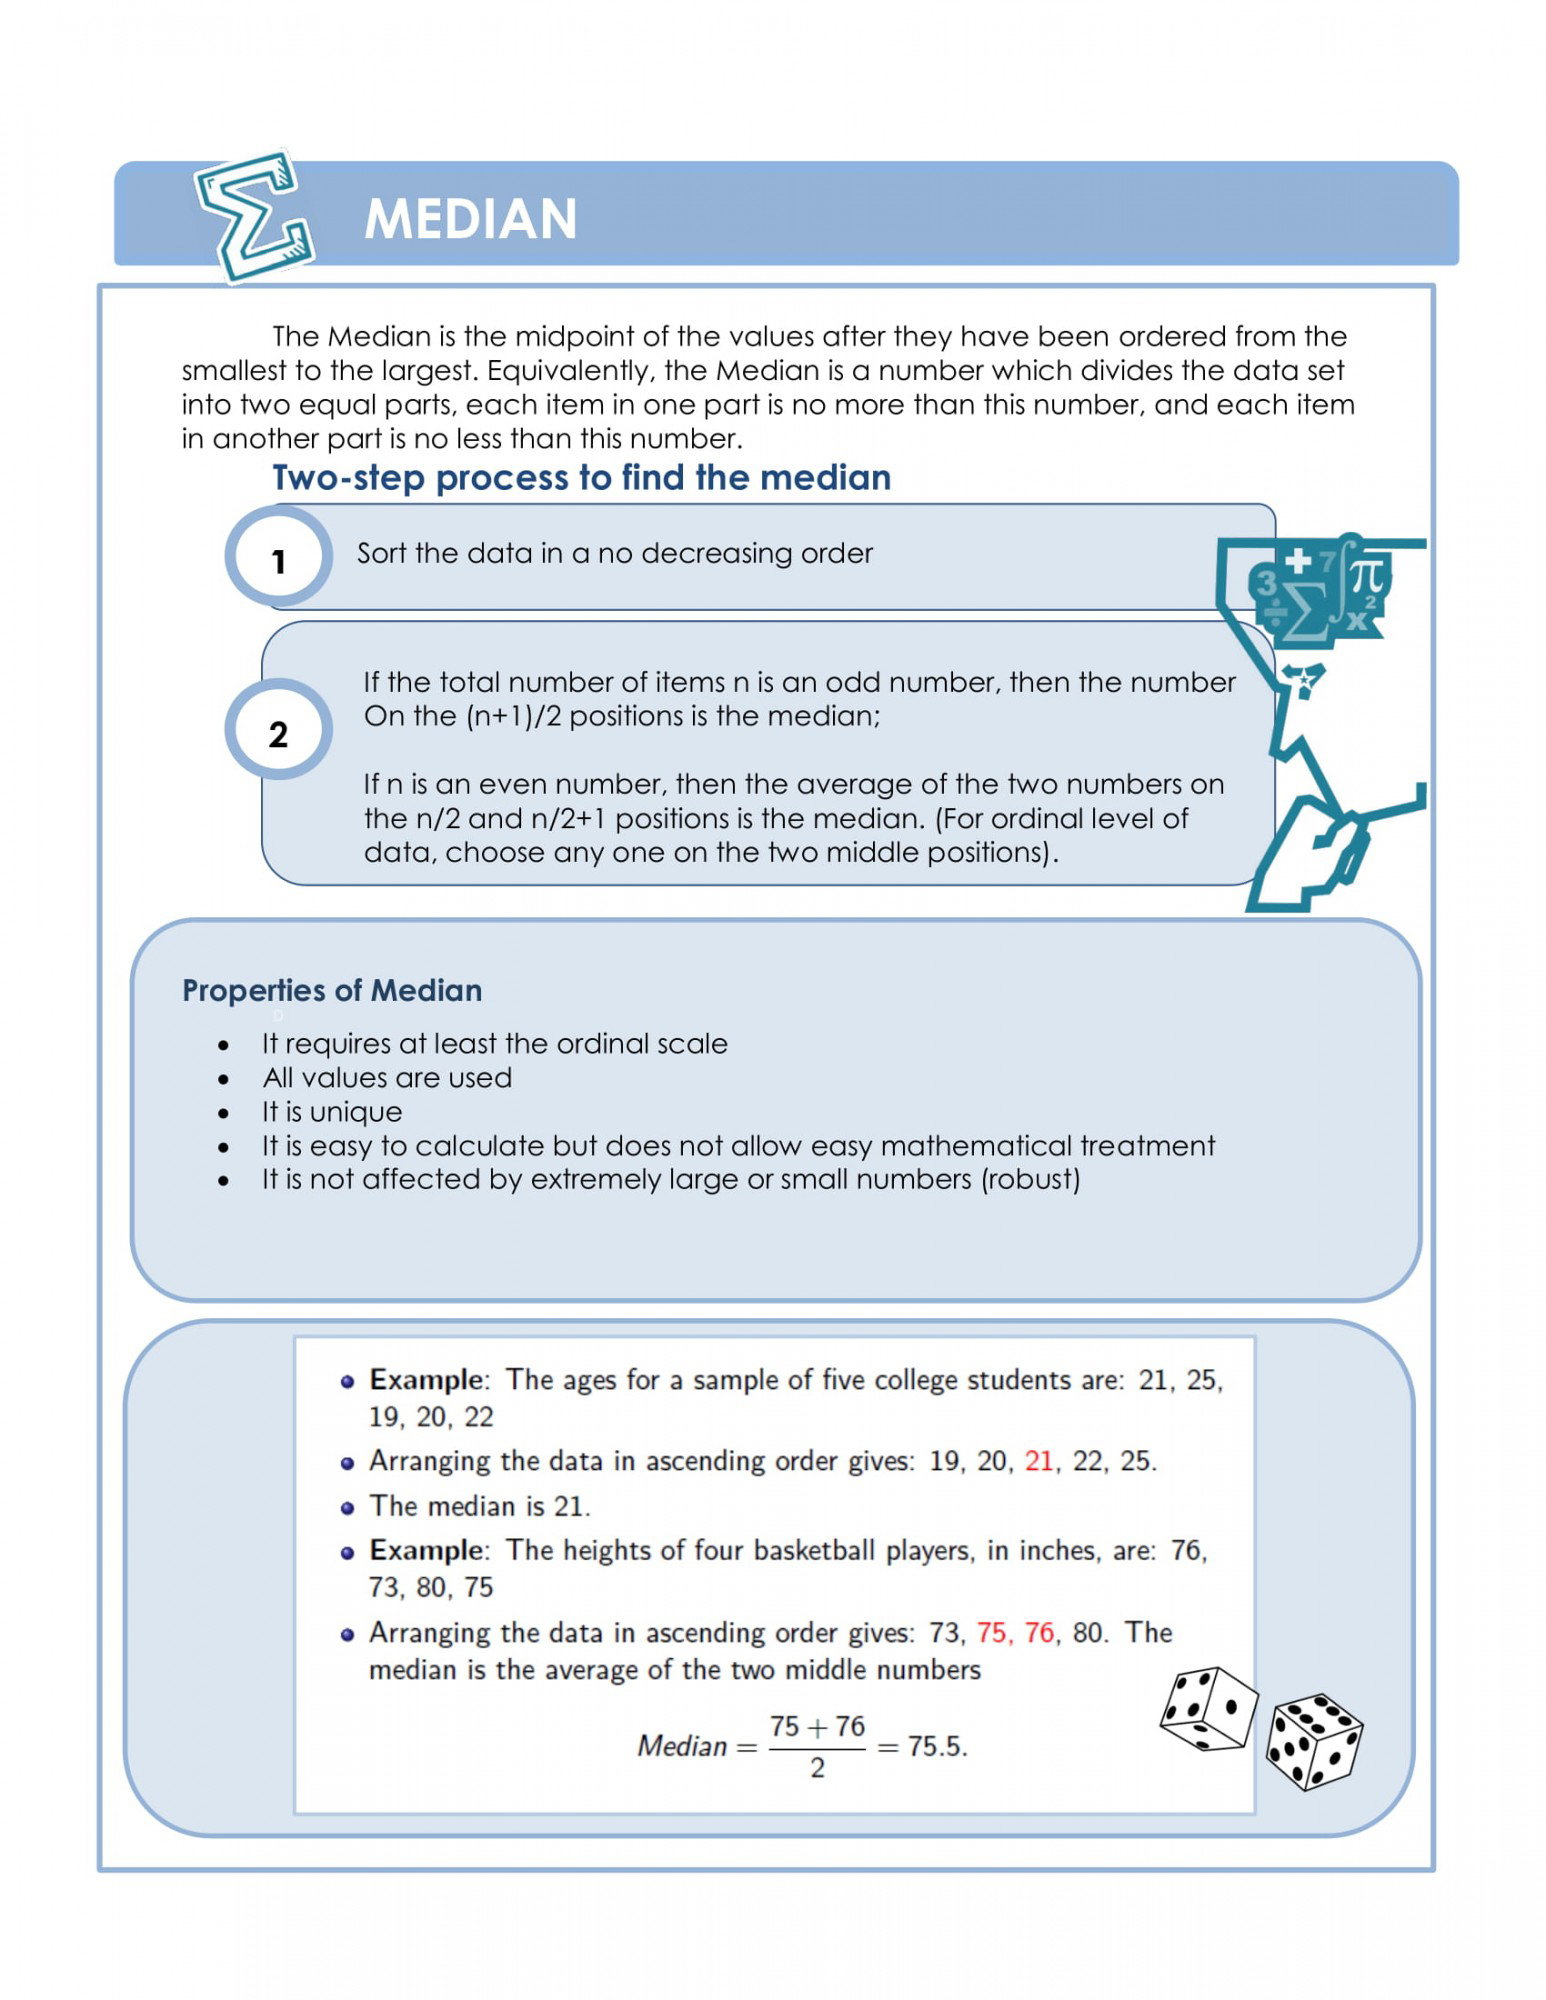
+1 more
@OverThinker
Non-Ferrous Metals **Introduction to Non-Ferrous Metals** *Statue of Liberty on Liberty Island in New York City, USA* We are surrounded by materials that undeniably amazing. In our kitchen, we see cooking tools, utensils and some sort of glasses, in our bedroom we see lampshades in the study table and a computer beside it, and to other places of the house, we see many materials that we are wondering about. No doubt that all the material things that we are having like phones, laptops, and other electronic devices came from a source that we really don’t care because it doesn’t highlight the material used upon purchasing like metal or something but only the main purpose of it to us human perhaps. Nevertheless, all the things that we see, we smell or even touch undergoes processes just like the gold jewelry that mesmerizes people, underwent from ore extraction. For instance, one of the famous statue known as “*Statue of Liberty*” on Liberty Island in New York City, USA, is the heaviest statue which comprises 31 tons (28.1 tonnes) of copper, 125 tons (113.4 tonnes) of steel, and 27,000 tons (24,494 tonnes) of concrete in the pedestal. Basically, all the materials surrounding us are quite important. Little did we know that the phone that we are using, scrolling, playing, browsing or even discovering right now has material like metal in order to function. This certain thing is salient to effectively and efficiently use by the consumer. According to an article written by Bianca Nogrady, smartphones are pocket-sized vaults of precious metals and rare earth. A typical iPhone is estimated to house around 0.034g of gold, 0.34g of silver, 0.015g of palladium and less than one-thousandth of a gram of platinum. It also contains the less valuable but still significant aluminum (25g) and copper (around 15g). Mostly, metals are broadly classified as ferrous and nonferrous. And those that are iron-free are used in some important gadget to prevent from corrosion. And these are called non-ferrous metals. Historically, nonferrous metals, especially the red metals, brought us out of the Stone Age and into the Copper and Bronze Ages. From 4500 BC to 1500 BC, copper and bronze dominated our primitive manufacturing systems. It wasn’t until 1500 BC that iron finally took hold as the most popular alternative for tools, weapons, and armor. Nevertheless, copper and bronze remained a staple in designer trades, like jewelry, interiors - and architecture. These metals invoke history, ancestry, and a throwback to nature. There is no other material on Earth that feels quite like a red metal. Nonferrous metals, including aluminum, nickel, lead, tin, brass, silver, and zinc, are known for their tensile strength and present characteristics that hold an advantage over ferrous metals, mainly by their malleability, lighter weight, and corrosion resistivity. As iron content is absent in nonferrous metals, the probability of rust and corrosion occurring also is fairly low yet the only difference lies in accessibility of these materials, recycling efficiency, and costs. According to the study entitled Reliability and Maintainability of In-Service Pipelines, recycling of nonferrous metals, including aluminum, copper, brass, and lead, is relatively common due to its scarcity. Therefore, there is a heavy dependence on the recycling of scrap materials in order to create new nonferrous metals. In fact, aluminum is known to be the most recycled metal, ranking third in the world. It is also this reason that the cost of nonferrous metals is also more expensive than ferrous metals, with stainless steel often being used instead, due to its cheaper cost and versatility. (Mahmoodian, 2018) Furthermore, nonferrous materials can be combined to create alloys, including brass, bronze, and solder, for increased strength and flexibility without resulting in the effects of heavier weight compared with ferrous metals. The high malleable state of nonferrous metals makes them ideal for usage as they can be easily pressed into thin sheets without breaking. **Overview of Metal Classification** **What Is Non-Ferrous Metals And Alloy?** ****Non-ferrous metals**** are those which do not contain significant quantity of iron or iron as base metal. This means that non-ferrous metals are not attracted to a magnet and they also do not rust in the same way when exposed to moisture. These metals possess low strength at high temperatures, generally suffer from hot shortness and have more shrinkage than ferrous metals. They are utilized in industry due to following properties: 1. High corrosion resistance 2. Easy to fabricate, i.e., machining, casting, welding, forging and rolling 3. Possess very good thermal and electrical conductivity 4. Attractive colour and low density The various non-metals used in industry are: copper, aluminium, tin, lead, zinc, and nickel, etc., and their alloys. ****Alloys**** are base metals combined with other metals or chemicals to enhance the base metals properties. **Non Ferrous Metals** **Aluminium** It tends to be light in colour although it can be polished to a mirror like appearance. It is very light in weight. **Metal Uses** Used for saucepans, cooking foil, window frames, ladders, expensive bicycles. **Melting Point** 660°C **COPPER and COPPER ALLOYS** **Copper** It is a ductile and malleable metal. It is often red / brown in colour. It is a very good conductor of heat and electricity. **Metal Uses** Used for plumbing, electric components, cookware and roof coverings. **Melting Point** 1084°C **MAGNESIUM AND MAGNESIUM ALLOYS** **Magnesium** Magnesium is a fairly strong, silverywhite, light-weight metal (one third lighter than aluminum) that slightly tarnishes when exposed to air. In a powder, this metal heats and ignites when exposed to moisture and burns with a white flame. **Metal Uses** Magnesium is used in pyrotechnic (i.e. fireworks). It is alloyed with other metals to make them lighter and more easily welded. **Melting Point** 648°C **Low Melting Alloys** **ZINC** A bluish-white lustrous metal. It is very resistant to corrosion from moisture. However zinc is a very weak metal and is used mainly for coating steel. **Metal Uses** Used as a coating on screws, steel buckets etc. It is also used to galvanize steel. **Melting Point** 419°C **TIN** It is a very ductile and very malleable metal. It is resistant to corrosion from moisture. It is bright silver in appearance. Tinplate is steel with a tin coating. **Metal Uses** Used as a coating on food cans, beer cans. Used as whistles, tin foil and soldering. **Melting Point** 231°C **LEAD** It is a soft, malleable metal. It is also counted as one of the heavy metals. Lead has a bluish-white color after being freshly cut, but it soon tarnishes to a dull grayish color when exposed to air. **Metal Uses** Used for roof flashing. Also used for batteries and for X-ray protection. Lead is used for its weight in many ways. **Melting Point** 327°C **Precious Metals** **SILVER** A soft, white, lustrous transition metal, it has the highest electrical conductivity of any element and the highest thermal conductivity of any metal. The metal occurs naturally in its pure, free form. **Metal Uses** Used for jewelry and high quality cutlery. Also used for currency coins and sports trophies. Used in mirrors as a reflective metal. Also, tableware, coinage, electroplating, photographic film etc. **Melting Point** 961°C **GOLD** Gold is a dense, soft, shiny, malleable and ductile metal. Pure gold has a bright yellow color and luster traditionally considered attractive, which it maintains without oxidizing in air or water. Gold resists attacks by individual acids It won't tarnish, discolor, crumble, or be affected by most solvents. **Metal Uses** Used mainly for jewelry. Also used in co mputers as a conductor. Used for its reflective powers to protect satellites. Coinage, dental work, electroplating etc. **Melting Point** 1337°C **PLATINUM** Is a soft, ductile, grayish-white metal that has good corrosion resistance even at elevated temperatures. **Metal Uses** Used as electrical contacts, for spark plugs, as catalyst for automobile pollution-control devices, in filaments, in nozzles,as jewelry, in dental work, and in dies for extruding glass fiber. **Melting Point** 1,768 °C **Non-ferrous metal alloys are metals that are a mixture of two or more metals. The main ones in everyday use are Brass, Bronze, Solder.** **BRASS** Brass is a mixture of copper and zinc. Copper is the main component, and brass is usually classified as a copper alloy. The color of brass varies from a dark reddish brown to a light silvery yellow. Brass is stronger and harder than copper, but not as strong or hard as steel. It is easy to form into various shapes, a good conductor of heat, and generally resistant to corrosion from salt water. **Metal Uses** Brass is used to make water fittings, screws, radiators, musical instruments, and cartridge casings for firearms. **Melting Point** 940°C **BRONZE** Bronze is a metal alloy consisting primarily of copper, usually with tin as the main additive. It is a hard and brittle metal. It has a very high resistance to corrosion. **Metal Uses** Used for ship propellers and underwater fittings. Also used for statues and medals. **Melting Point** 950°C **SOLDER** Solder is a fusible metal alloy used to join together metal work pieces and having a melting point below that of the work pieces. It is an alloy of Lead and Tin. **Metal Uses** Solder is used for electronics, plumbing, jewelry making and repair processes where metal parts cannot be effectively or safely welded. **Melting Point** 200°C **MORE NONFERROUS METALS** **Mercury** can be used to make thermometers, barometers and other scientific instruments. Mercury conducts electricity and is used to make silent, position dependent switches. Mercury vapor is used in streetlights, fluorescent lamps and advertising signs. **Tungsten** is a rare metal and the free element is remarkable for its robustness. Highest melting point of all the elements and extremely hard material. It can be used as cutting blades, abrasives, armour piercing round Melting point 2870°C **Beryllium** has 6 times the specific stiffness of steel. It is used to make rocket nozzles, space and missile structures, and aircraft disc brakes. **Zirconium** is a flammable metal and is not found as metallic. It is silvery in color and is used in electronic components and in nuclear- power reactor application because of its low neutron absorption. **Cobalt** is a bluish-white, lustrous, hard, brittle metal. It is ferromagnetic. Cobalt is used in alloys for aircraft engine parts and in alloys with corrosion/wear resistant uses, in batteries and in electroplating. **Cerium** is a component of mischmetal, used in the manufacture of alloys for cigarette lighters. Cerium oxide is used in incandescent gas mantles, as a glass polishing agent and as a catalyst in self-cleaning ovens. **Cadmium's** major use is in batteries (especially rechargeable nickel–cadmium, NiCad, batteries). Cadmium is used in low melting alloys and is a component of many kinds of solder. **Bismuth** is a crystalline, brittle, metal and is used in medicine (bismuth subnitrate and subcarbonate), cosmetics (bismuth oxychloride), low-melting alloys, fire detection/extinguishing systems. **Indium** is used to dope germanium to make transistors. It is also used to make other electrical components such as rectifiers, thermistors and photoconductors. **Niobium** alloys are strong and are often used in pipeline construction. The metal is used in superalloys for jet engines and heat resistant equipment. **Gallium** alloys are used in some medical thermometers as non-toxic substitutes for mercury. **Germanium** is used in transistors and in integrated circuits. It is used as an alloying agent and as a catalyst. It is also used in infrared spectroscopes and infrared detectors. **Lithium** is used in the manufacture of aircraft and in certain batteries. It's also used in mental health: Lithium carbonate is a common treatment of bipolar disorder, helping to stabilize wild mood swings caused by the illness. **Selenium** is used in the glass industry to decolorize glass and to make red-colored glasses and enamels. **Tantalum** is used in the electronics industry for capacitors and high power resistors. The metal is used in dental and surgical instruments and implants, as it causes no immune response **FAMOUS BUILDINGS MADE OF ALUMINUM** **MATERIALS PROCESSING AND MANUFACTURING** The cycle of manufacturing processes that converts materials into parts and products starts immediately after the raw materials are either extracted from minerals or produced from basic chemicals or natural substances. Metallic raw materials are usually produced in two steps. First, the crude ore is processed to increase the concentration of the desired metal; this is called beneficiation. Typical beneficiation processes include crushing, roasting, magnetic separation, flotation, and leaching. Second, additional processes such as smelting and alloying are used to produce the metal that is to be fabricated into parts that are eventually assembled into a product. The processes used to convert raw materials into finished products perform one or both of two major functions: first, they form the material into the desired shape; second, they alter or improve the properties of the material. Forming and shaping processes may be classified into two broad types—those performed on the material in a liquid state and those performed on the material in a solid or plastic condition. The processing of materials in liquid form is commonly known as casting when it involves metals, glass, and ceramics; it is called molding when applied to plastics and some other nonmetallic materials. Most casting and molding processes involve four major steps: **(1)** *making an accurate pattern of the part*, **(2)** *making a mold from the pattern*, **(3)** *introducing the liquid into the mold*, and **(4)** *removing the hardened part from the mold. A finishing operation is sometimes needed.* Materials in their solid state are formed into desired shapes by the application of a force or pressure. The material to be processed can be in a relatively hard and stable condition and in such forms as bar, sheet, pellet, or powder, or it can be in a soft, plastic, or puttylike form. Solid materials can be shaped either hot or cold. Processing of metals in the solid state can be divided into two major stages: first, the raw material in the form of large ingots or billets is hot-worked, usually by rolling, forging, or extrusion, into smaller shapes and sizes; second, these shapes are processed into final parts and products by one or more smaller scale hot or cold forming processes. After the material is formed, it is usually further altered. In materials processing, a “removal” process is one that eliminates portions of a piece or body of material to achieve a desired shape. Although removal processes are applied to most types of materials, they are most widely used on metallic materials. Material can be removed from a workpiece by either mechanical or nonmechanical means. There are a number of metal-cutting processes. In almost all of them, machining involves the forcing of a cutting tool against the material to be shaped. The tool, which is harder than the material to be cut, removes the unwanted material in the form of chips. Thus, the elements of machining are a cutting device, a means for holding and positioning the workpiece, and usually a lubricant (or cutting oil). There are four basic noncutting removal processes: (1) in chemical milling the metal is removed by the etching reaction of chemical solutions on the metal; although usually applied to metals, it can also be used on plastics and glass, (2) electrochemical machining uses the principle of metal plating in reverse, as the workpiece, instead of being built up by the plating process, is eaten away in a controlled manner by the action of the electrical current, (3) electrodischarge machining and grinding erodes or cuts the metal by high-energy sparks or electrical discharges, (4) laser machining cuts metallic or refractory materials with an intense beam of light from a laser. Another further alteration may be “joining,” the process of permanently, sometimes only temporarily, bonding or attaching materials to each other. The term as used here includes welding, brazing, soldering, and adhesive and chemical bonding. In most joining processes, a bond between two pieces of material is produced by application of one or a combination of three kinds of energy: thermal, chemical, or mechanical. A bonding or filler material, the same as or different from the materials being joined, may or may not be used. The properties of materials can be further altered by hot or cold treatments, by mechanical operations, and by exposure to some forms of radiation. The property modification is usually brought about by a change in the microscopic structure of the material. Both heat-treating, involving temperatures above room temperature, and cold-treating, involving temperatures below room temperature, are included in this category. Thermal treatment is a process in which the temperature of the material is raised or lowered to alter the properties of the original material. Most thermal-treating processes are based on time-temperature cycles that include three steps: heating, holding at temperature, and cooling. Although some thermal treatments are applicable to most families of materials, they are most widely used on metals. Finally, “finishing” processes may be employed to modify the surfaces of materials in order to protect the material against deterioration by corrosion, oxidation, mechanical wear, or deformation; to provide special surface characteristics such as reflectivity, electrical conductivity or insulation, or bearing properties; or to give the material special decorative effects. There are two broad groups of finishing processes, those in which a coating, usually of a different material, is applied to the surface and those in which the surface of the material is changed by chemical action, heat, or mechanical force. The first group includes metallic coating, such as electroplating; organic finishing, such as painting; and porcelain enameling. **METAL RECYCLING** **1. Collection** This is the first and most important step in metal recycling. It simply involves collecting all materials that are made of metals. This process should be organized in such a way that there should be containers specifically designed to collect metals. Some people and business persons have established scrap yards whereby people are encouraged to collect different metals, take them there and be paid for what they have collected. Different metals cost differently at the yards. The scrap metal yards are used as collecting centres for the metals. **2. Sorting** Once the metals have been collected, the next important step is to sort the metals. This involves separating what can be recycled form what is non-recyclable. It is essential to point out that the quality of metal recycled is very important. A high quality recycled product or item can only be created if the original materials used in the recycling process are of good quality. This therefore, calls for strict quality checkup during the sorting process. **3. Processing** After sorting, the next step is to compact or squeeze the metal. All the recycle materials are squeezed and squashed using machines so that they do not occupy so much space in the conveyor belts. **4. Shredding** After the crushing and breaking of the metal, the shredding process starts. The metals are broken down into tiny pieces or sheets to allow further processing. The small pieces have large surface to volume ratio that can be melted using less energy as compared to when they are in large pieces of metal. Normally, steel is changed into steel blocks while on the other hand aluminum is converted into sheets. **5. Melting and Purification** Melting of the scrap metal takes place in a large furnace. Each metal is taken to a furnace that is specifically designed to melt that particular metal based on its specific properties. The melting process uses a considerable amount of energy. However, the energy required for melting recycled metal is less compared to energy required to make metal from its raw material. The furnace is heated to appropriate degrees capable of melting the particular metal. Melting can take minutes or hours depending on how big the furnace is, the volume of metal placed in the furnace and the heat degree of the furnace. **6. Purification** After the melting process is complete, the next step is the purification process. Metals are purified using different methods. Purification of metals is done to ensure that the final product is free of impurities and that it is of high quality. Electrolysis is one of the methods of purifying some metals. Other metals are simply passed under powerful magnetic systems that separate metals from other recyclables. Today there are different purification methods depending on the type of metal. **7. Melting and Solidifying of the Metal** After the purification process, the molten metal is then carried by the conveyor belt to a cooling chamber where it is cooled and solidified. It is at this stage that the scrap metal is made into a solid metal that can be used again. Other chemicals are then added into the molten metal to make it acquire its density and other properties. It is at the cooling stage that different shapes and sizes of metals are made and designed. **8. Transportation of the Metal Bars** Once the bars have been designed and made, the final product is then packed depending on their sizes and shapes ready for transportation to different factories and to people who require the metal. Thereafter, the cycle begins again. **REFERENCES:** • Kalpakjian, Serope, and Schmid, Steven R. *Manufacturing Engineering and Technology.* Prentice-Hall, Fifth Edition. • Lindbeck, John R. *Product Design and Manufacturing*. Retrieved from *https://www.fedsteel.com/our-blog/the-differences-between-ferrous-and-non-ferrous-metals-2/* · Tomwheats (2012)Ferrous and Non- Ferrous Metals . Retrieved from https://image.slidesharecdn.com/metalsferrousandnonferrous-131023154745-phpapp01/95/metals-ferrous-and-non-ferrous-29-638.jpg?cb=1382543324 https://www.slideshare.net/tomwheats/ferrous-and-nonferrous metals?next_slideshow=1 https://image.slidesharecdn.com/metalsferrousandnonferrous-131023154745-phpapp01/95/metals-ferrous-and-non-ferrous-3-638.jpg?cb=1382543324 · Knapman (2012), Five Famous Aluminium Buildings Around The World. Retrieved from: https://www.austenknapman.co.uk/blog/building-with-metal/five-famous-aluminium-buildings-around-the-world/ • Yukitaka Murakami, in Metal Fatigue (Second Edition), (2019). Retrieved from: *https://l.facebook.com/l.php?u=https%3A%2F%2Fwww.sciencedirect.com%2Ftopics%2Fengineering%2Fnon-ferrous* *metal%3Ffbclid%3DIwAR3oKw88oA_3H_pao1OWmrj1dLun7yj1dml* https://l.facebook.com/l.php?u=https%3A%2F%2Fwww.sciencedirect.com%2Ftopics%2Fengineering%2Fnon-ferrous%20metal%3Ffbclid%3DIwAR3oKw88oA_3H_pao1OWmrj1dLun7yj1dml • Warner (2016). Thermal processing of metals. Retrieved from: *https://slideplayer.com/slide/6386024/* • Jackson, Hersman, Rinkesh (2020). Retrieved from: *https://www.conserve-energy-future.com/recyclingmetal.php* **To all students out there that are having online classes and making endless paperwork and activities, welcome to the learner's community!** **Here, you are free to share your outputs and turn it into an Article for others to learn from it as well.** **Here's the link:** ****https://read.cash/c/learners-community-b5b5****
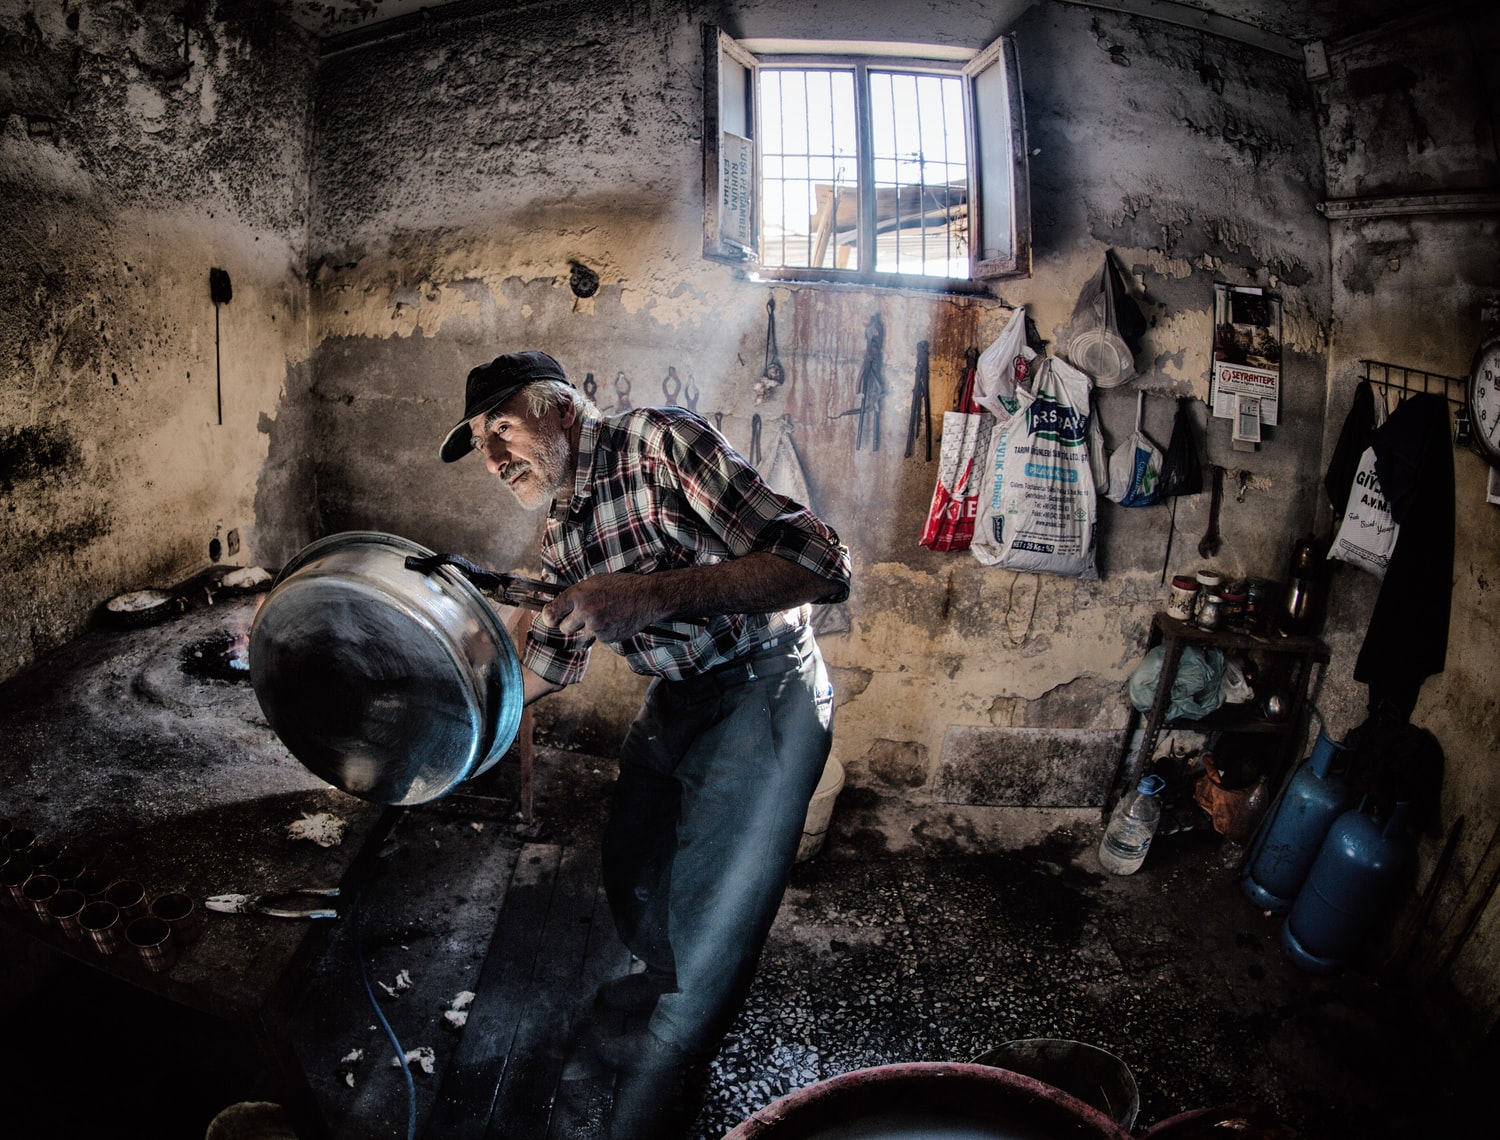


+5 more
@OverThinker
Good Morning Everyone! It's already 4:31 AM (PH Time) and I'm still awake. I just finished my worksheet in the subject Strength of Material. I was shocked because I thought that the deadline would be on Friday but seems like I was mistaken. Hahahha. Glad that I've read the module. Anyways, have a great day everyone!
@OverThinker
Feed Formulation (Animal Science) Hello Everyone! I'll be sharing with you some knowledge regarding Feed Formulation, a topic related to Animal Science. I personally made this as a requirement in the course I'm taking. Hope you'd like and learn from it! **To all students out there that are having online classes and making endless paperwork and activities, welcome to the learner's community!** **Here, you are free to share your outputs and turn it into an Article for others to learn from it as well.** **Here's the link:** ****https://read.cash/c/learners-community-b5b5****
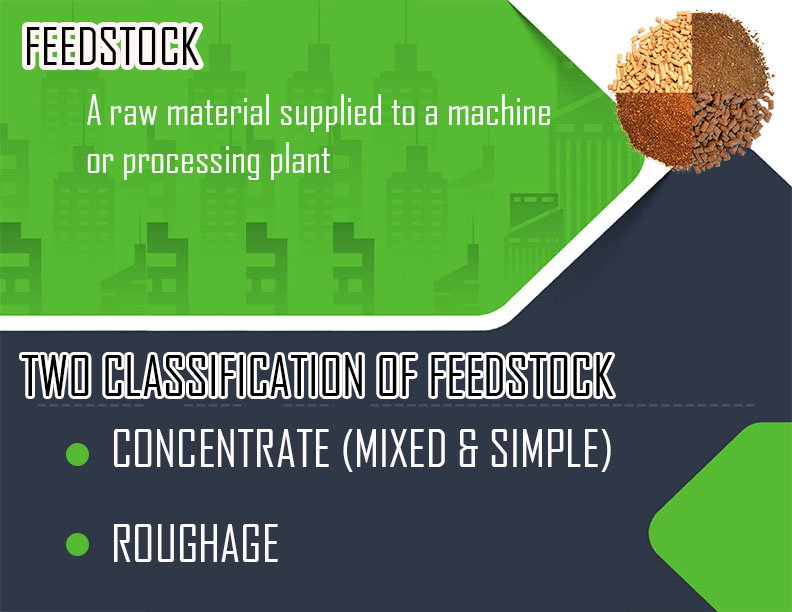
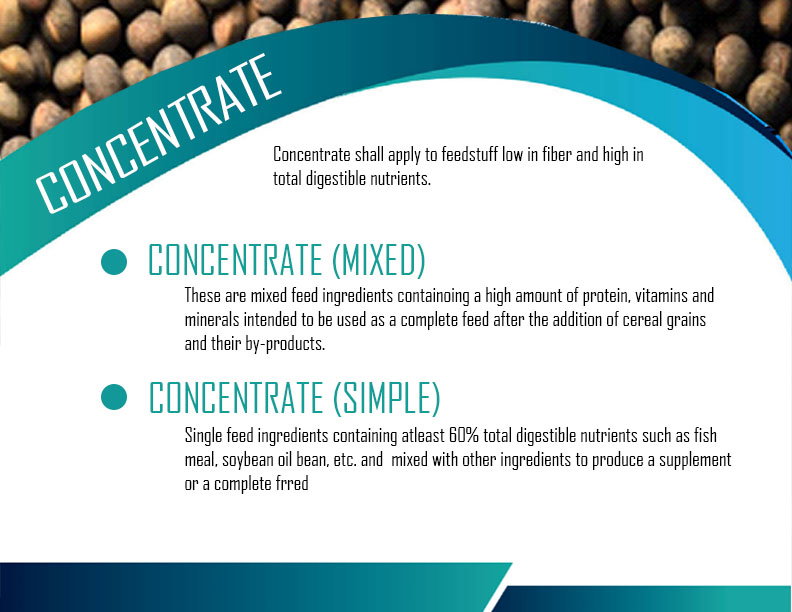
+17 more