https://t.me/hamster_komBat_bot/start?startapp=kentId5993388337
I think 150,000,000 active players are playing this game.
It's really taking over the world step by step.
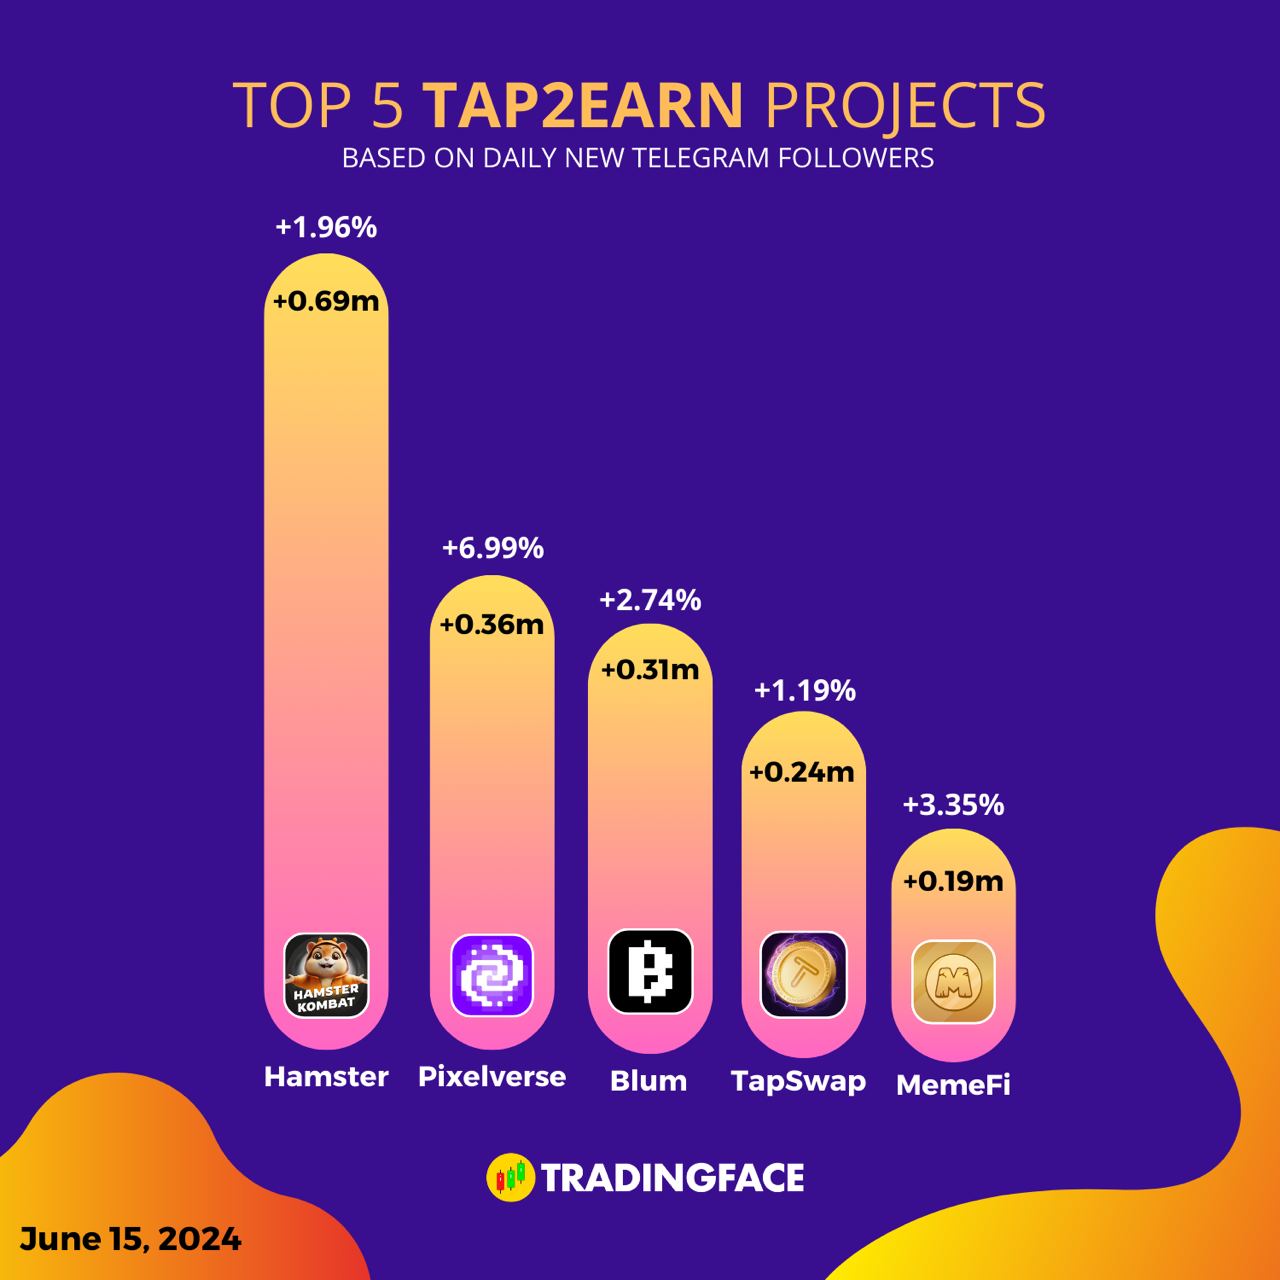
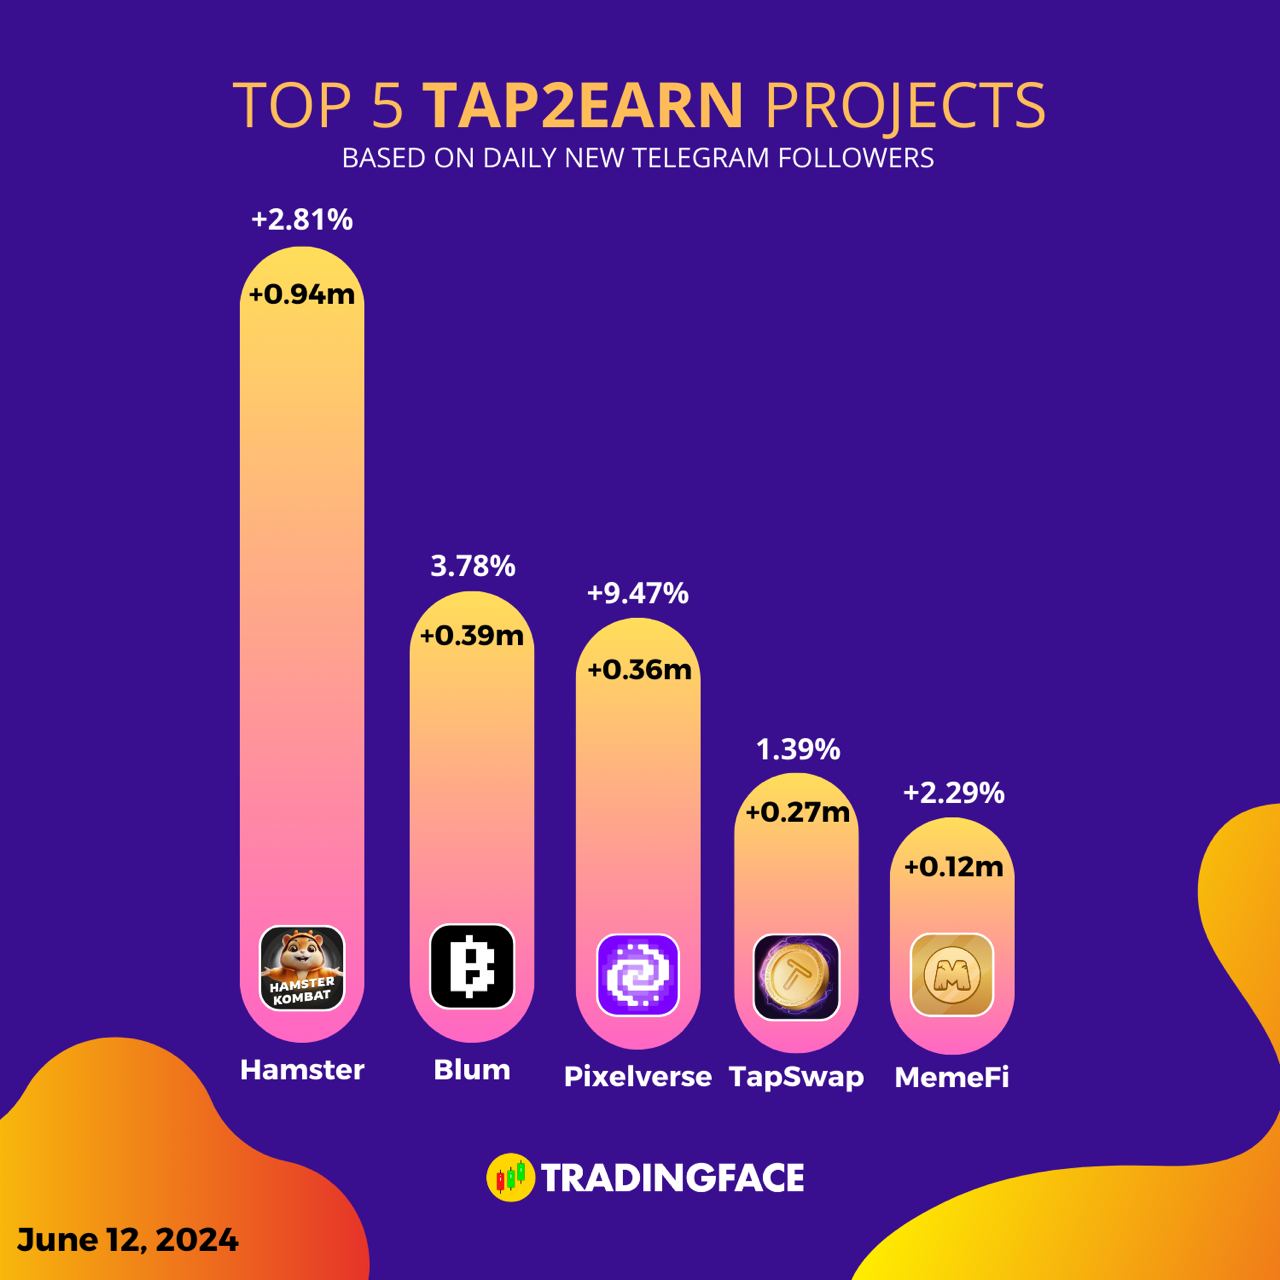
As we can see there’s current stats:
· Over 150,000,000 people are playing. Over 36,000,000 followers on their Telegram. Over 22,700,000 subscribers on YouTube as well. Over 7,600,000 followers on twitter also.
Somd trending projects
The last time bitcoin was hovering around 64k, the crypto's total market cap was around 3 trillion. But now even with Bitcoin's price matching, the total crypto marketcap is around 2.35 trillion. That is about 25% less.
Where is the gap between the market cap of the two periods?
Bitcoin price is doing pretty well. Mim coins are also performing well. But the overall performance of solid altcoins is not good. Sometimes a couple are pumping. But, most are well below the all-time-high. That is, the public's interest in Bitcoin has returned, but confidence in other projects has not increased at all. But again there are dollars in the market to play MimCoin's degen.
This condition of the market is actually alarming. Because, in most cases, the market dumps the price of Bitcoin after a long period of close price. But it can be completely opposite. With the sudden surge of interest in alts, Summer Hype may also be on the way.
No one is quite sure what will happen in the next few weeks
no So "but", "if" in current tweets from market analysts.
What is bchouse app?? Is there any article to read about??
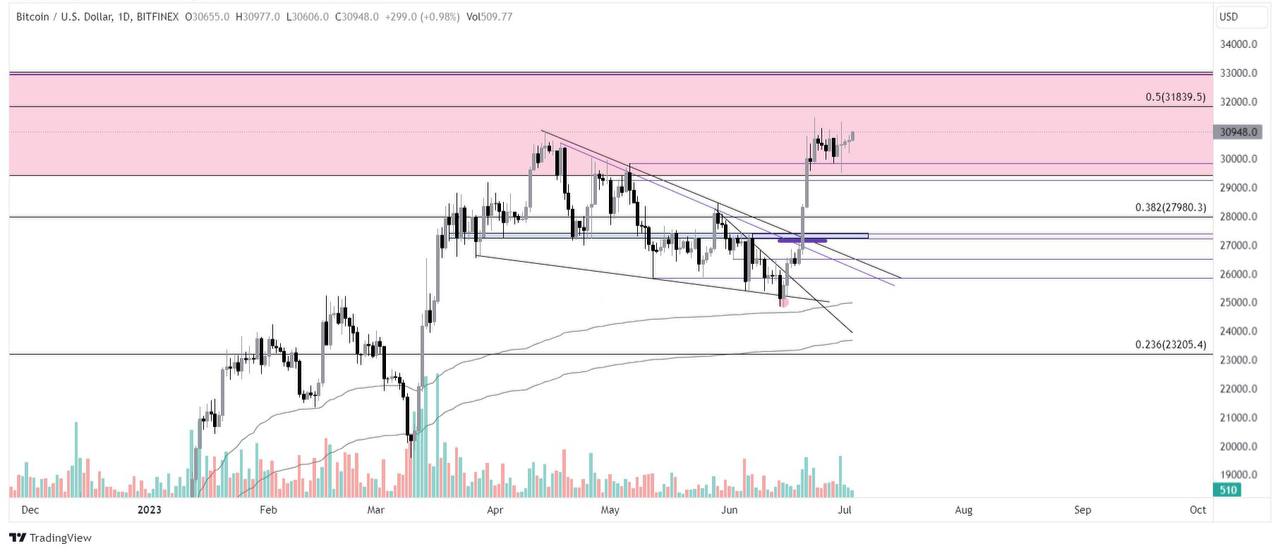
Well its up against Resistance as its Trading below 2021 support/ 2022 swing lows from where it rallies towards 2022 High before losing it as support. It Means that 31.8k - 33k is massive resistance.
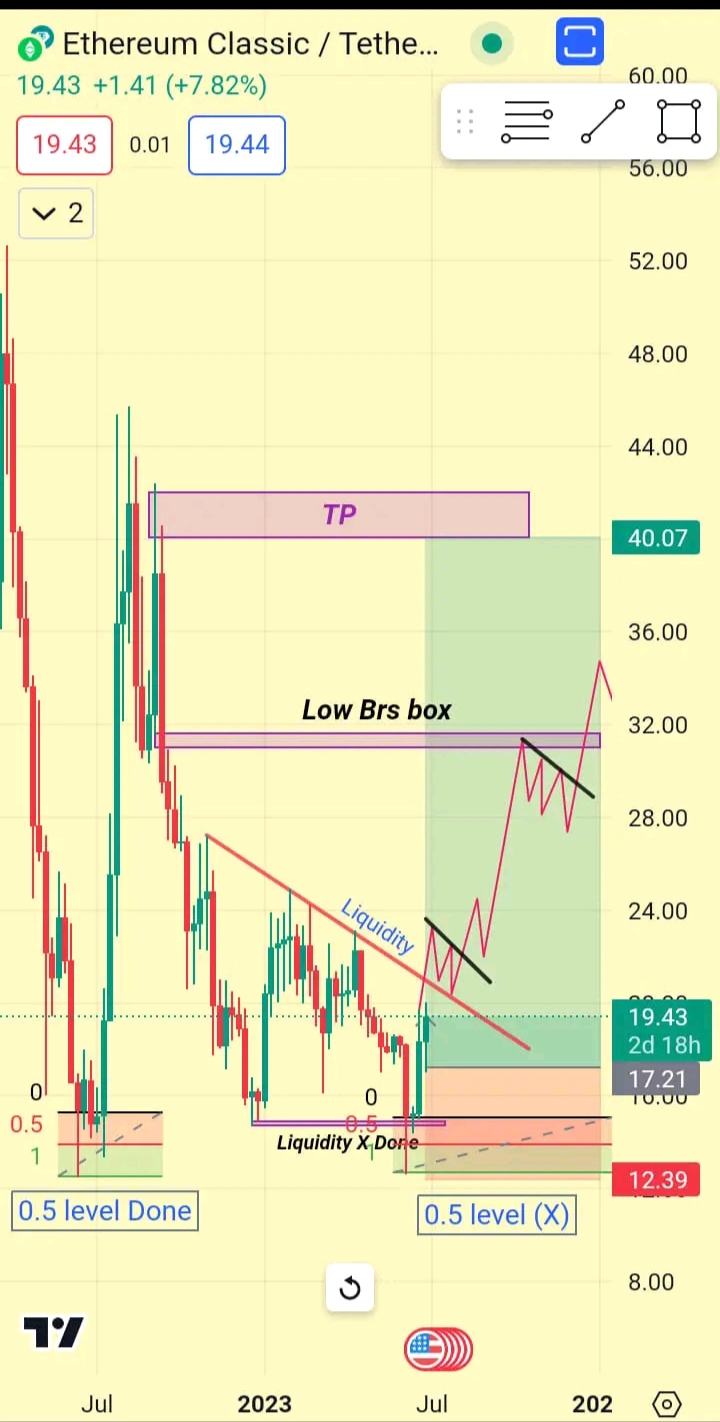
Earlier when the price was 12.5 then the price touched the 0.5 level and pumped the price according to the weekly time to take the liquidity above but did not take the full liquidity price again came to that level but here it did not touch the 0.5 level only trading below the ten line there is liquidity above the ten line a lot According to the weekly time, the price to take train line liquidity will be 27 dollars and according to the market chat, the long time target can be given at 40 dollars.
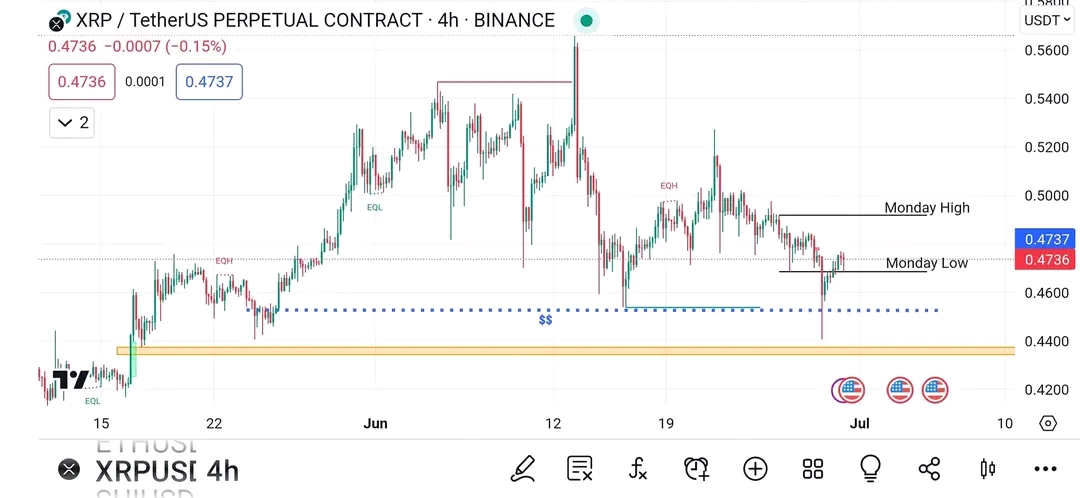
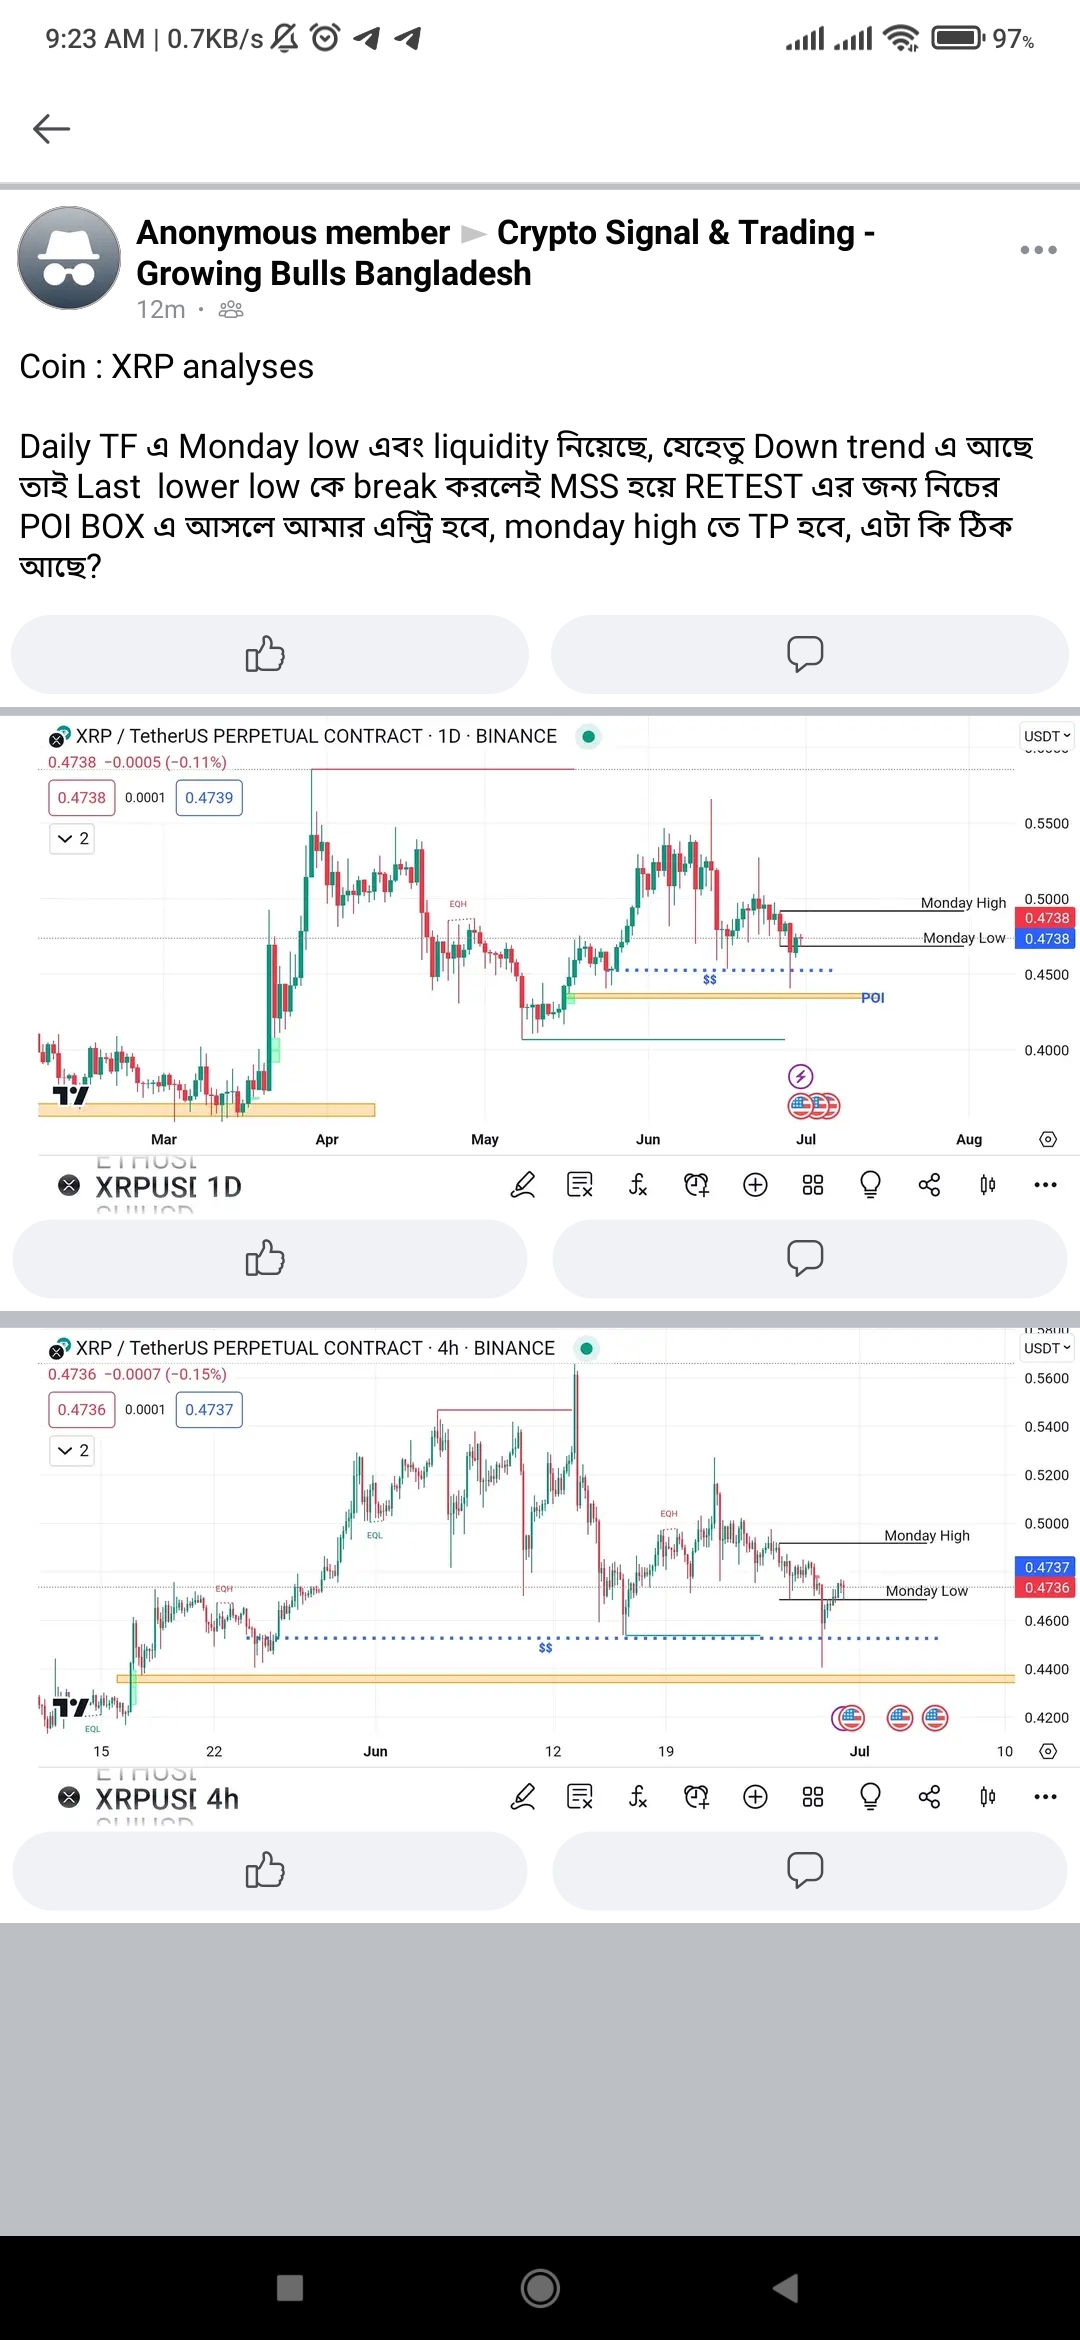
Coin: XRP analysis
Daily TF has taken Monday low and liquidity, since it is in down trend, so if I break the last lower low, I will actually enter in POI BOX below for RETEST through MSS, Monday high will be TP, is it right QVICE?
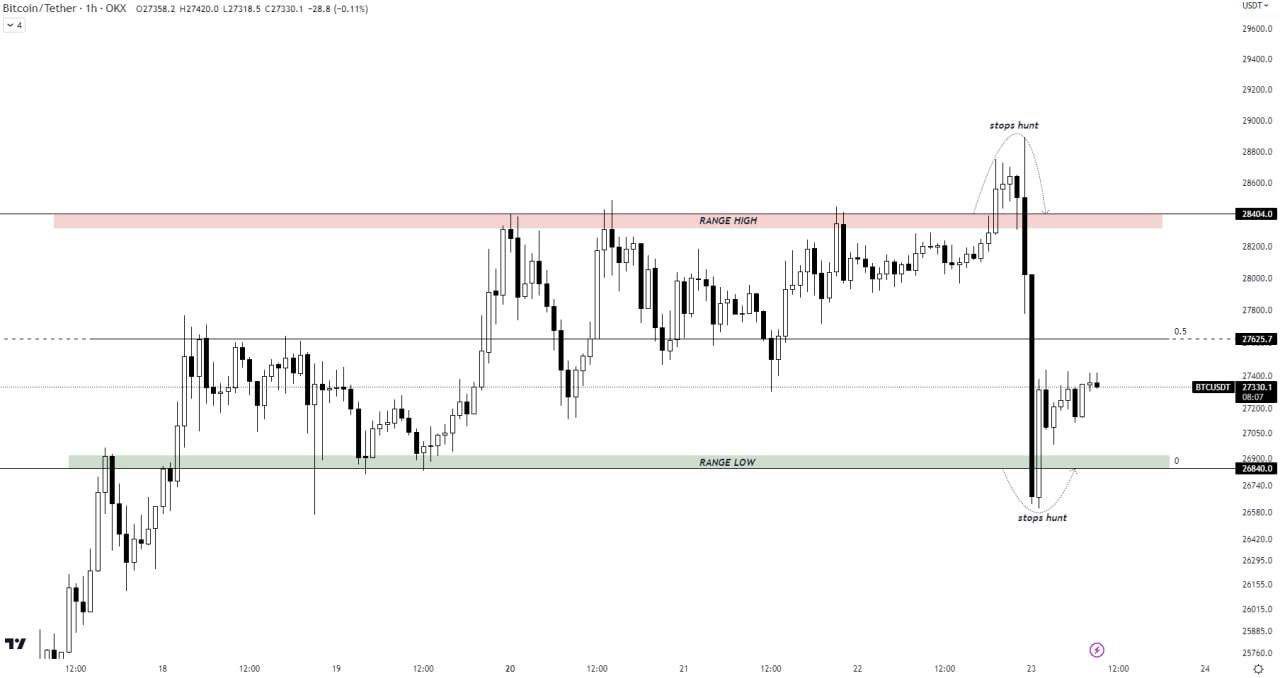
BTC has hunted stops above the range high and below the range low. Currently, it is back inside the range and trading below the mid-range.
The short-term direction of the market is unclear. An effective breakout of the range high or range low would confirm the next movement of the market until we might see further range play.
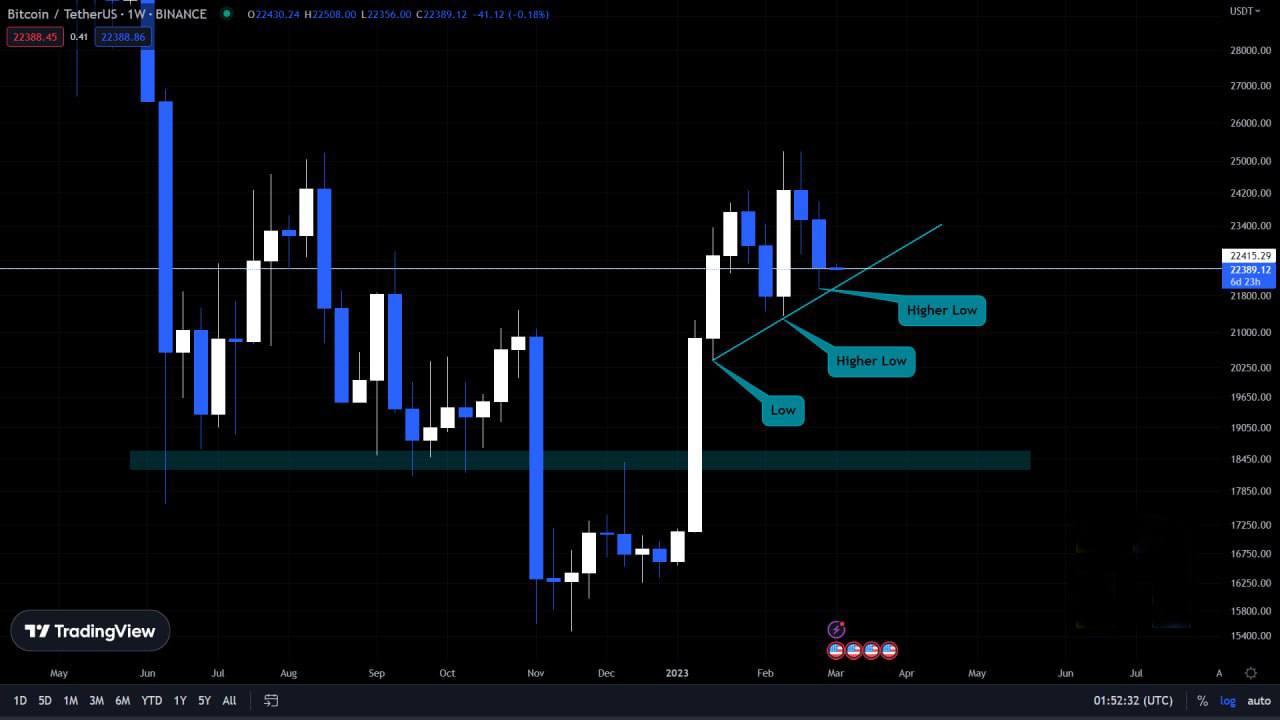
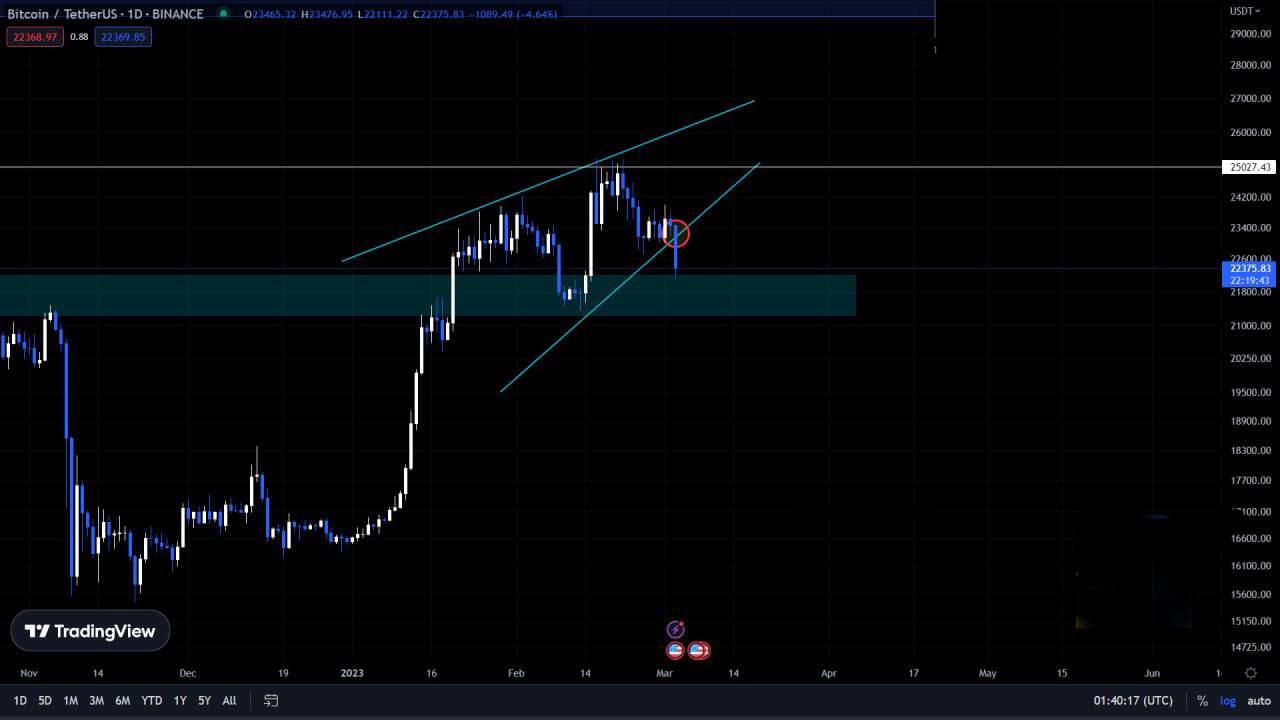
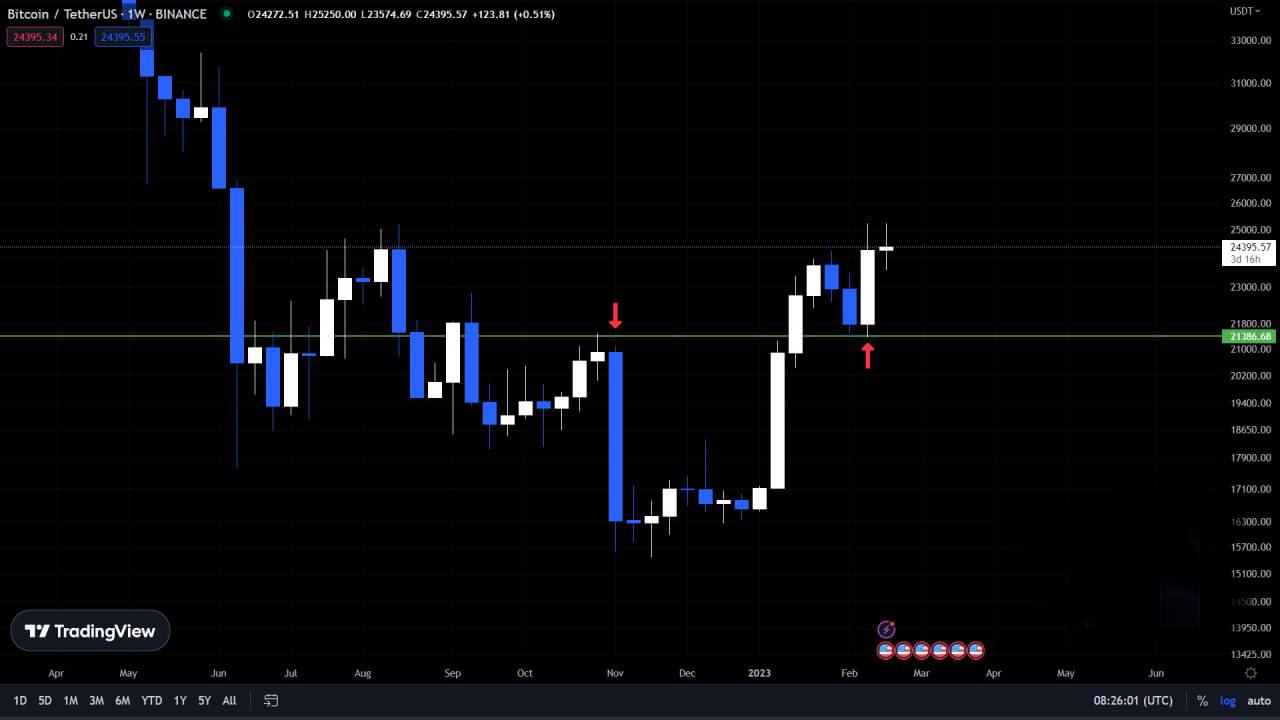
The price has closed below 22,500, which may indicate bearish sentiment in the short term. However, when we examine the market structure, we can see that the weekly candles are forming a higher low and respecting the trendline support. This suggests that the long-term trend is still intact.
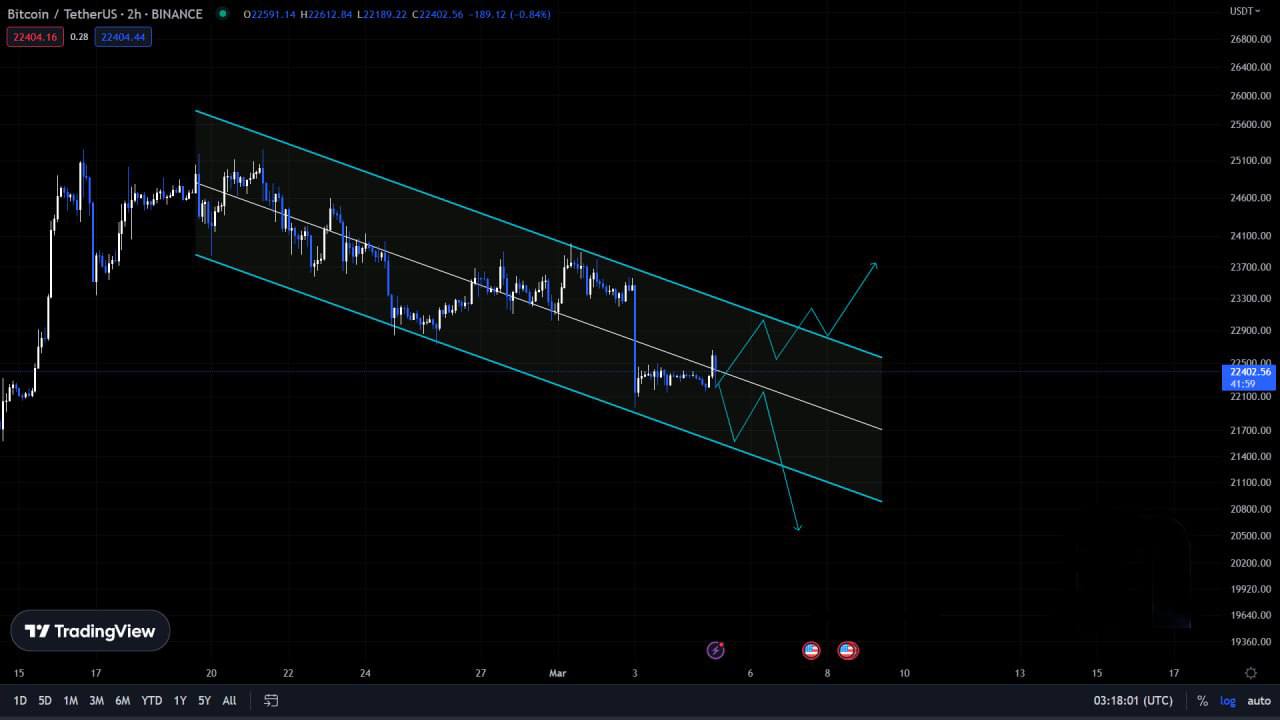
The price of Bitcoin has been consolidating within a parallel channel on the lower timeframe for the past 13 days
A major breakout from this trend could potentially determine Bitcoin's next move. It's important to note that the significant area to break is still at 25k, while 21,500 is likely to be tested
To minimize risks, it is advisable to manage your trades well by setting tight stop losses.
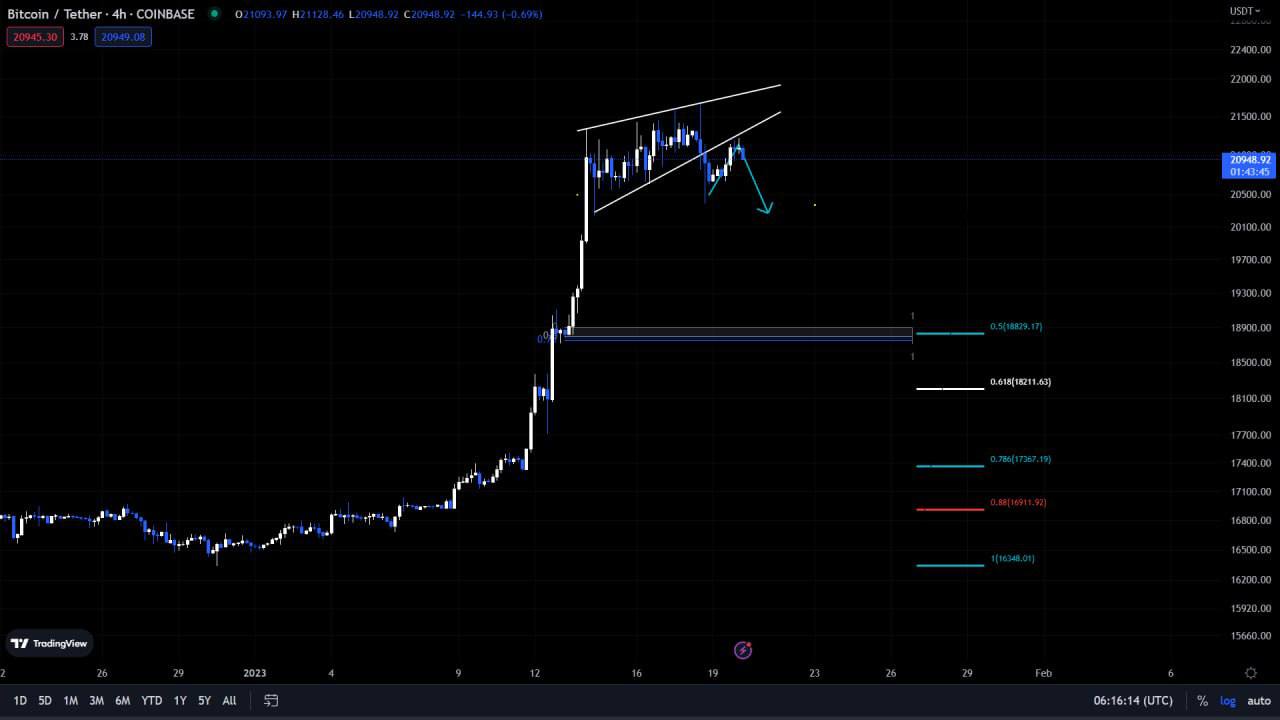
BTC Broke out! BTC broke out of the bearish rising wedge!
The next crucial support sits at $21,386. Breaking the $20,000- 20,800 support would be bearish locally.
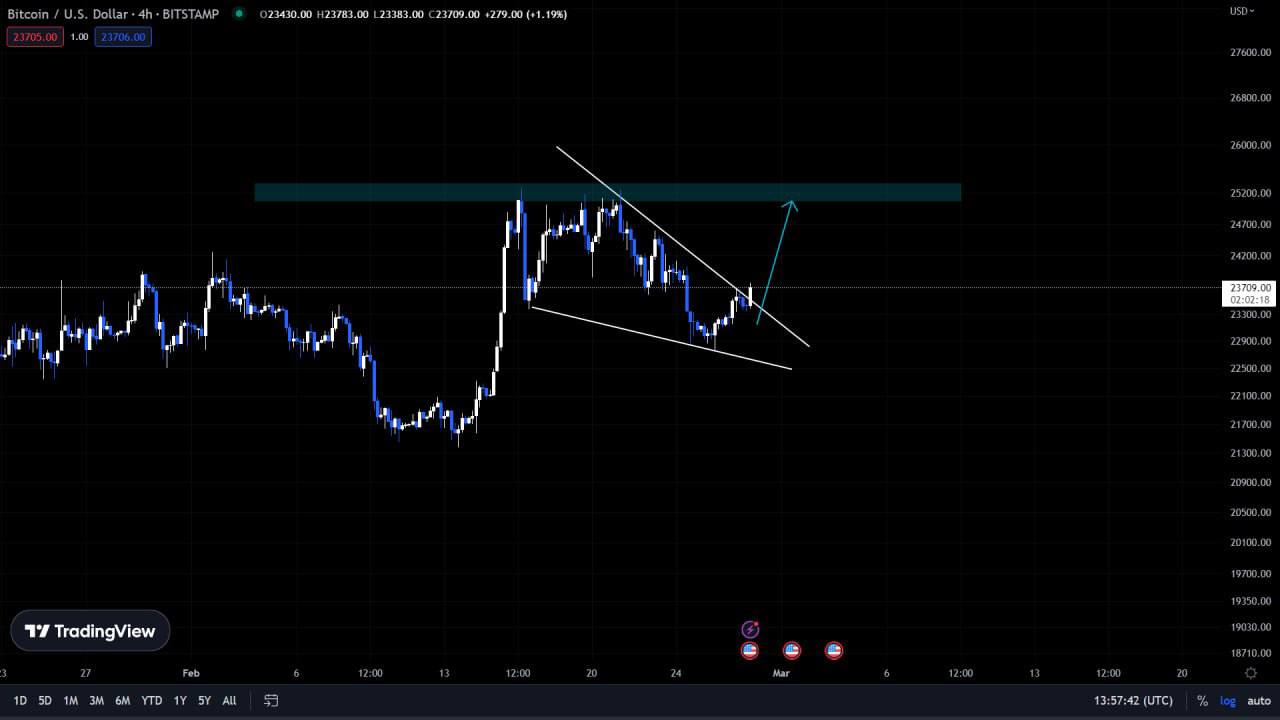
Bitcoin has broken out of the bullish falling wedge pattern on the 4-hour timeframe. If the price continues to increase with significant trading volume, there is a possibility of testing the 25k mark again, which is a crucial level. However, if the price gets rejected again, it could lead to a significant market downturn
When the lower time frame (LTF) becomes excessively noisy, it's recommended to switch over to the higher time frame (HTF) for a clearer perspective. This can provide a better view of the market's overall trend and help filter out the noise present in the LT
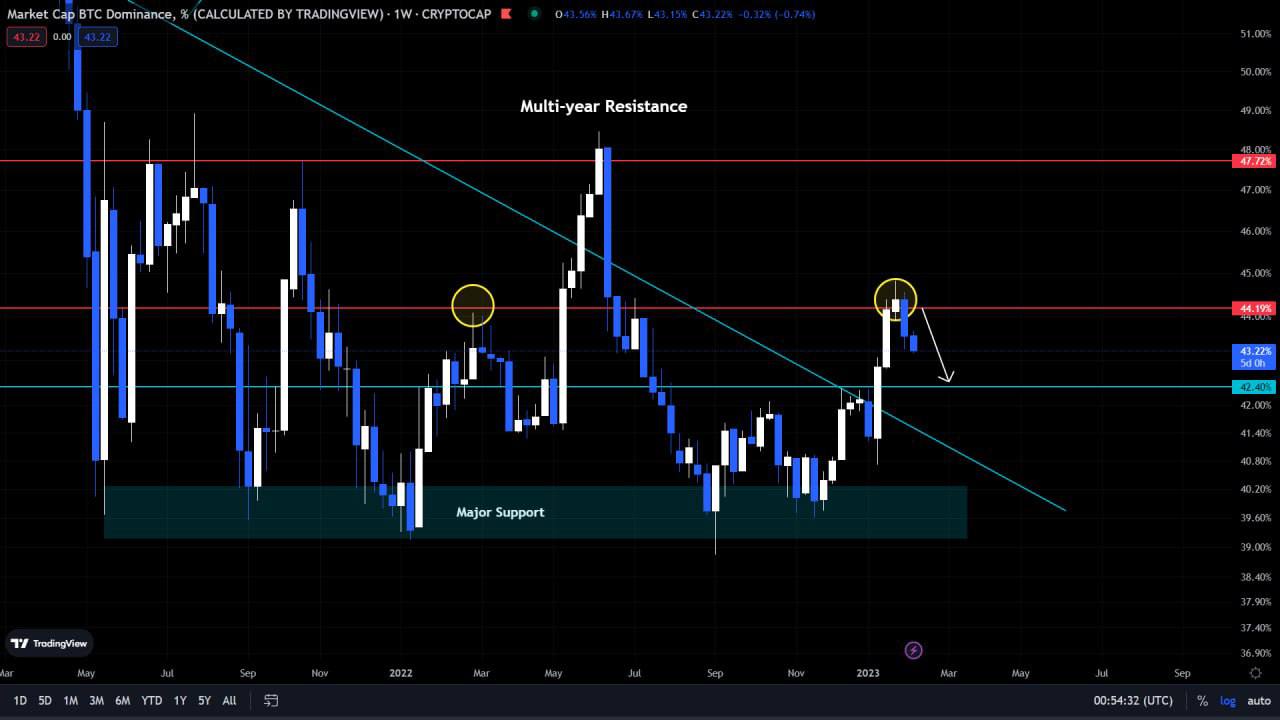
BTC.D has failed to push toward the multi-year resistance and instead has experienced a two-week consecutive drop. This has allowed altcoins to experience gains. The target for this drop is a 42% decrease. If BTC.D continues to drop, the altcoin pump may continue as well.
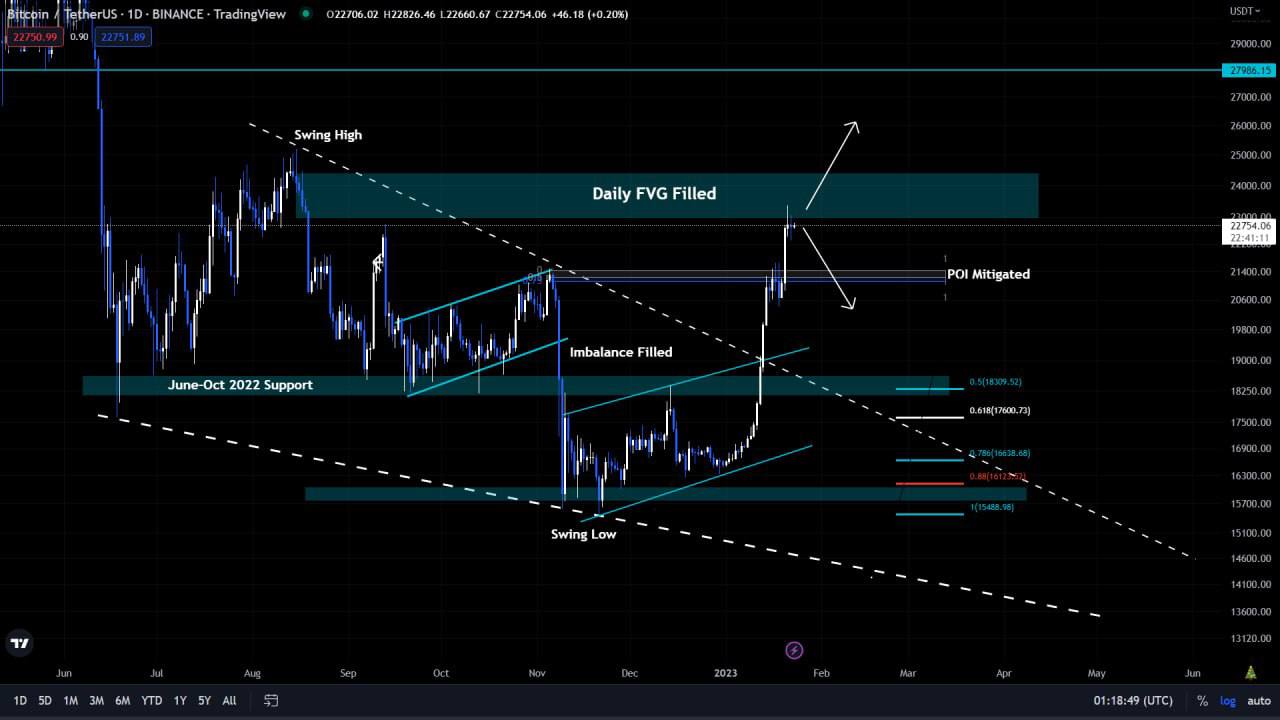
In the Daily TF, bitcoin looks bullish after consecutive green daily candles.
These are the facts that we need to consider in its current state:
1. Ami Bearish Flag invalidated
2. 18k-20k Imbalance filled
3. 21k POI mitigated
4. Daily Fair Value Gap Filled
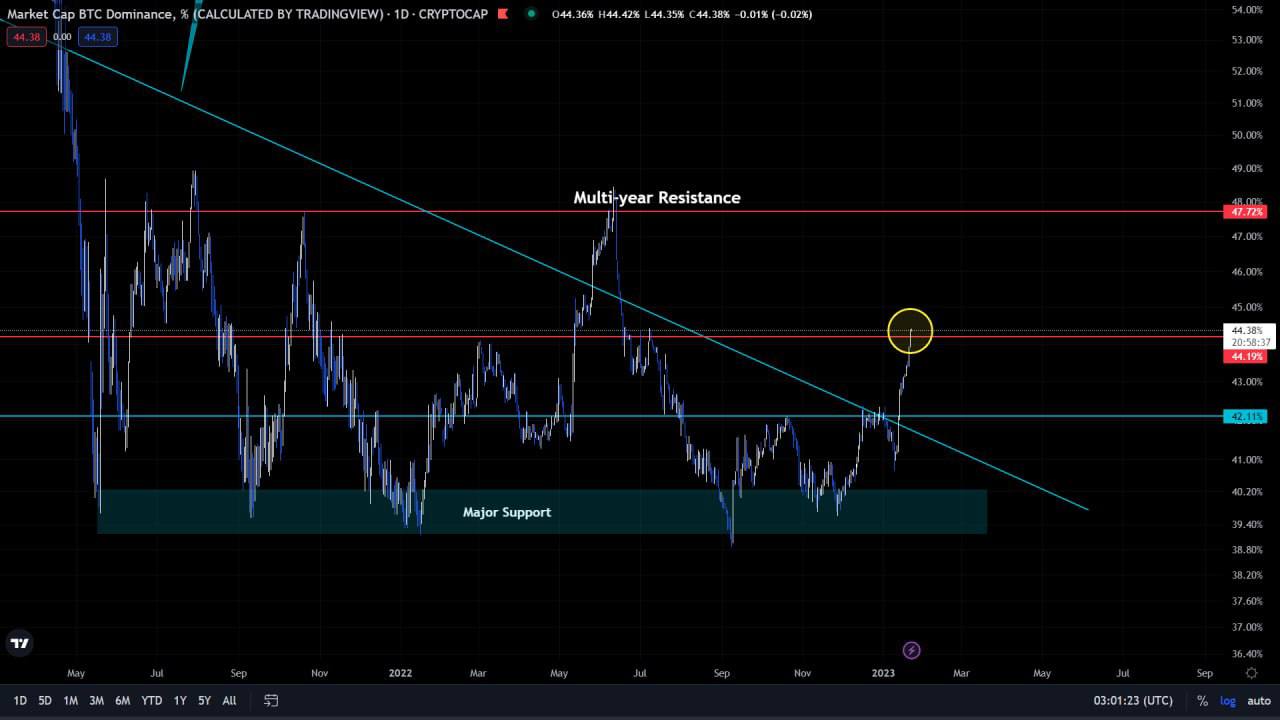
Bitcoin's market dominance has broken through multiple resistance levels and is currently at 44%, as predicted in previous analysis. It is likely that we will see an additional rise in Bitcoin dominance, potentially reaching 47% in the near future.
BTC moved to our plotted areas. And it looks like BTC made a bearish retest here as mentioned previousl. This is an opportunity for short builders. But make sure to look for further confirmations.
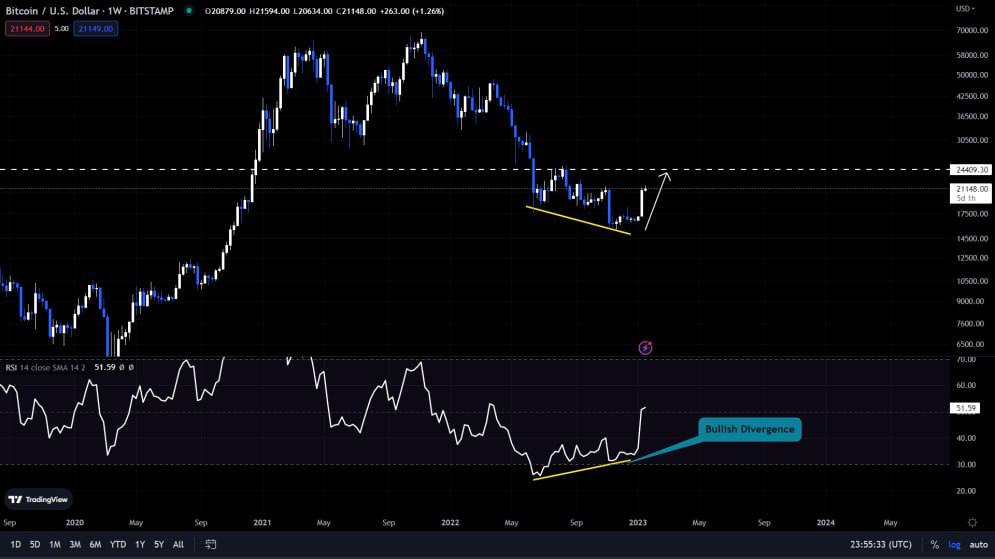
In BTC Weekly Chart we can identified a weekly bullish divergence that had the potential to occur at any time. Upon further analysis, we accurately predicted that the price would increase and this bullish divergence has indeed played out The potential high point for this trend is around $24,000
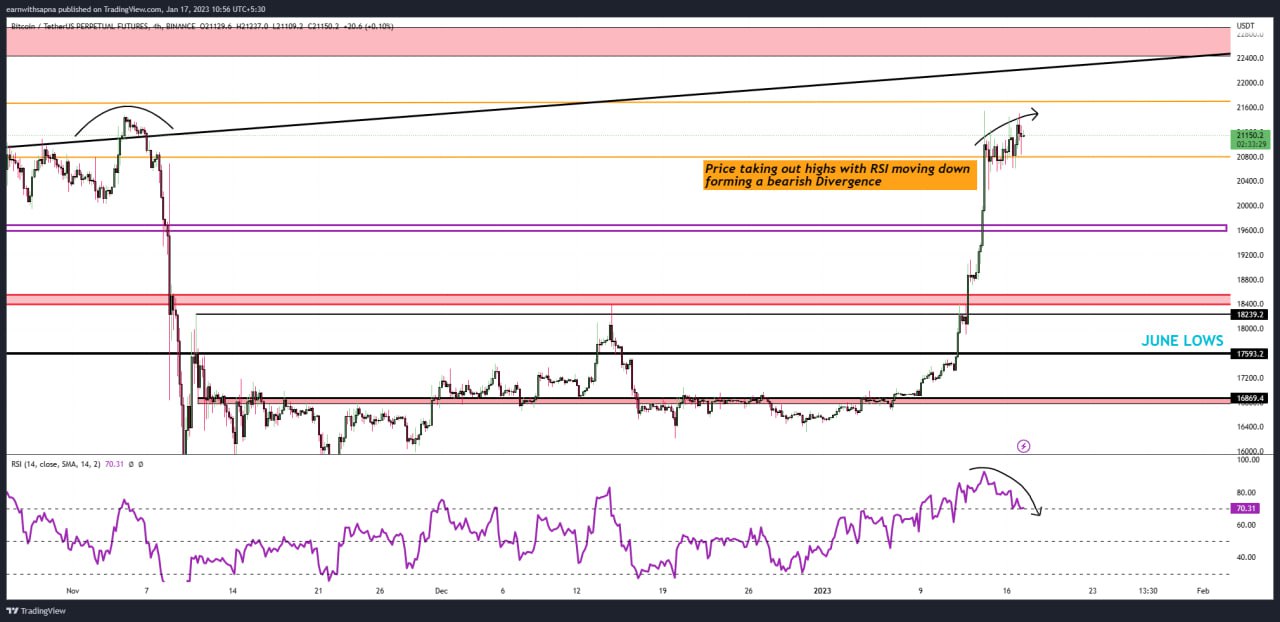
As we can price is taking out highs near 21.5k and immediately falling back below creating wick which is not good. Same with RSI moving down and price up is forming a Bearish Divergence which shows price can take a correction downwards. For this to invalidate price needs to close above 21.5k and then we can trade it towards 23k. If Bearish Divergence plays out first important level of support is near 19.6k which is an old important level for months and should hold.
The importance of having the right information at the right time. This is what differentiates professionals from amateurs. Information that may seem trivial to most people, we know how to make the most of.
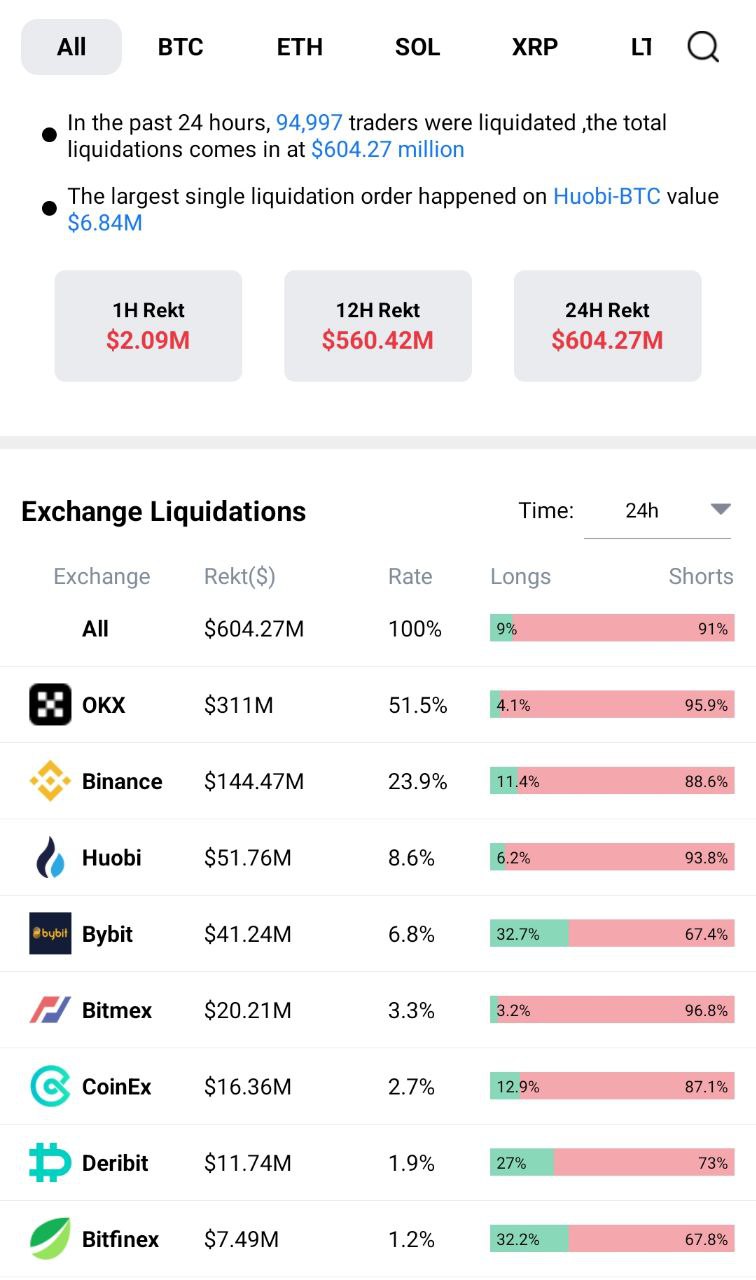
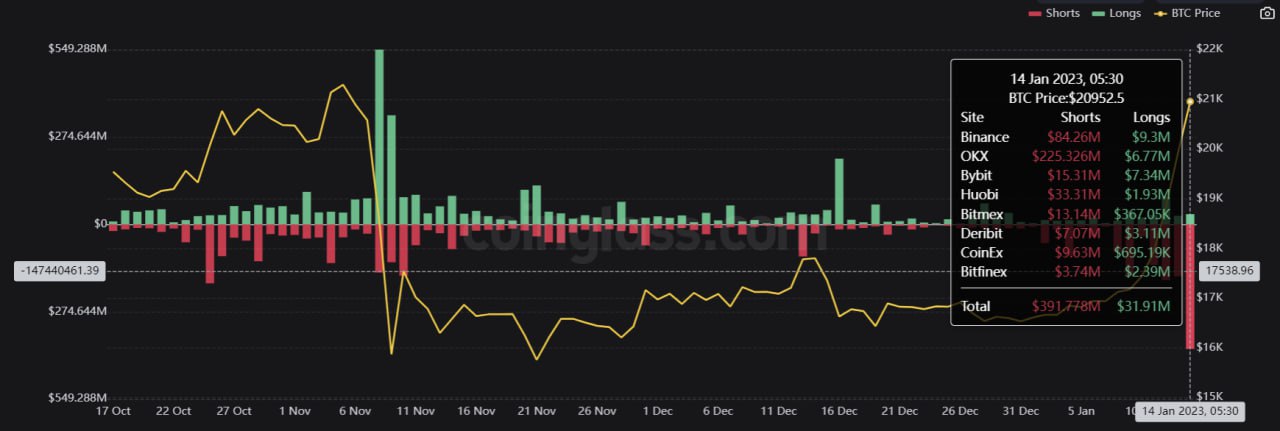
In the past 24 hours , 94 997 traders were liquidated , the total liquidations comes in at $604.27 million. The largest single liquidation order happened on Huobi - BTC-USDT value $6.84M
$82,000,000 worth of #bitcoin short trades just got liquidated - More short positions than any day since July of 2021.
It's been a slow few weeks for Bitcoin with little movement in the market. However, it looks like the next move could be upwards.
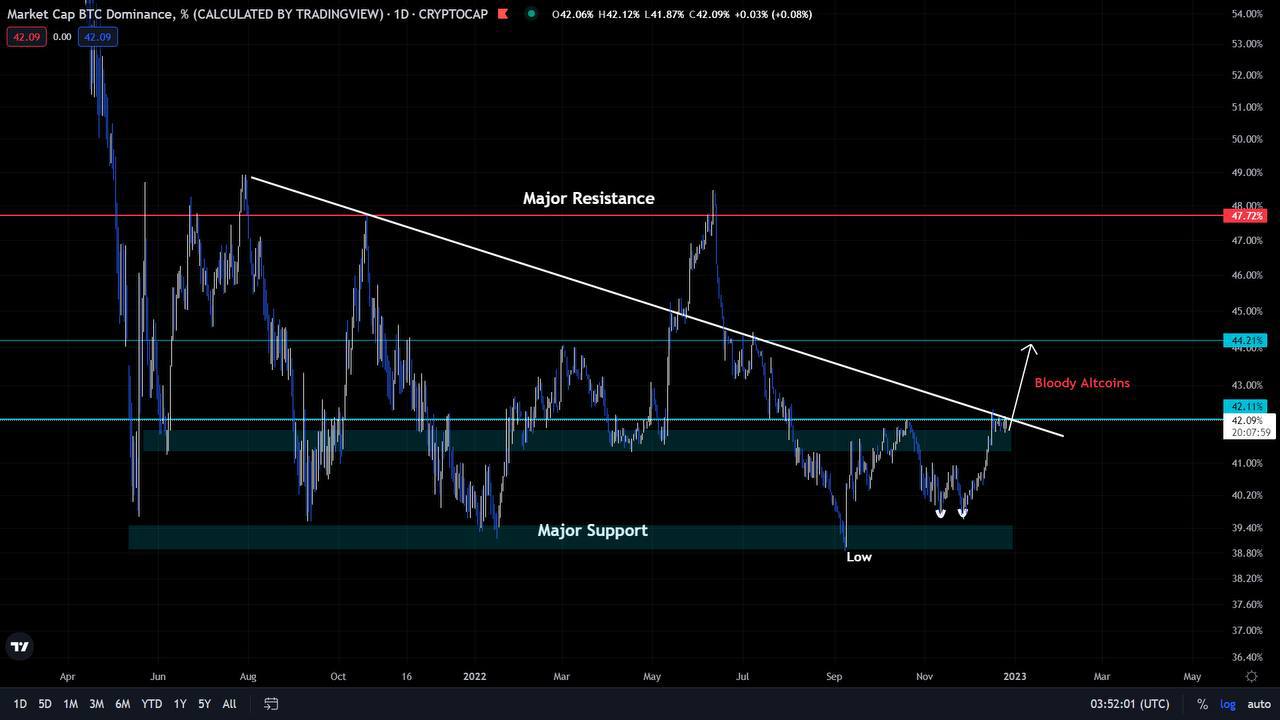
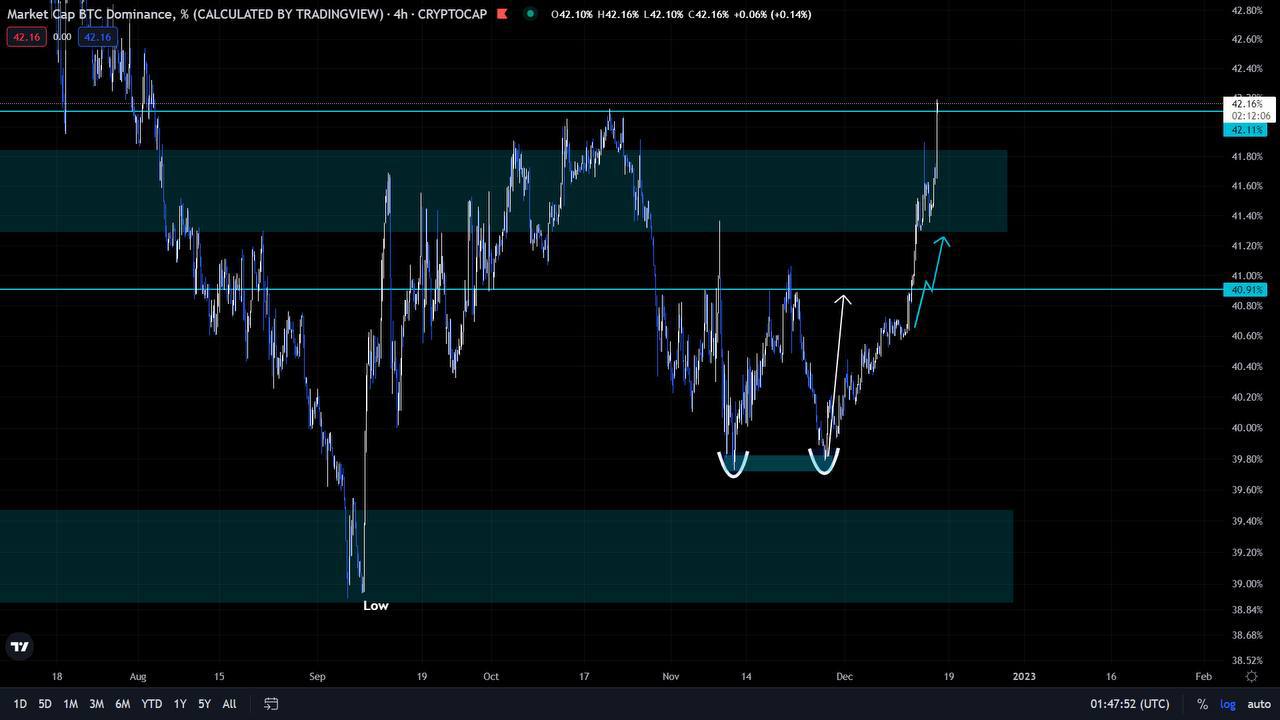
On BTC DOMINANCE we can see, buying altcoins at the moment doesn't seem to be a wise idea given Bitcoin Dominance. As a result of the upward break of the barrier of 41.6%, dominance is currently attempting to break the falling resistance up. Some targets (resistances) from where we may see a rejection are marked on the chart: 44% and 45.4%
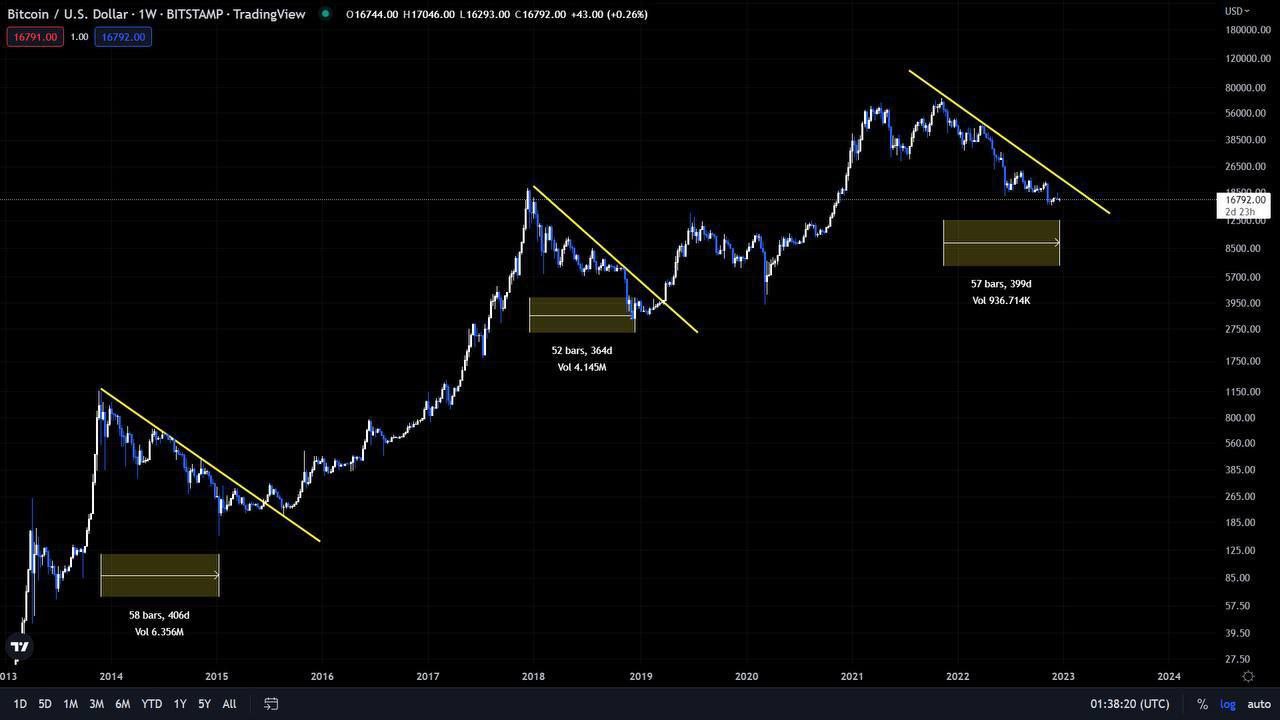
Let's have a look on the BTC Historical Top & Bottom average days.
The 2015 bottom from Top lasted 406 days
The 2018 bottom from Top lasted 364 days
Currently, we are at an average of 400 days since the peak.
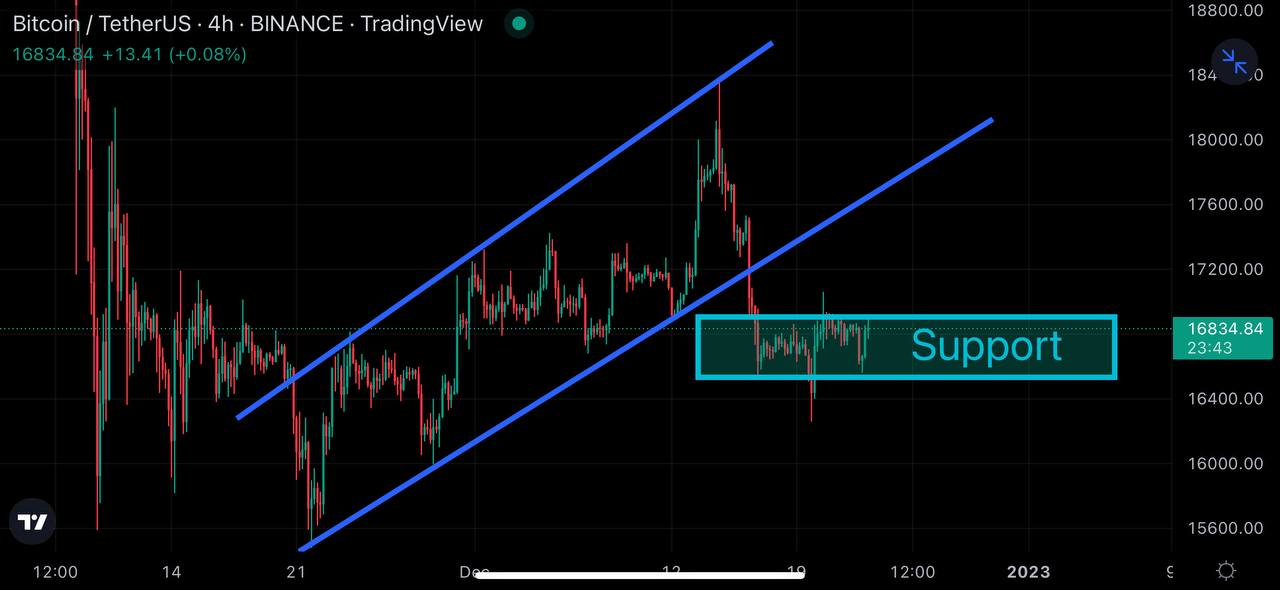
Btc is trying to break the resistance area.
Price is continuously testing the resistance but unable to go above it.
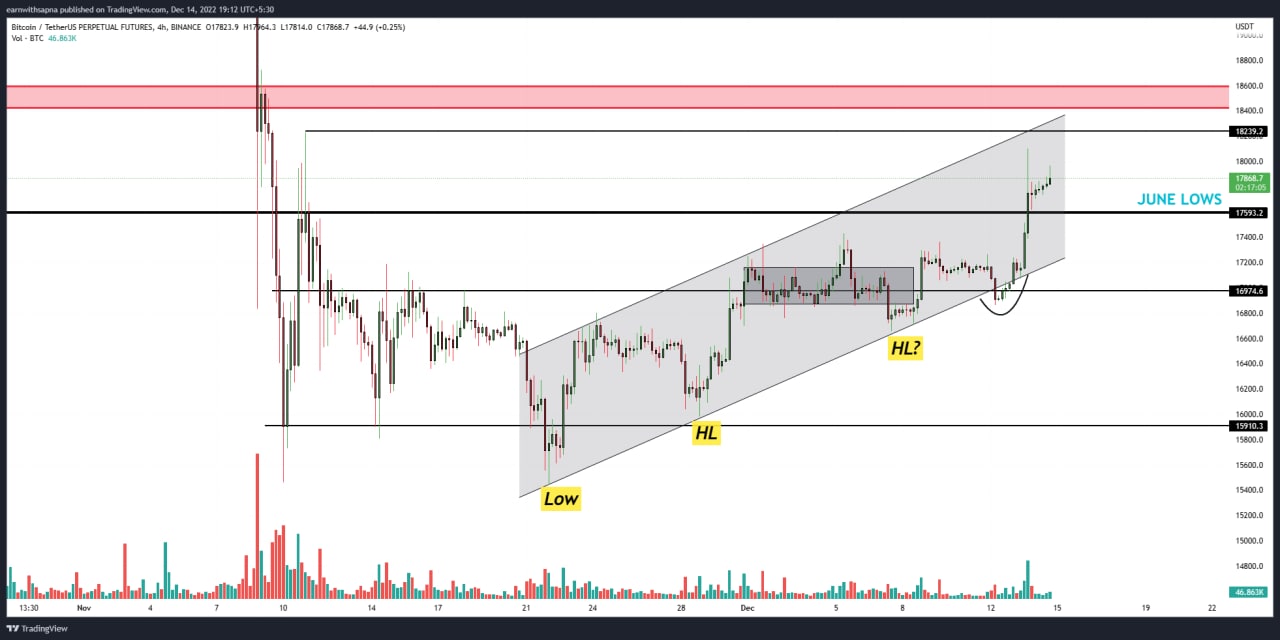
A break above the resistance will send us toward $17,900-$18,200 local resistance area. The support level remains the same. Bitcoin is trading in the range for more than 3 months and we will see a big breakout soon.
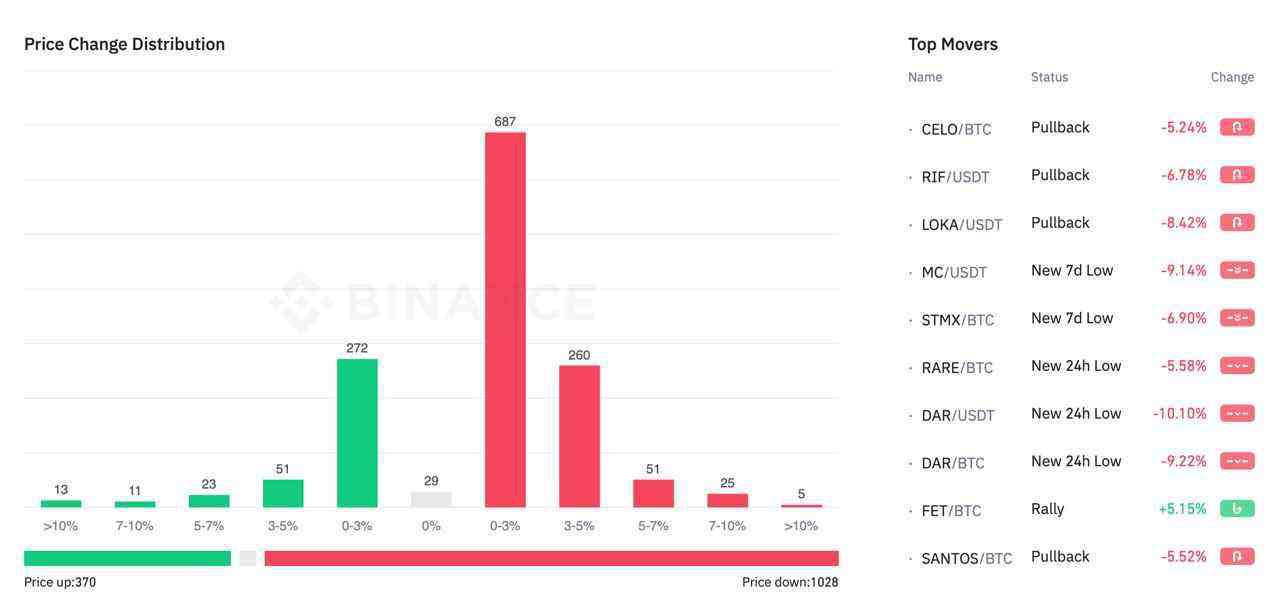
BTC Dominance pumps hard and broke out the multi-month resistance (42%). And altcoins is getting bloody.
Overall market cap and daily trading volume have seen a pretty steep drop over the last 24 hours, pushing most higher market cap alts slightly down and showing a potential weekly correction before upside continuation, for which we’ll be ready before it even starts.
Yesterday's CPI data lower than expected had a quite positive impact on price. Stock markets had a good bounce and after that retraced back the whole move which had an impact on BTC as well. BTC price almost reached 18.3k on some trading pairs which is an important resistance. As we saw 50bps rate hikes and it is most priced in we might have some good movement with this as well.
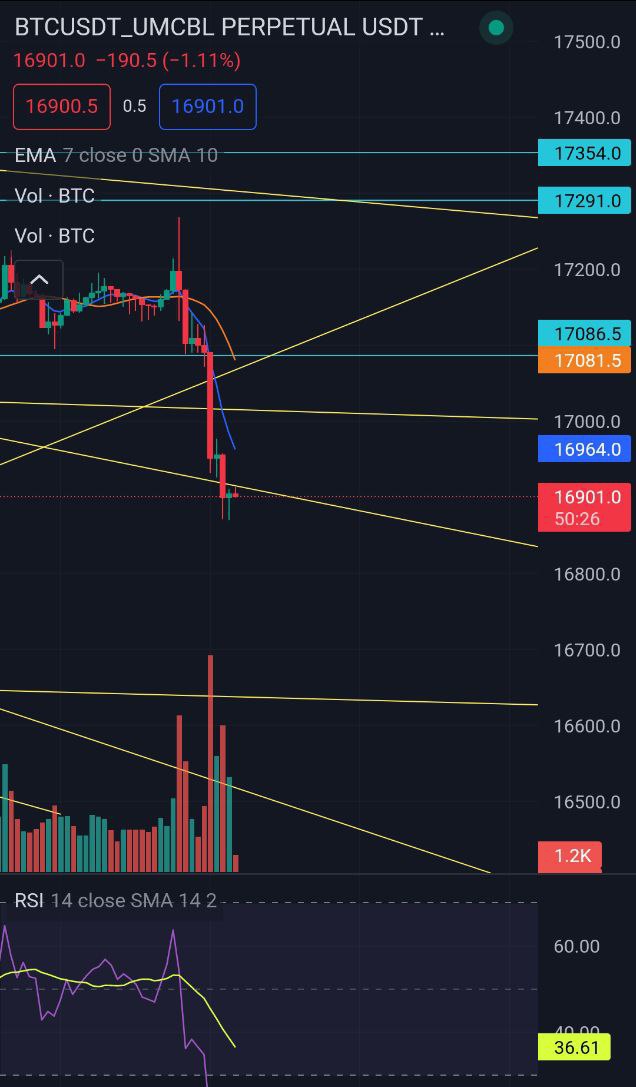
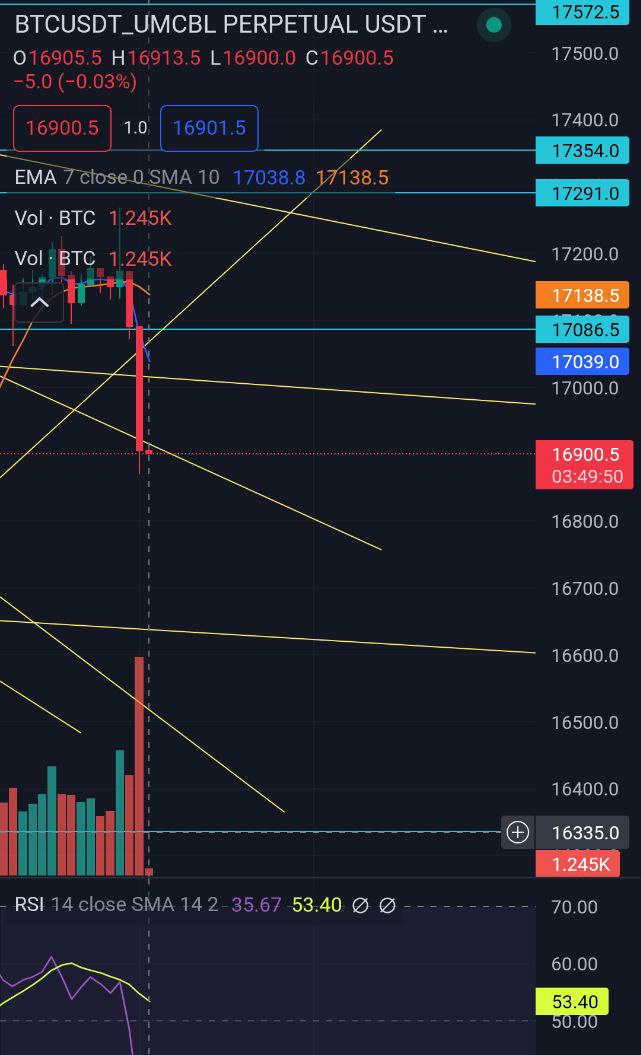
Hope everyone had a good weekend! Looks like we hit consolation through the weekend & BTC broke the top support level of 17085 , 17025, & into 16900. BTC caught top of a new zone Resistance zones if BTC pushes back into the upper zone & RSI tests again
Resistance - Longs
17010
17086
17291 Top.
Bottom of this zone if BTC doesn't move up & RSI rejects
Support - Shorts
16635
16510
Bottom test 16336.
 @Gianna96