This is not a technical analysis. I make a few trades per year if I see an opportunity but I don't day trade. These are a few indicators that I take a look at on a monthly basis and might or might not have a direct impact on Bitcoin's price on certain occasions.
I think they are all somehow important as the dust after the halvening has settled and we now look how each of them played out.
Google Trends
The first one is Google Trends. I just use "Bitcoin" and "Buy Bitcoin" as terms for my searches and also zoom out to 1 and 5-year chart. While google trends do not mean anything special and TA guys will laugh, it still describes the current sentiment.
They don't matter much but they've given me a good indication back in 2017 about the extremely bullish sentiment and FOMO in the end of that year. I remember showing them to traders that had not a clue what Bitcoin was in November 2017 and the next day they all bought.
I usually select the "Worldwide" option and also check a couple of countries individually as the US, the UK, Canada, Japan, South Korea and other countries that have strong economies.

The fact is that the halving event did manage to raise the interest of investors and lots of people looked into Bitcoin, but the interest faded after that and it is similar to last summer when Bitcoin reached 14K. We can see that interest on Bitcoin is waning lately.
Tweets
I moved on to my next indicator "Tweets"

In case you laugh at this, just look at the past years how important it was and how much it faded during the two year bear market.
It seems that this one is weakening as well after the halving. It did reach quite high during the halvening but after that, tweets about Bitcoin began declining in numbers. There is still some hope that the uptrend will recover and perhaps this might mean renewed interest by the tweeter audience for Bitcoin.
Hashrate
Once every two weeks I take a look at the hashrate as well.
Hashrate charts are not so accurate as the blockchain.com one provides the average on the weekly basis, meaning that we don't get data for daily highs and lows.
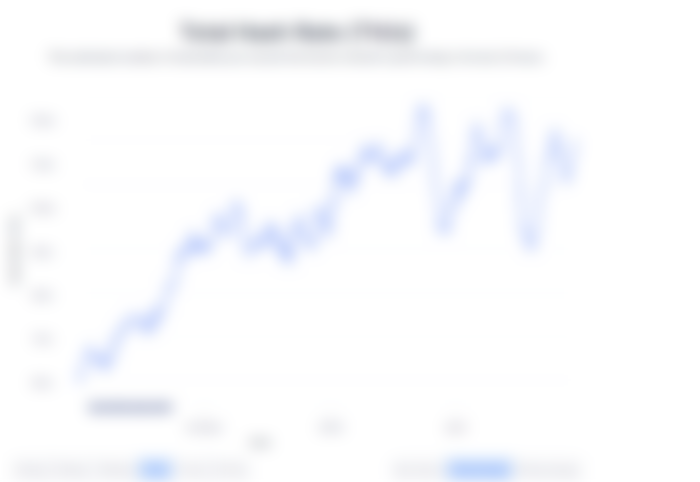

The weekly average seems to be stabilizing after the halving. I've been notified that many miners have already renewed their equipment and some of them have received new S19. I don't know the situation with the deliveries of new equipment, but certainly there is a huge problem with Bitmain lately. Micree Zhan and Jihan Wu are in a constant struggle for power and there have been delays and restrictions in ASICs deliveries from some Bitmain factories. Still there are more hardware producers and it seems that Bitmain will lose their monopoly in this area as well. Perhaps the glory of Bitmain will be a thing of the past soon, even though its two foundaires are already billionaires.
Anyway, I always give a better look at hashrate from the chart at fork.lol which has 2hour updates.


It seems that indeed hashrate did a low of 74Exahash on June 17th, but since then it is mostly stable, no matter the previous difficulty adjustement which was +15%. To be fair I was expecting hashrate to have problems, but it seems that miners right now are equiped with their new ASICs and are securing the network with a stable hashrate of an averate 100Exahash.
Difficulty
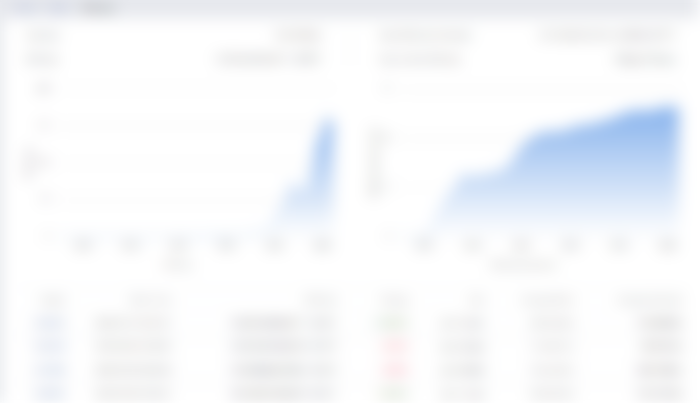

Btc.com provides data on difficulty which adjusts with aim to stabilize the block time for the next 2016 blocks at an average of 10 minutes each. Both these charts point that the halving event did stretch the miners. We don't have growth in hashpower after the halvening, but at least it seems that there is no major problems either.
By the way next difficulty adjustement is tomorrow and there won't be any major change. I always consult the following website as well (cryptothis), which gives a few more details on difficulty and blocks mined.

All these along with various moving averages and oscillators, (most of them are on tradingview) give me a better picture on the market movement and might or might not bring me to a conclussion to buy/sell or hold. I'm not claiming I am a TA expert but I certainly want something more besides wedges, wicks, hammers and whatever patterns traders see in the charts. TA is mostly about averages. Averages is the only scientific approach, so these are what I'm looking at.


Trading view says it is sell on daily, but on the weekly the picture is different, as it would take a drop at around 8k to make the chart bearish.


After observing all the charts and moving averages I suppose it's fair to say that I don't see Bitcoin dropping bellow 8k and if it does it might be a bear trap. After the halving the sell pressure is clearly limited. The moving averages are important and they are analyzed bellow the summarty of BTCUSD on tradingview.
Right now there is no major manipulation, whales are hesitant to make major moves and they are mostly accumulating. The reason is that they would risk a lot if they plan to make prices drop right now. Production price has risen and the miners margins are lower now. There are less mistakes and also less room for manipulation at these price levels. Can price stay at 10K for a while? I guess so, but this would only create better chances for another shot above 10K.
What I observe in the charts is a retest of 10,000 one or two times more. Bitcoin will have to break above 10K decisevely. Once 10K becomes support everything changes.
Anyway while this is not a technical analysis it works for me and I think that some of these are fundamentaly more important than falling wedges and other patterns. When I'm investing for the long run I want to see producers with profits and a healthy market. Right now we are close to the bottom in my opinion in all of these. We can stay at this level, although if price drops further then Bitcoin might not have a chance to recover for years. The halvening is probably having a dramatic effect on prices. I wasn't around during the last one, but from what I understand, things weren't so different.
Header Image Source - Modified