 @stewbits22
more from that month
@stewbits22
more from that month
The blue line on the chart is the BCH 3 day 200 moving average. Its turned positive for the first time ever and is increasing at the same rate as it decreased.
 @stewbits22
more from that month
@stewbits22
more from that month
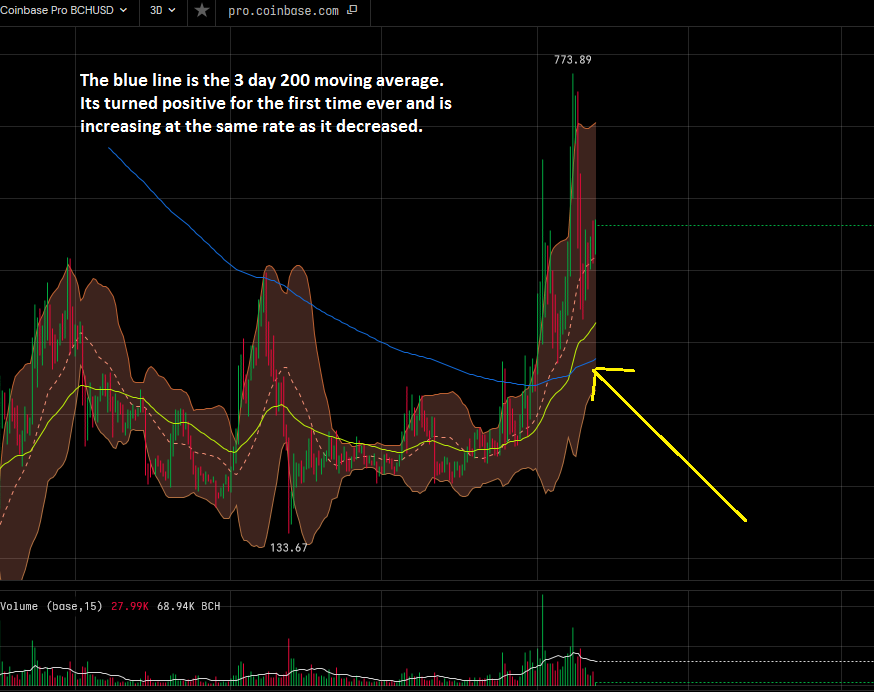
The blue line on the chart is the BCH 3 day 200 moving average. Its turned positive for the first time ever and is increasing at the same rate as it decreased.
Log in to join in Reading is open to everyone. Replying needs an account.
1 comment
You are the best sir stewbits😍😍