 @nomadghada
more from that month
@nomadghada
more from that month
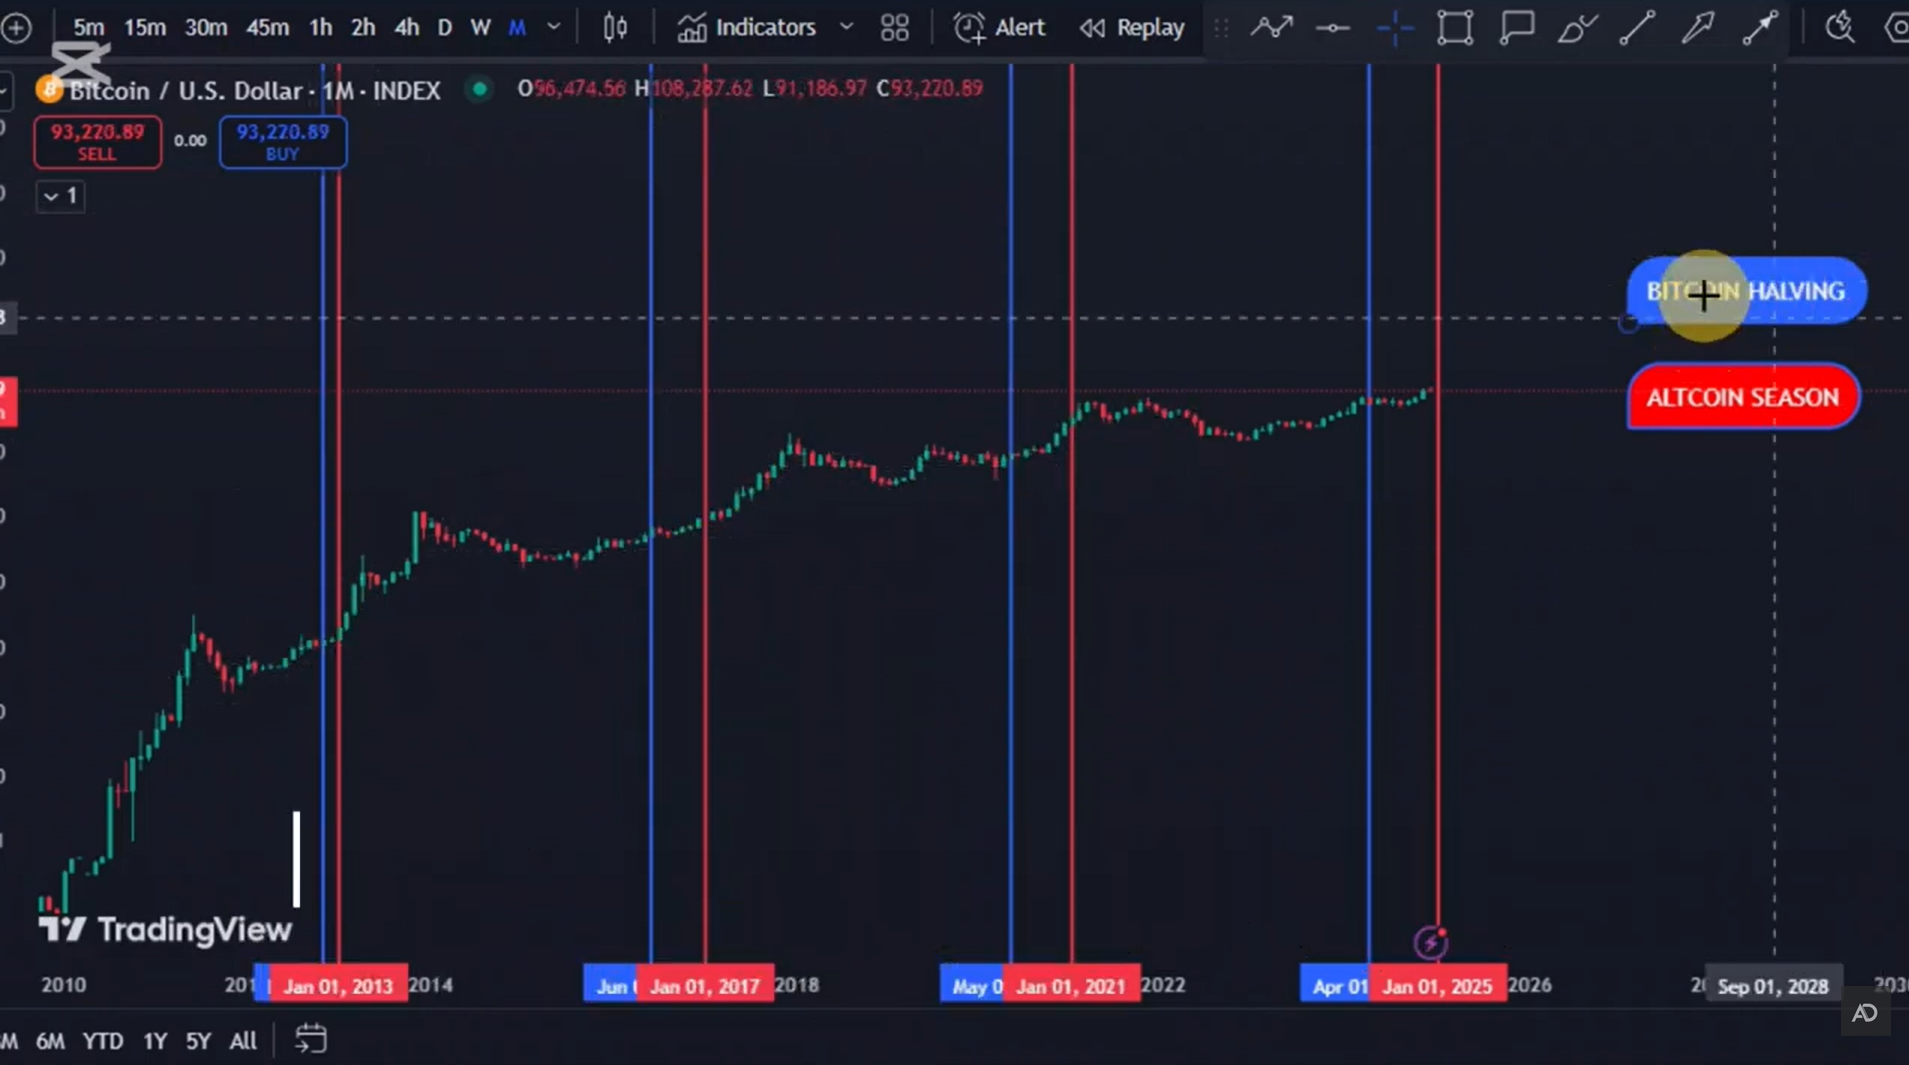
Could Bitcoin Cash 10X in 2025! Note: This is not a shill article, or a rant about personal feeling. Nor is it a run of the mill copy paste summary about limited supply and low fees. *This is isn't even an article at all.* ***What it is, is a discussion on the technical analysis.*** *****Which isn't done by me.***** 10X in 2025 I am not claiming to be another craze wolf howling '***To the Moon!!***' and saying that this is what going to happen. But, I am asking if someone much more wiser than me can, based on the data, find it plausible? Perhaps @MarcDeMesel or @CashDragon or @BitcoinBaby or anyone else who has a better understanding of technical analysis. I like to watch research videos and recently came across 2 channels that are making technical analysis on BCH and here is what they have modeled: 1 **Firstly** we have Altcoin Doctor who has showcased a R-model with Bitcoin halving marked out before the **what he calls** the "alt season" (*although I don't like the term ALT*). https://www.youtube.com/watch?v=45m0L1qchE4
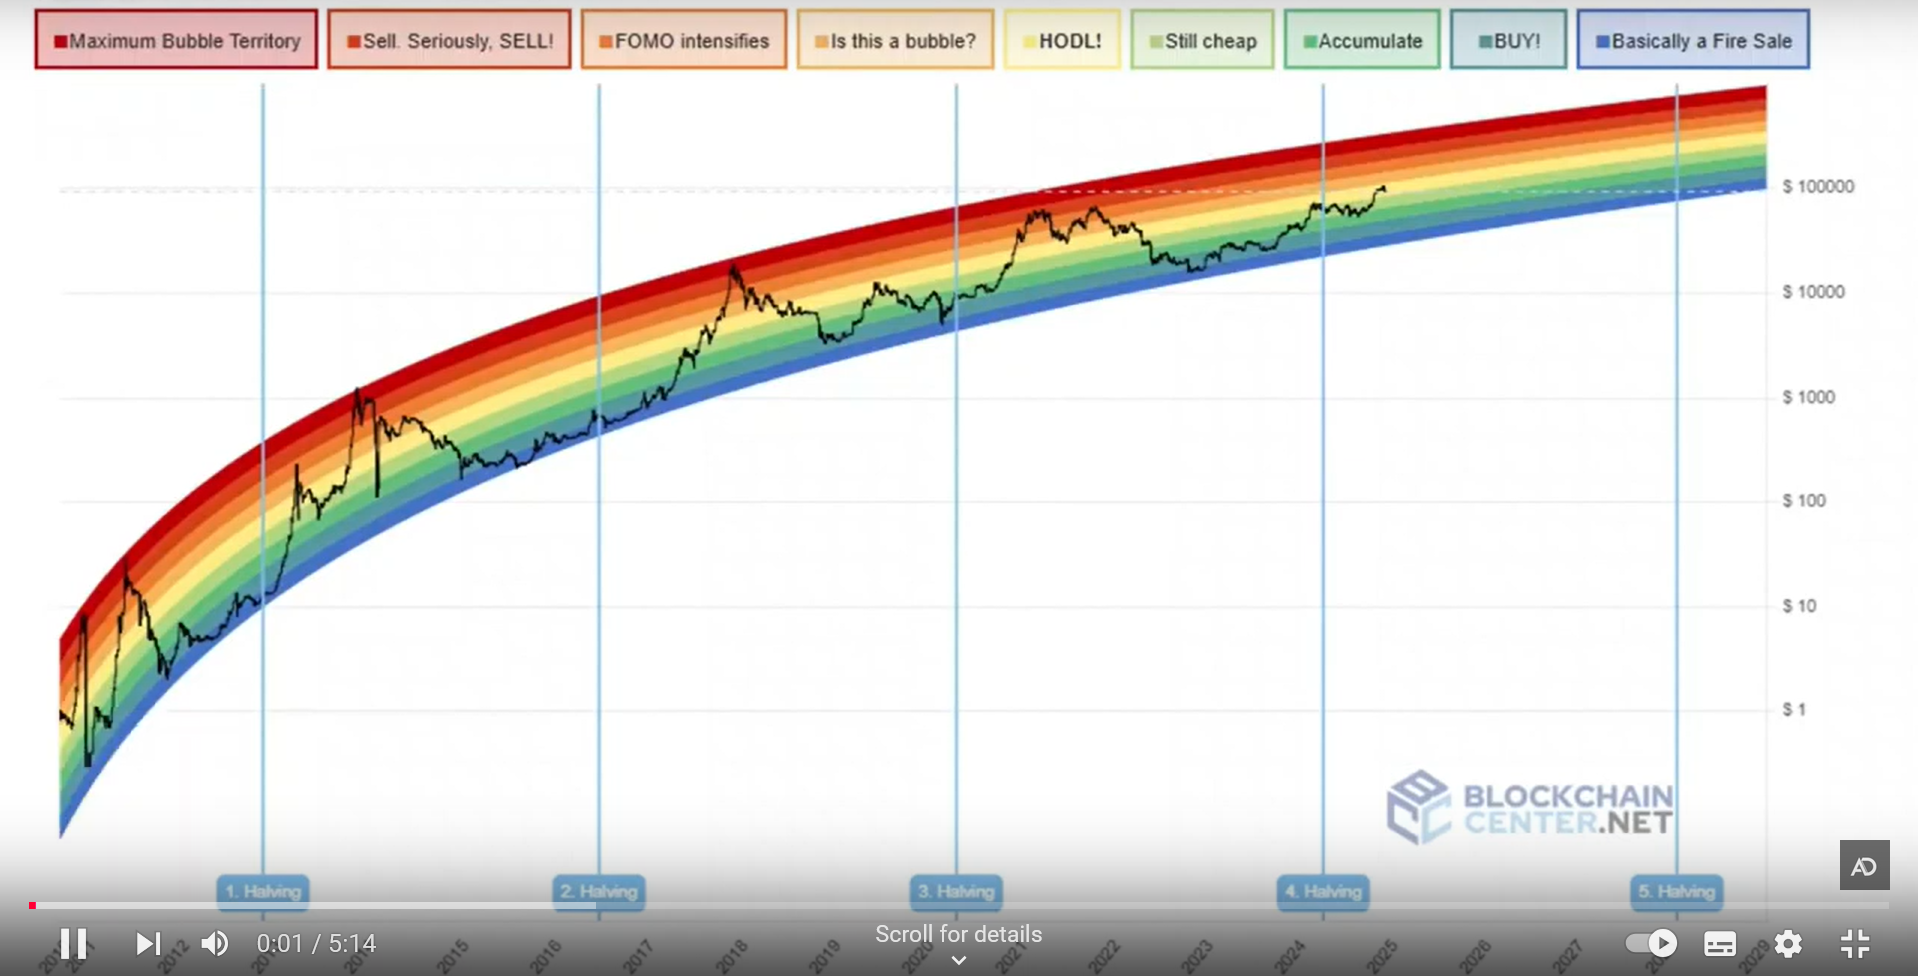
As per him the "alt season" happens one year after halving event:
Then he uses The Fibonacci Retracements levels on the 1 week candle chart of BitcoinCash / USDT from KuCoin exchange.
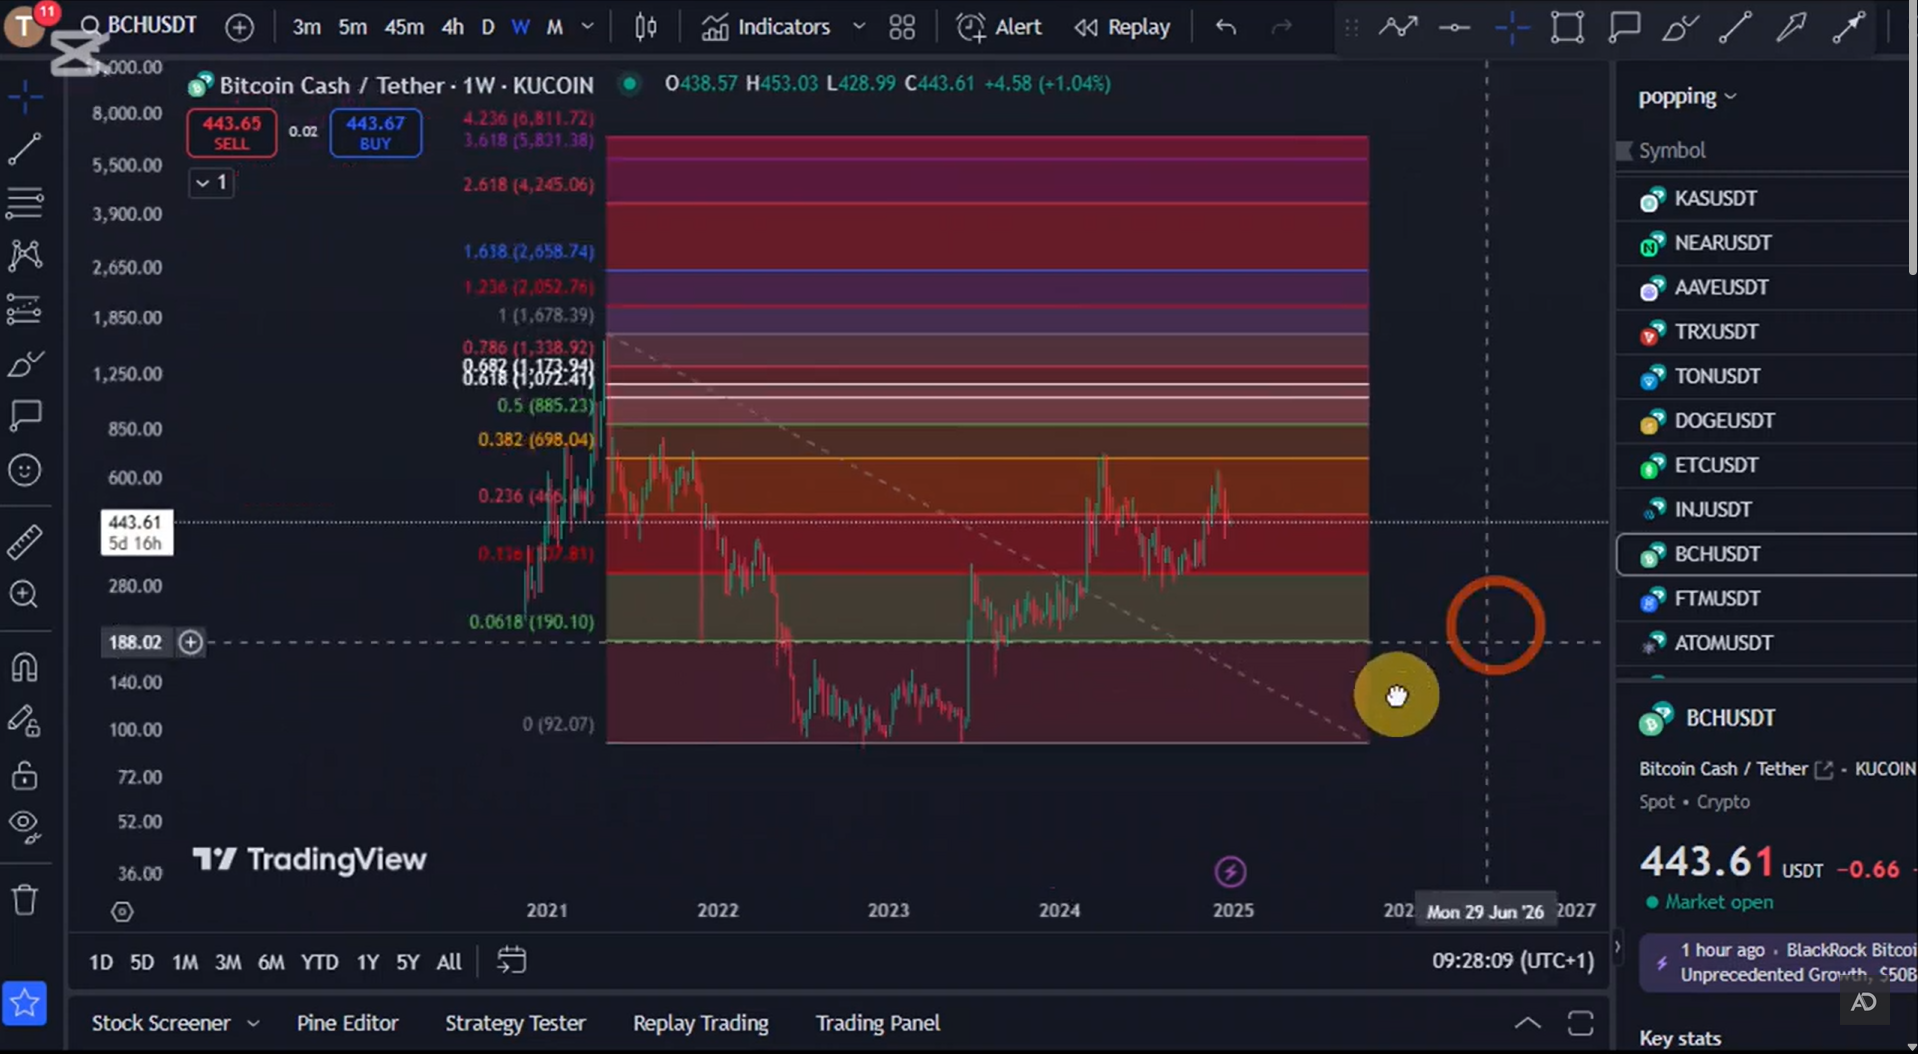
So as per him because Crypto other than BTC should pump in 2025 based on historic trends and from Fibonacci levels, BCH could reach to **$2,618.96** if we hit **61.8% level** and **$6,903.85** at **423.6% Level**
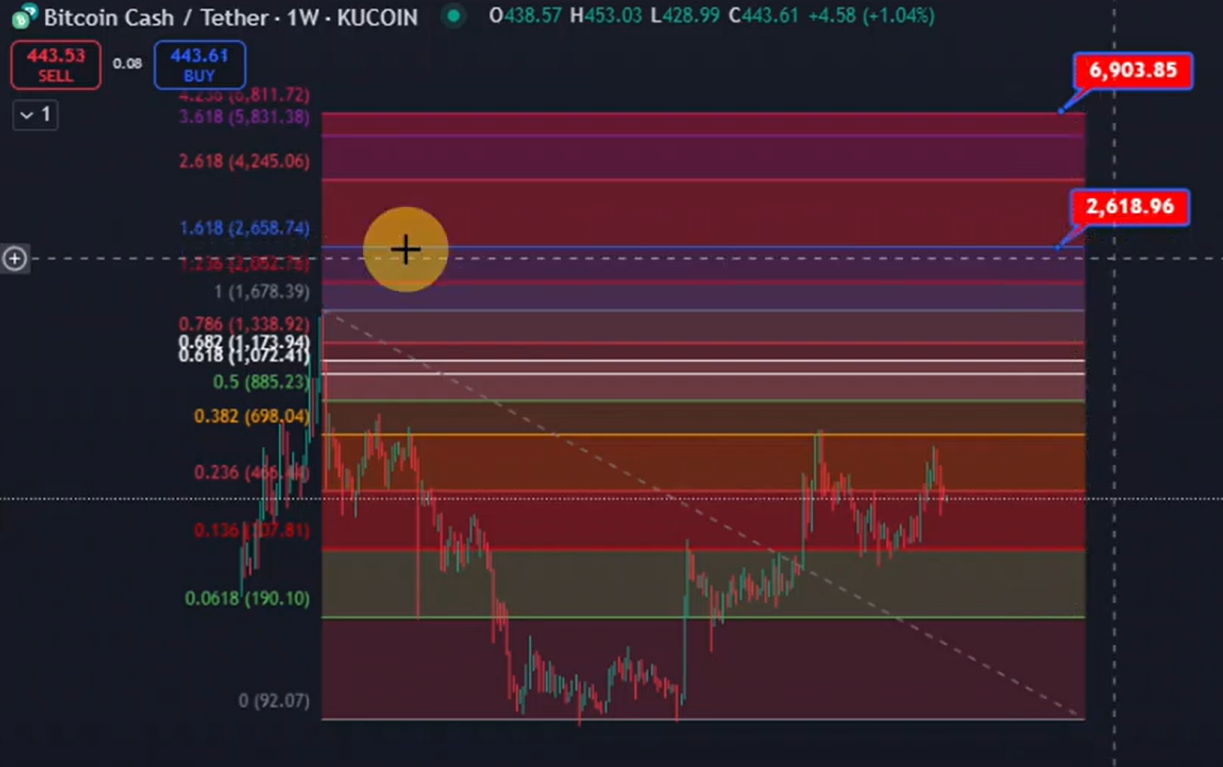
Which seems a little bit too optimistic to me, *but this is crypto and you never know with crypto.* Currently 1 BCH is 436.22 USD Here's the video in question: https://www.youtube.com/watch?v=45m0L1qchE4 2 **Secondly** we have High Altitude Investing who's model is to compare 8 Day candle chart of BitcoinCash / USD from Coinbase. https://www.youtube.com/watch?v=sdeGDzR67KA
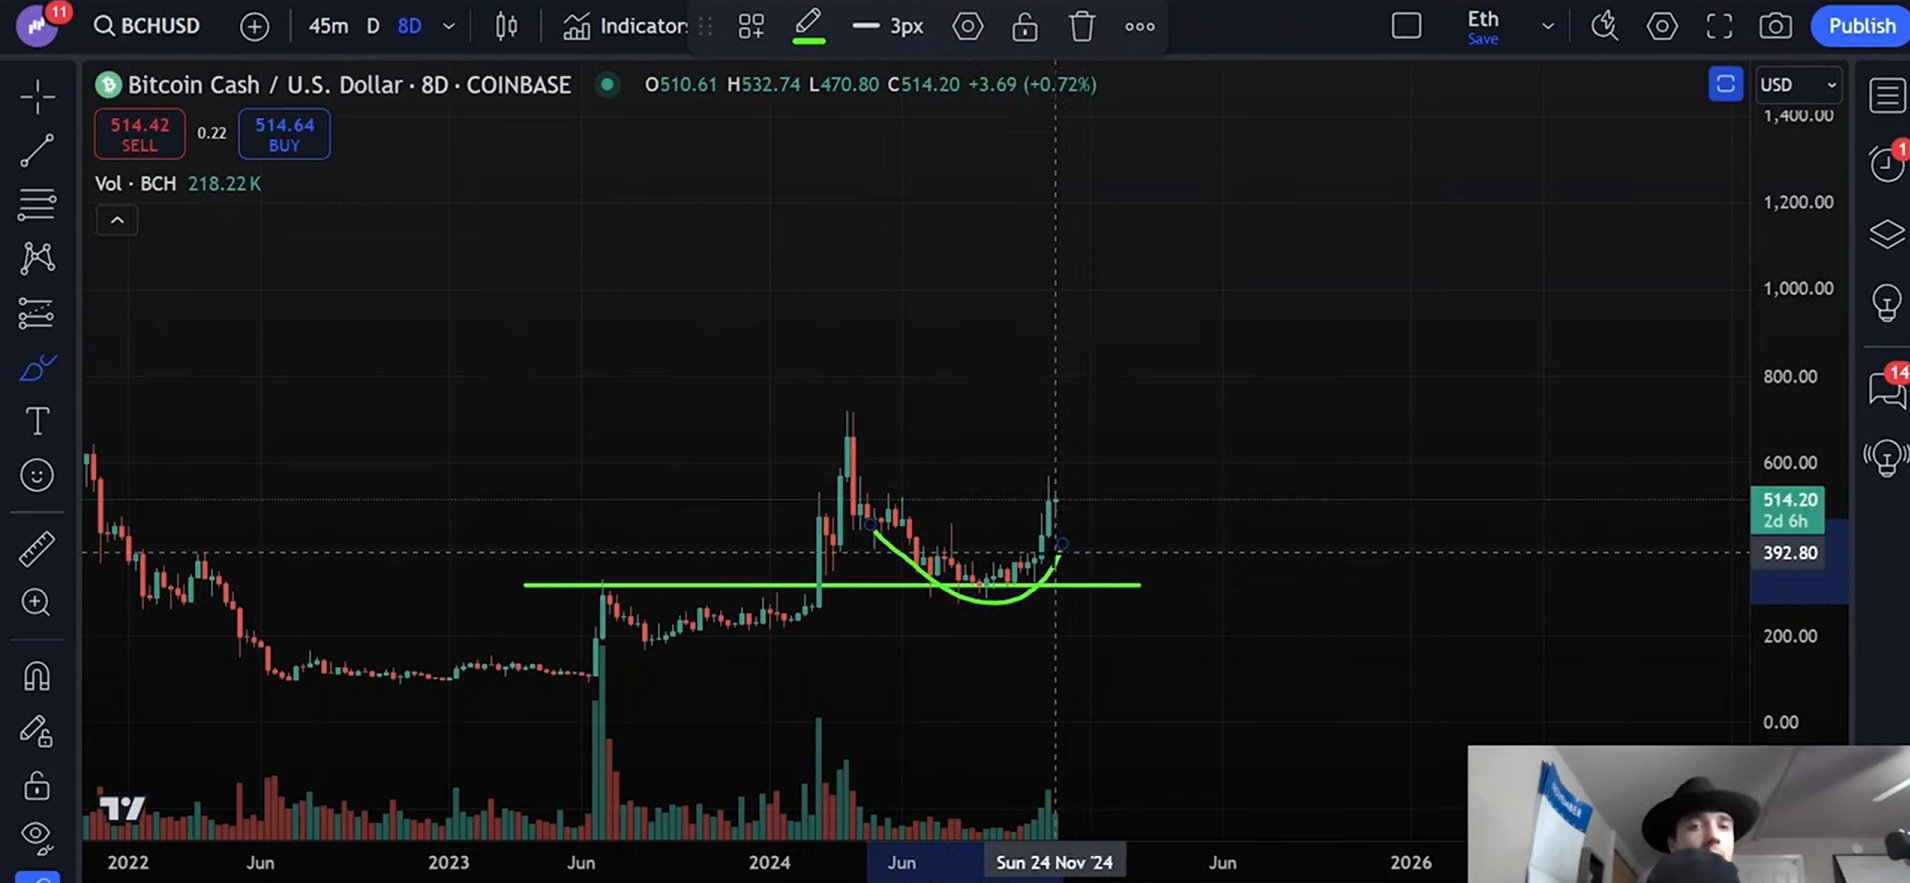
His approach is that with the support level on that chart and how we are starting to see a rounded bottom, we should see a significant price increase because of what he sees is the market structure. And here he compare BitcoinCash chart with other coins to showcase this market structure. Here is a comparison with BTC:
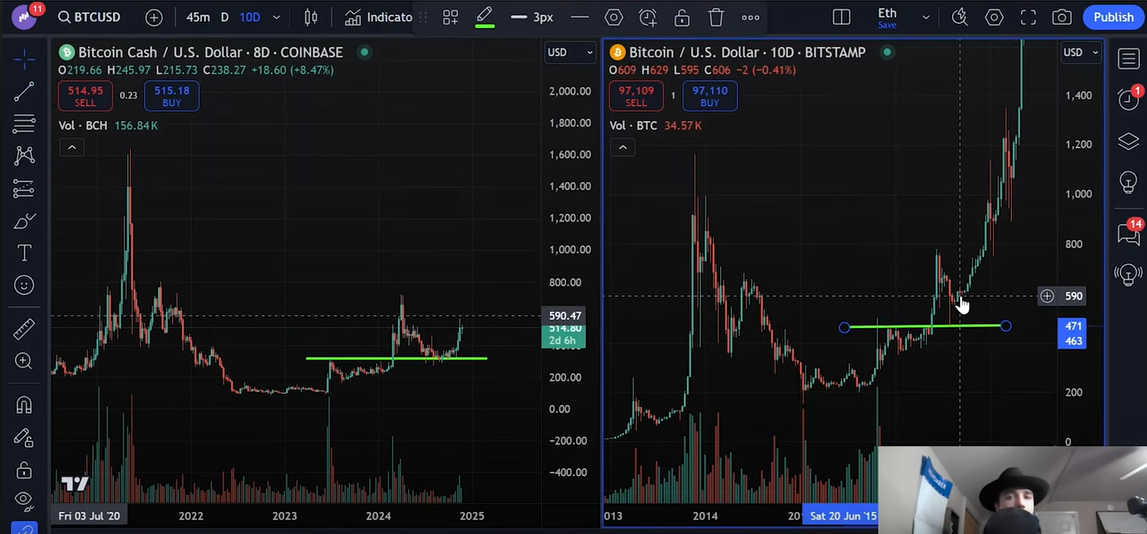
Here is a comparison with DOGE:
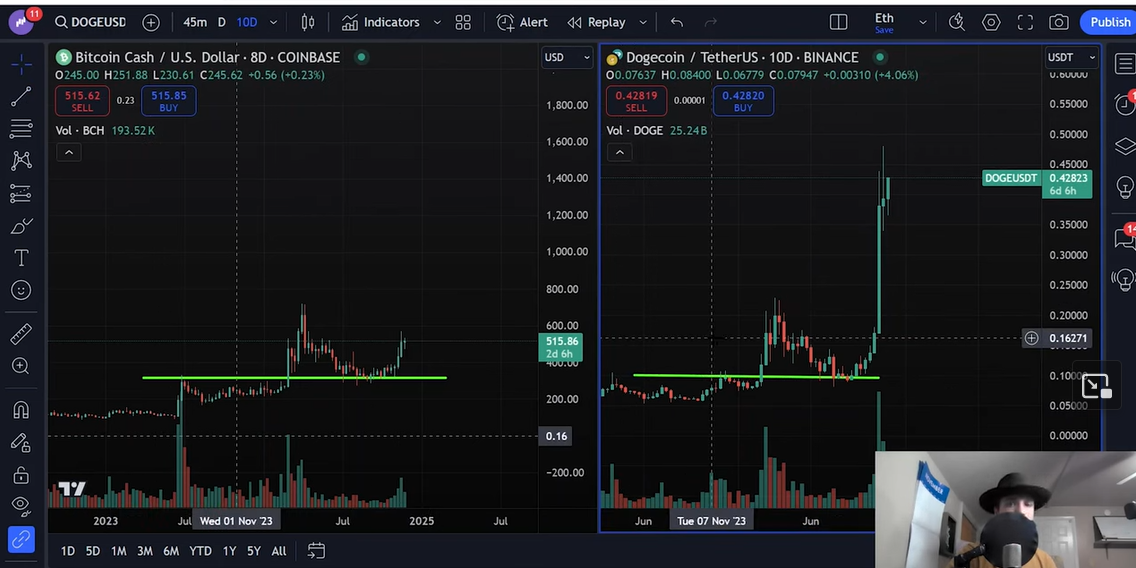
Thus his prediction is that we should see a similar pattern here with BCH:
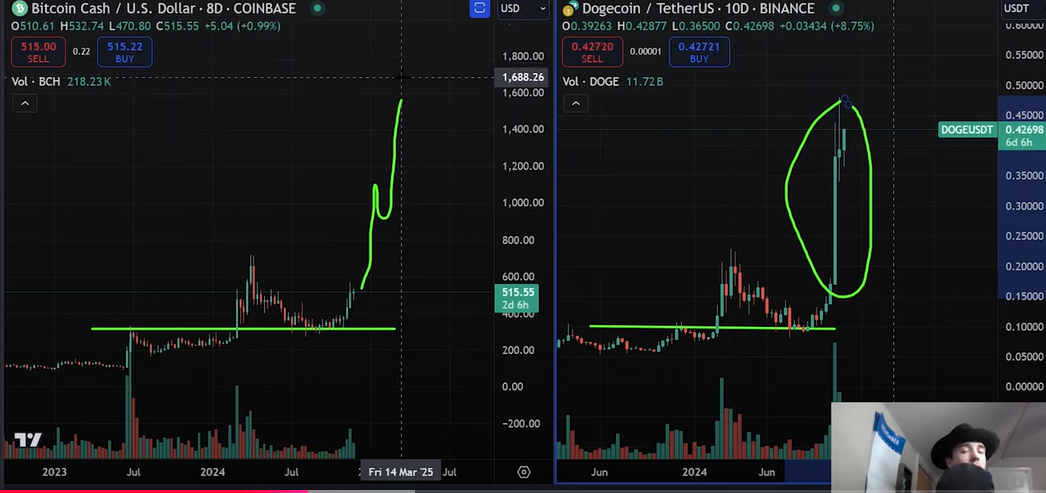
He also empathize that the Dogecoin chart has good correlation with BCH as DOGE growth was parabolic and happened in 3 waves:
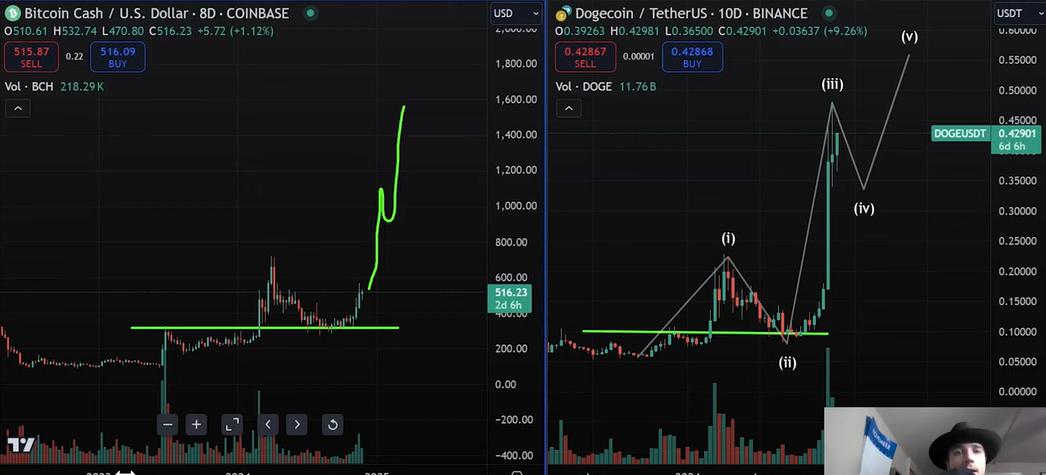
Here is a comparison with LTC
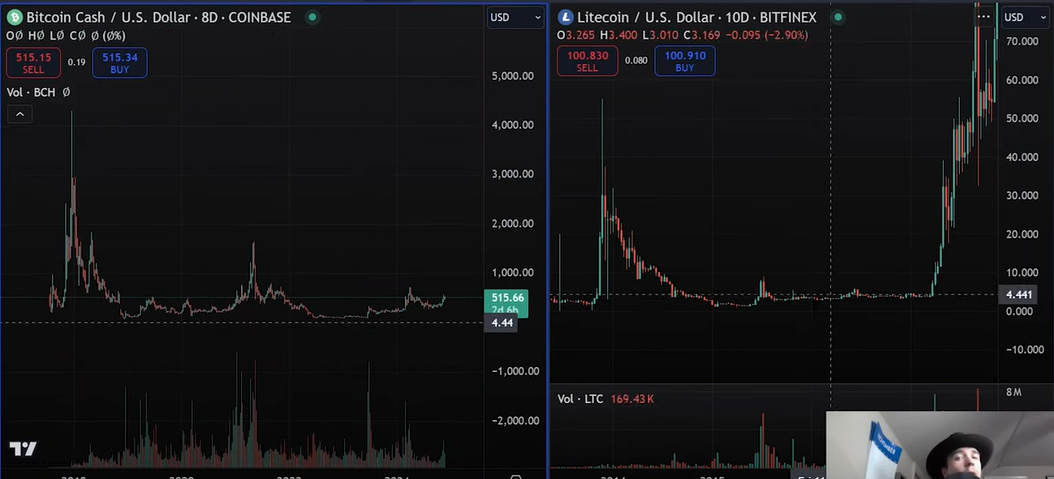
Here he discuss the accumulation patterns where we have a steady period of sideways movement as the whales are accumulating it cheaply over a extended period of time. Here's the video in question: https://www.youtube.com/watch?v=sdeGDzR67KA Conclusion Now this is all theory it does sound nice when someone talks about the price rise of your coin but is it really going to happen? **Well...** *no one can predict the future*, but we can make an educated guess and I do see the logic in these twos' models particularly about the BCH chart patterns mimicking those of other coins that have given an runout in the past. And we have seen Crypto to pump crazy in the past. But I am not sure, I am no technical analysis expert. So, I want to ask you (everyone of you) who most probably have a better understanding of technical analysis than me. What do you think about these theories and models are they just some pish posh or does it actually has some merit?

4 comments
I think 1400 to 2000 is likely. Regardless I am stacking BCH (the real bitcoin)!
True, load up on the real Bitcoin
Whatever the case, i just hope i have as much BCH so that i can enjoy more profit when it actually rise.
Can never have enough BCH, load up as much as you can afford.