 @moon333
more from that month
@moon333
more from that month
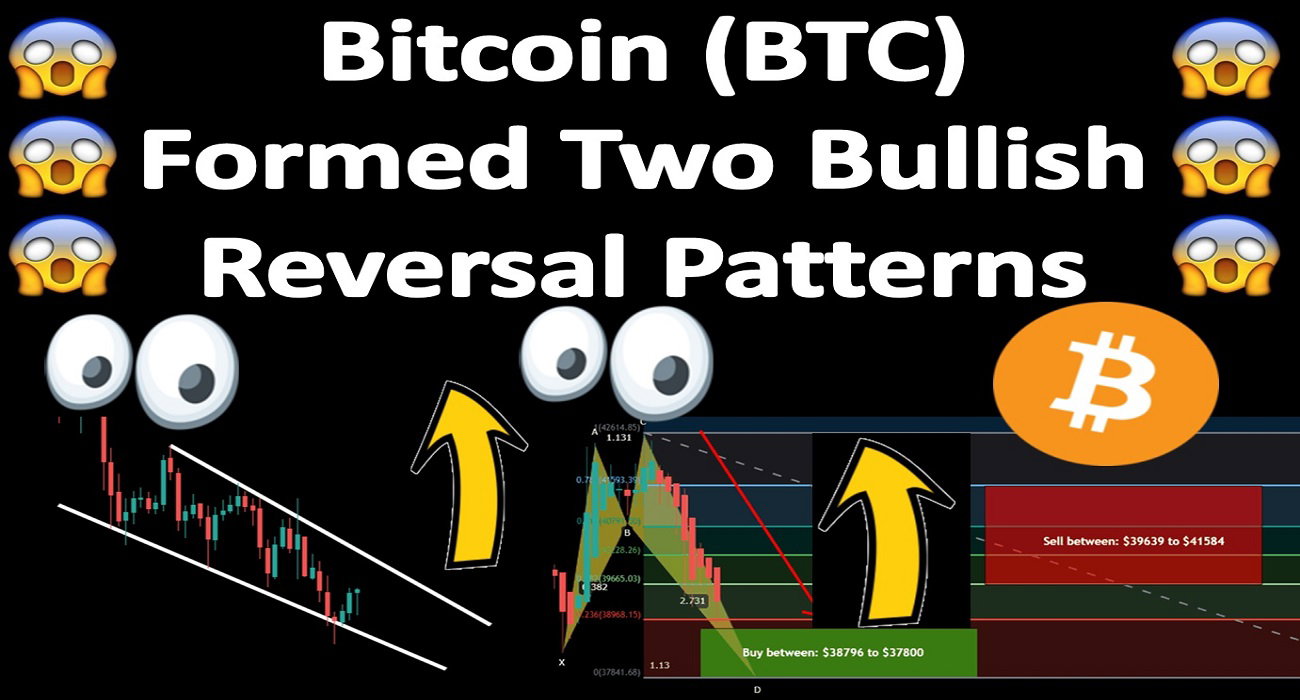
Bitcoin (BTC) Formed Two Bullish Reversal Patterns
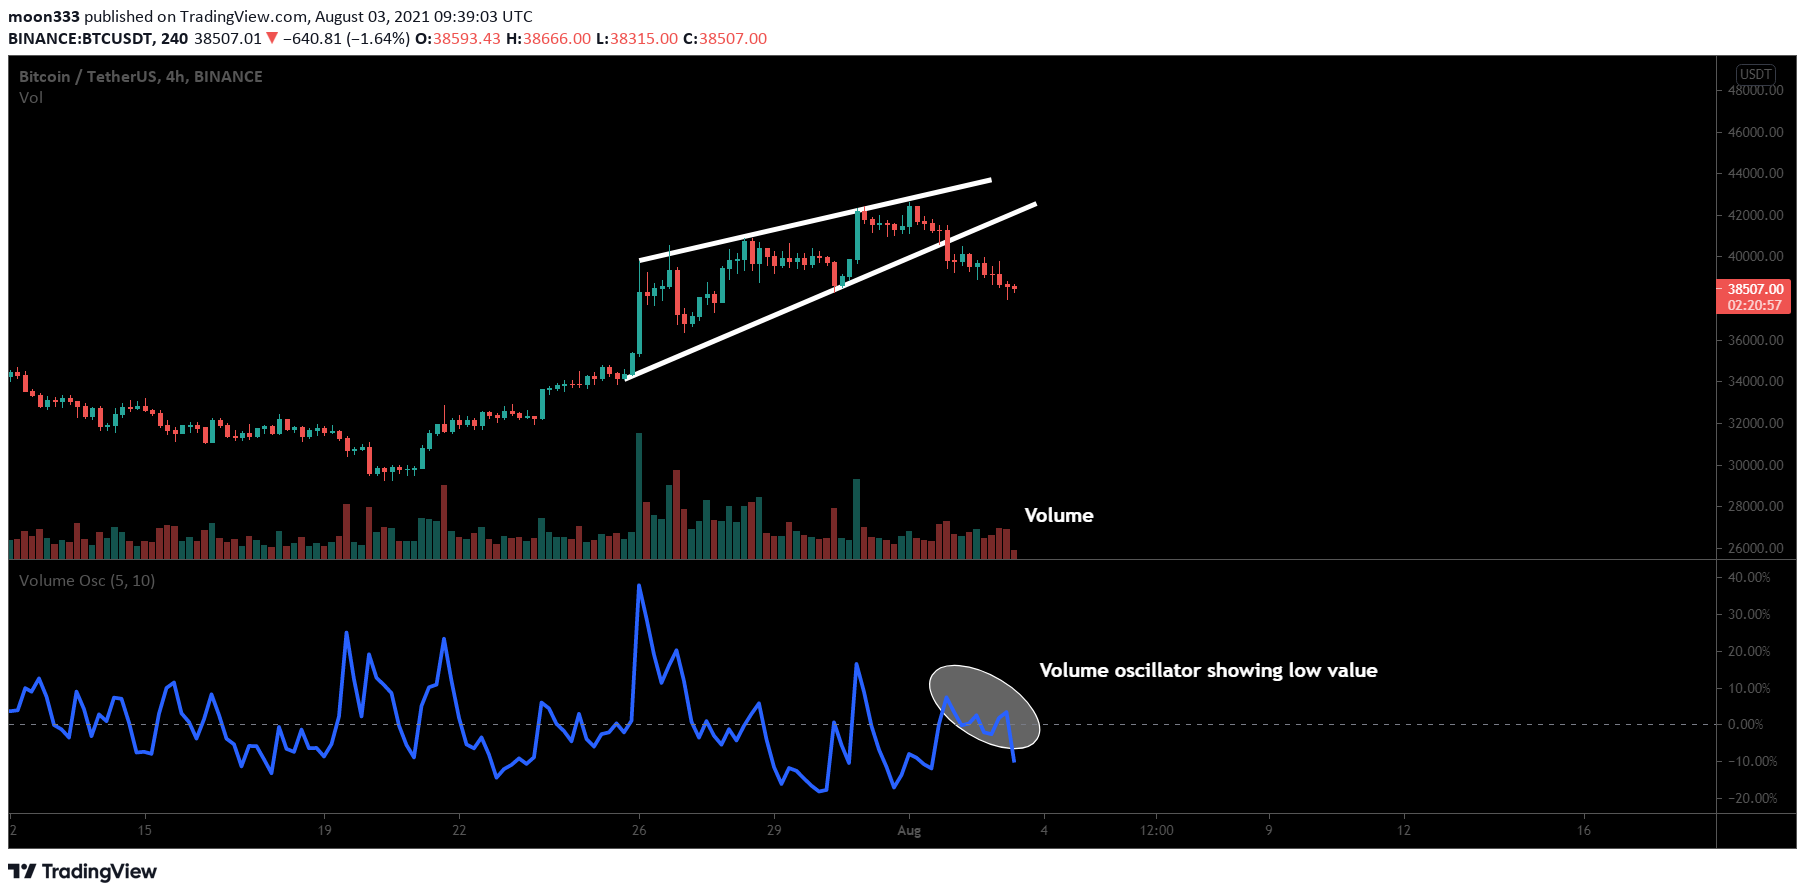
https://youtu.be/-4Vkoo_-ero **Current** **falling wedge** **and breakdown:** On the 4-hourly timeframe chart, the price action of Bitcoin has broken down the support of the rising wedge pattern. After placing the volume oscillator indicator it can be seen that the volume is not supporting this breakdown because the oscillator is moving in a negative territory. https://www.tradingview.com/ideas/fallingwedge/ https://www.tradingview.com/symbols/BTCUSD/ https://www.tradingview.com/ideas/risingwedge/ https://www.tradingview.com/ideas/volume/
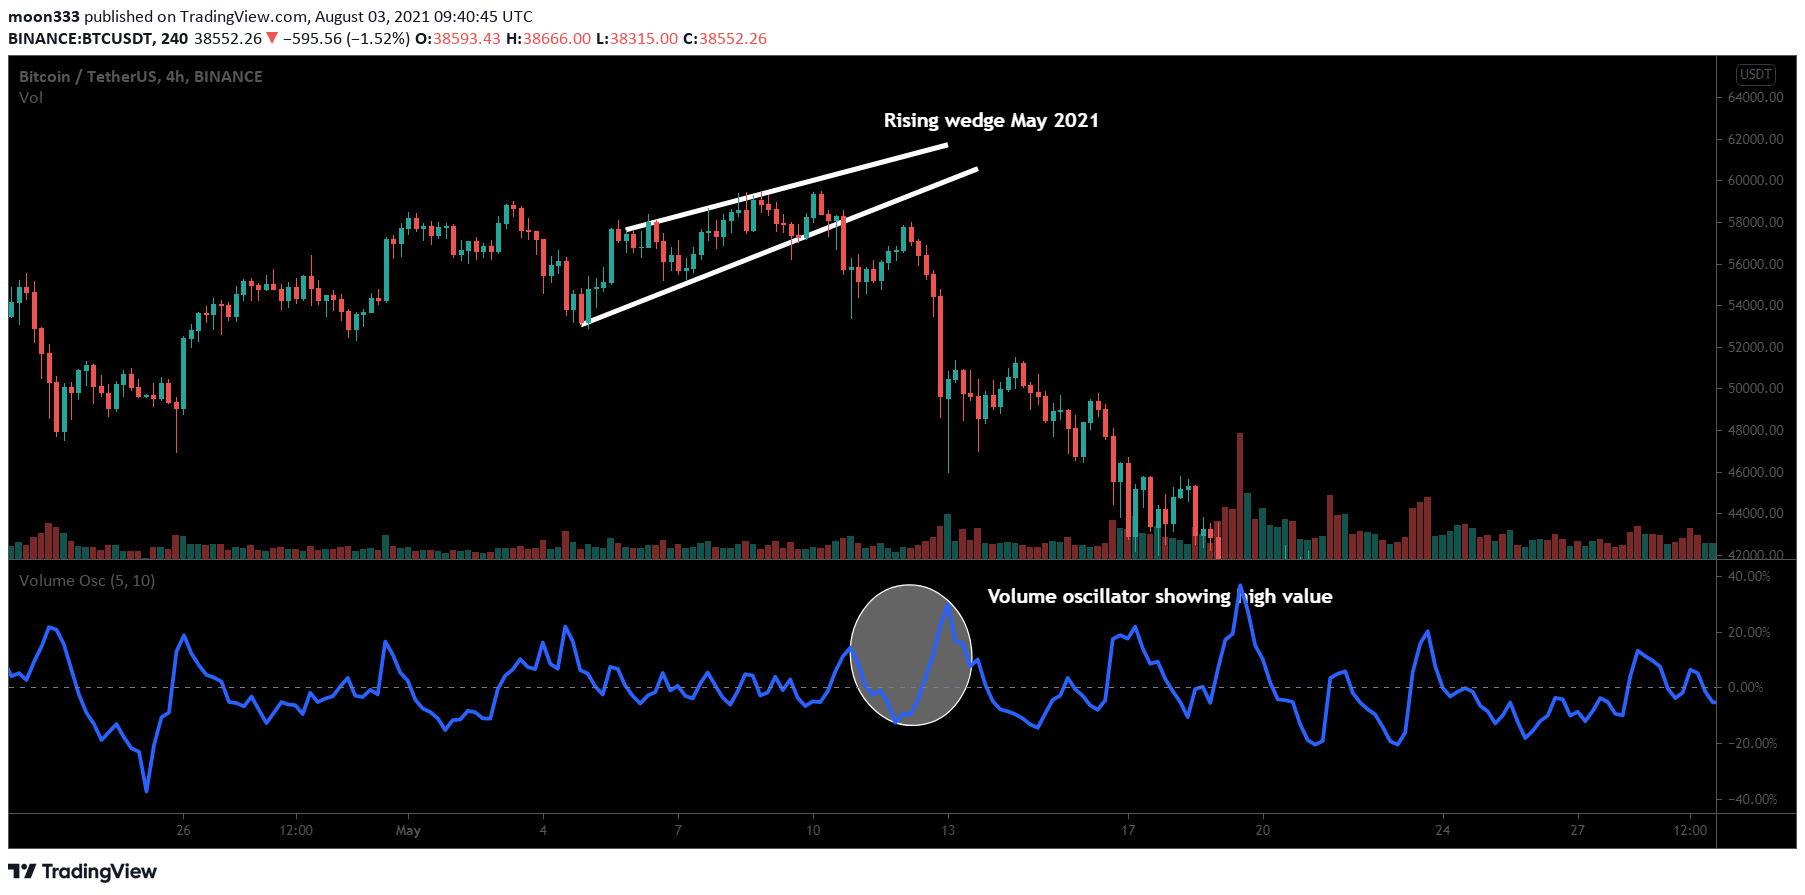
**Previous rising wedge:** Some people are comparing this breakdown with the previous breakdown of the rising wedge which was happened in May 2021 and led to a very strong bearish rally towards the downside. If we take a look at the previous breakdown then it can be easily seen that previous breakdown was supported by the powerful sell volume as the volume oscillator is showing the high value. https://www.tradingview.com/ideas/risingwedge/ https://www.tradingview.com/ideas/bearish/ https://www.tradingview.com/ideas/volume/
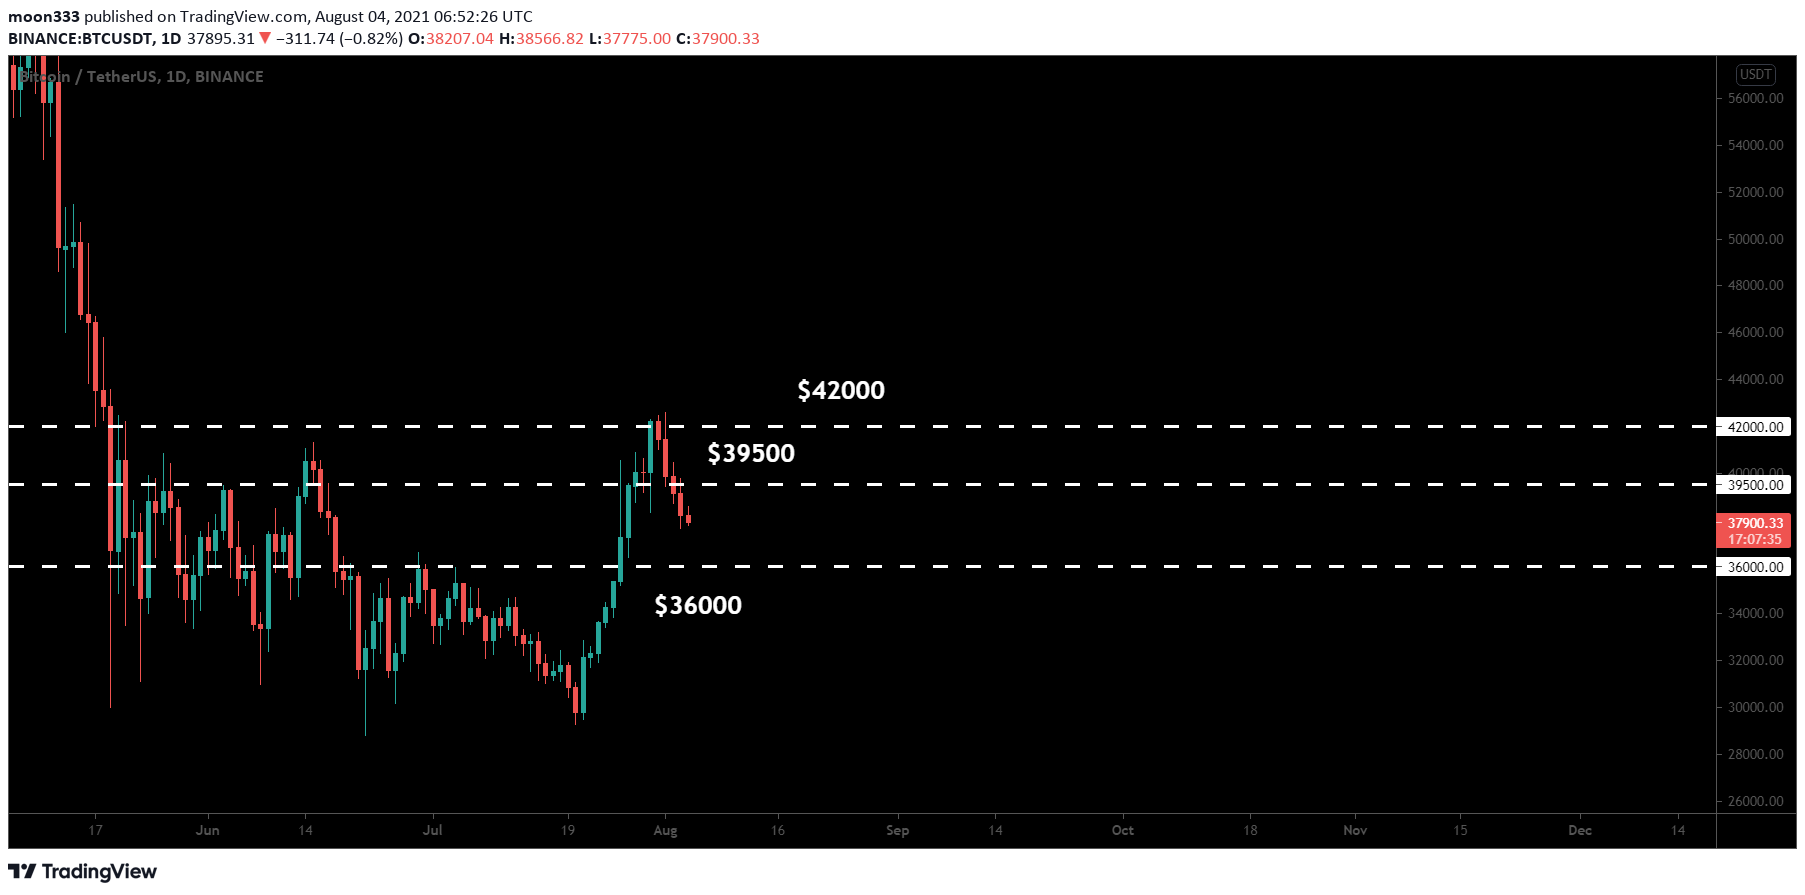
**Different** **support and resistance** **levels:** On the daily time frame it can be easily seen that the price action of BTC has been rejected by the strong resistance of $42000 and now moving below $39500 support level which is now turned into resistance the next support is at $36000. https://www.tradingview.com/ideas/supportandresistance/ https://www.tradingview.com/symbols/BTCUSD/
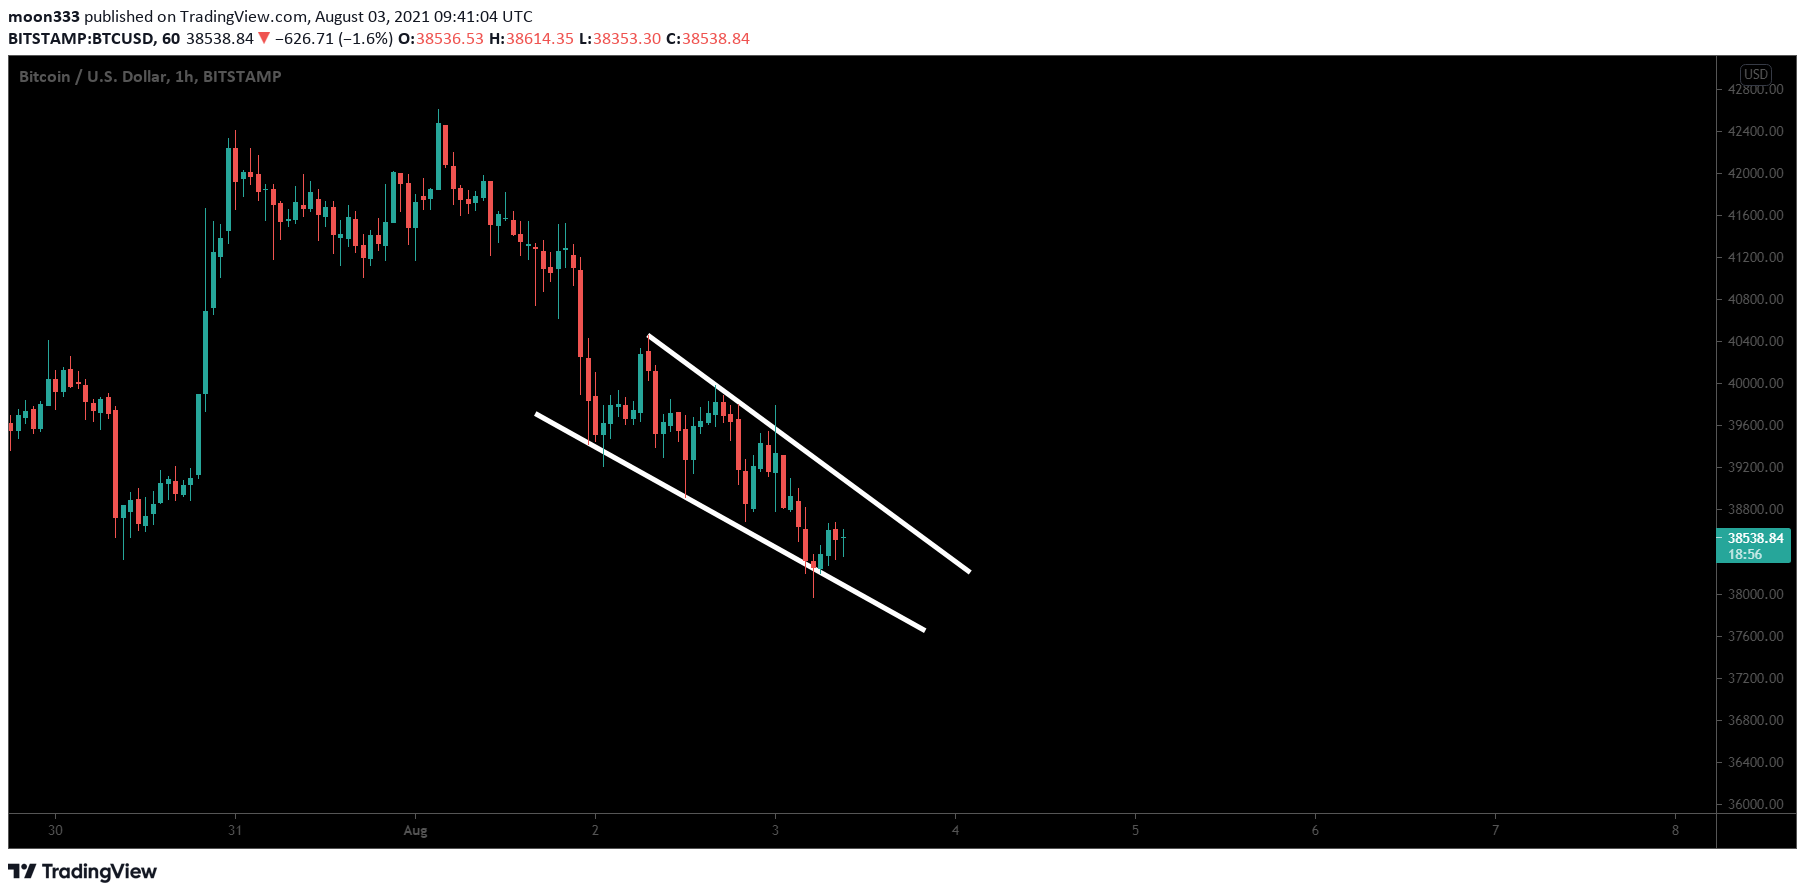
**Falling wedge:** On the small time frame 1-hourly chart, the price action has formed a falling wedge pattern and it is considered as a bullish reversal pattern trader’s community. Therefore, there is a possibility that the price action will start a reversal move from here and break out of resistance of this wedge . https://www.tradingview.com/ideas/fallingwedge/ https://www.tradingview.com/ideas/bullish/ https://www.tradingview.com/ideas/wedgepattern/
**Bullish** **Shark** **move:** On the 4-hourly time frame chart, the priceline of BTC has completed the final leg of bullish Shark pattern. Which is also a bullish reversal pattern. https://www.tradingview.com/ideas/sharkpattern/ https://www.tradingview.com/symbols/BTCUSD/ https://www.tradingview.com/ideas/bullishshark/ https://www.tradingview.com/ideas/bullish/
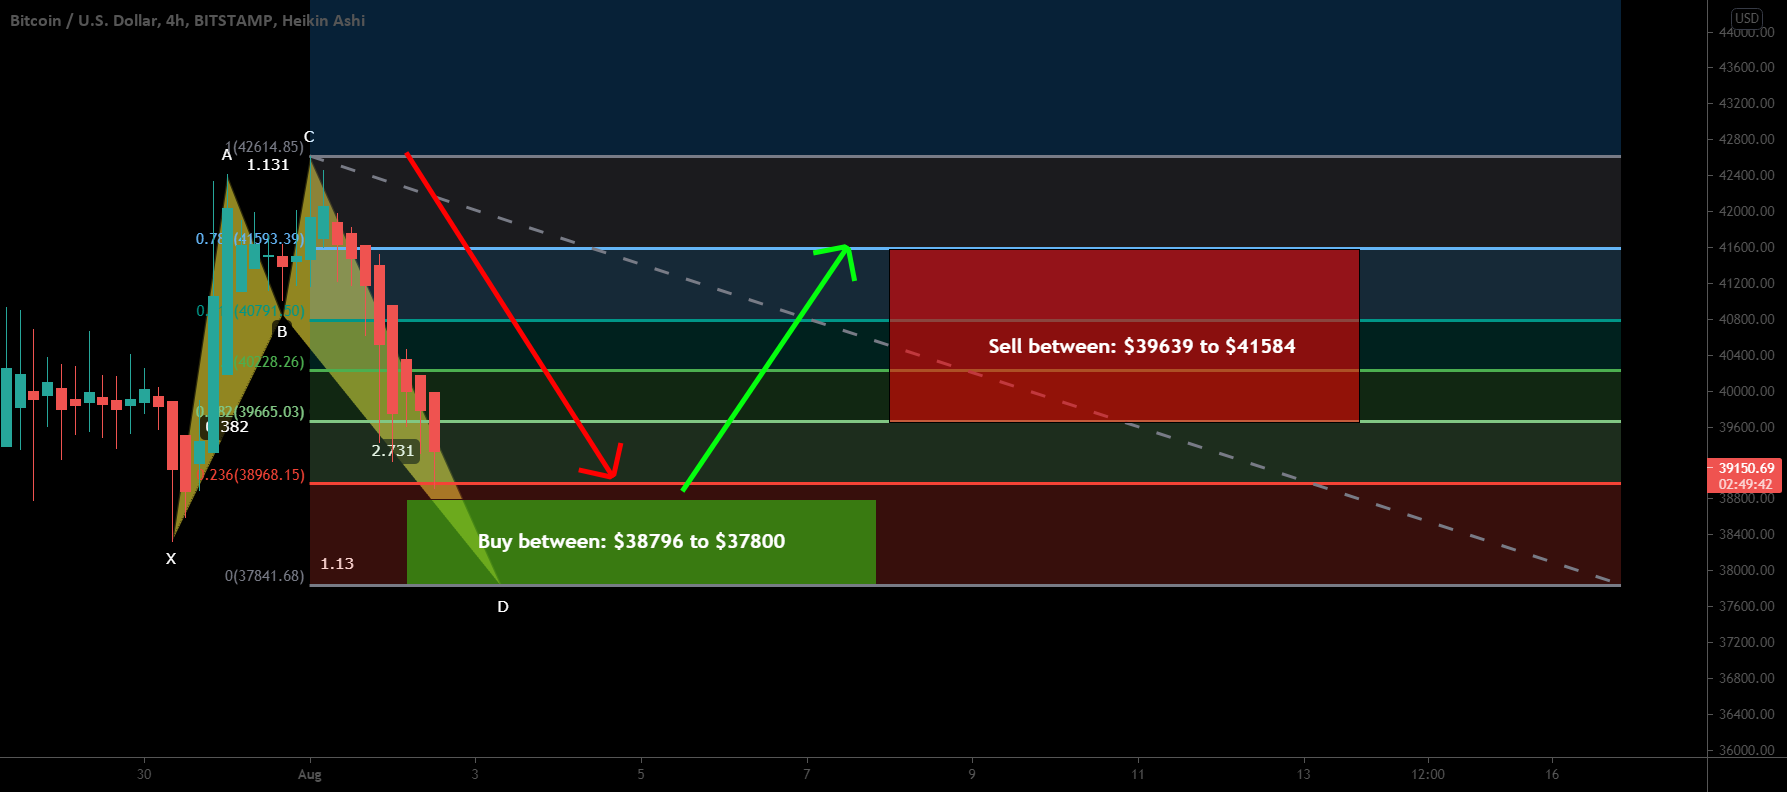
https://www.tradingview.com/chart/BTCUSD/V5A4uhTO-Bitcoin-BTC-forming-bullish-Shark-for-upto-10-move/ **Conclusion:** Even though the price action has broken down the support of rising wedge , but the formation of two bullish reversal patterns ( falling wedge and bullish Shark ) can trigger a bullish divergence . https://www.tradingview.com/ideas/risingwedge/ https://www.tradingview.com/ideas/bullish/ https://www.tradingview.com/ideas/fallingwedge/ https://www.tradingview.com/ideas/bullishshark/ https://www.tradingview.com/ideas/bullishdivergence/ **Don't forget to upvote/tip and share the post, thanks** **You can also support my work at Patreon for more ideas:** **https://www.patreon.com/moon333** **In order to play and watch the current performance of the chart you need at least a free account on tradingview:** https://www.tradingview.com/gopro/?share_your_love=moon333 **KuCoin is one of the best exchange to find crypto gems:** https://www.kucoin.com/ucenter/signup?rcode=rJSDVT3 **Link for Binance exchange, to trade crypto:** https://www.binance.com/?ref=11256882 **Note: Above idea is for educational purpose only. It is advised to diversify and strictly follow the stop loss, and don't get stuck with trade.**
No comments yet