 @moon333
more from that month
@moon333
more from that month
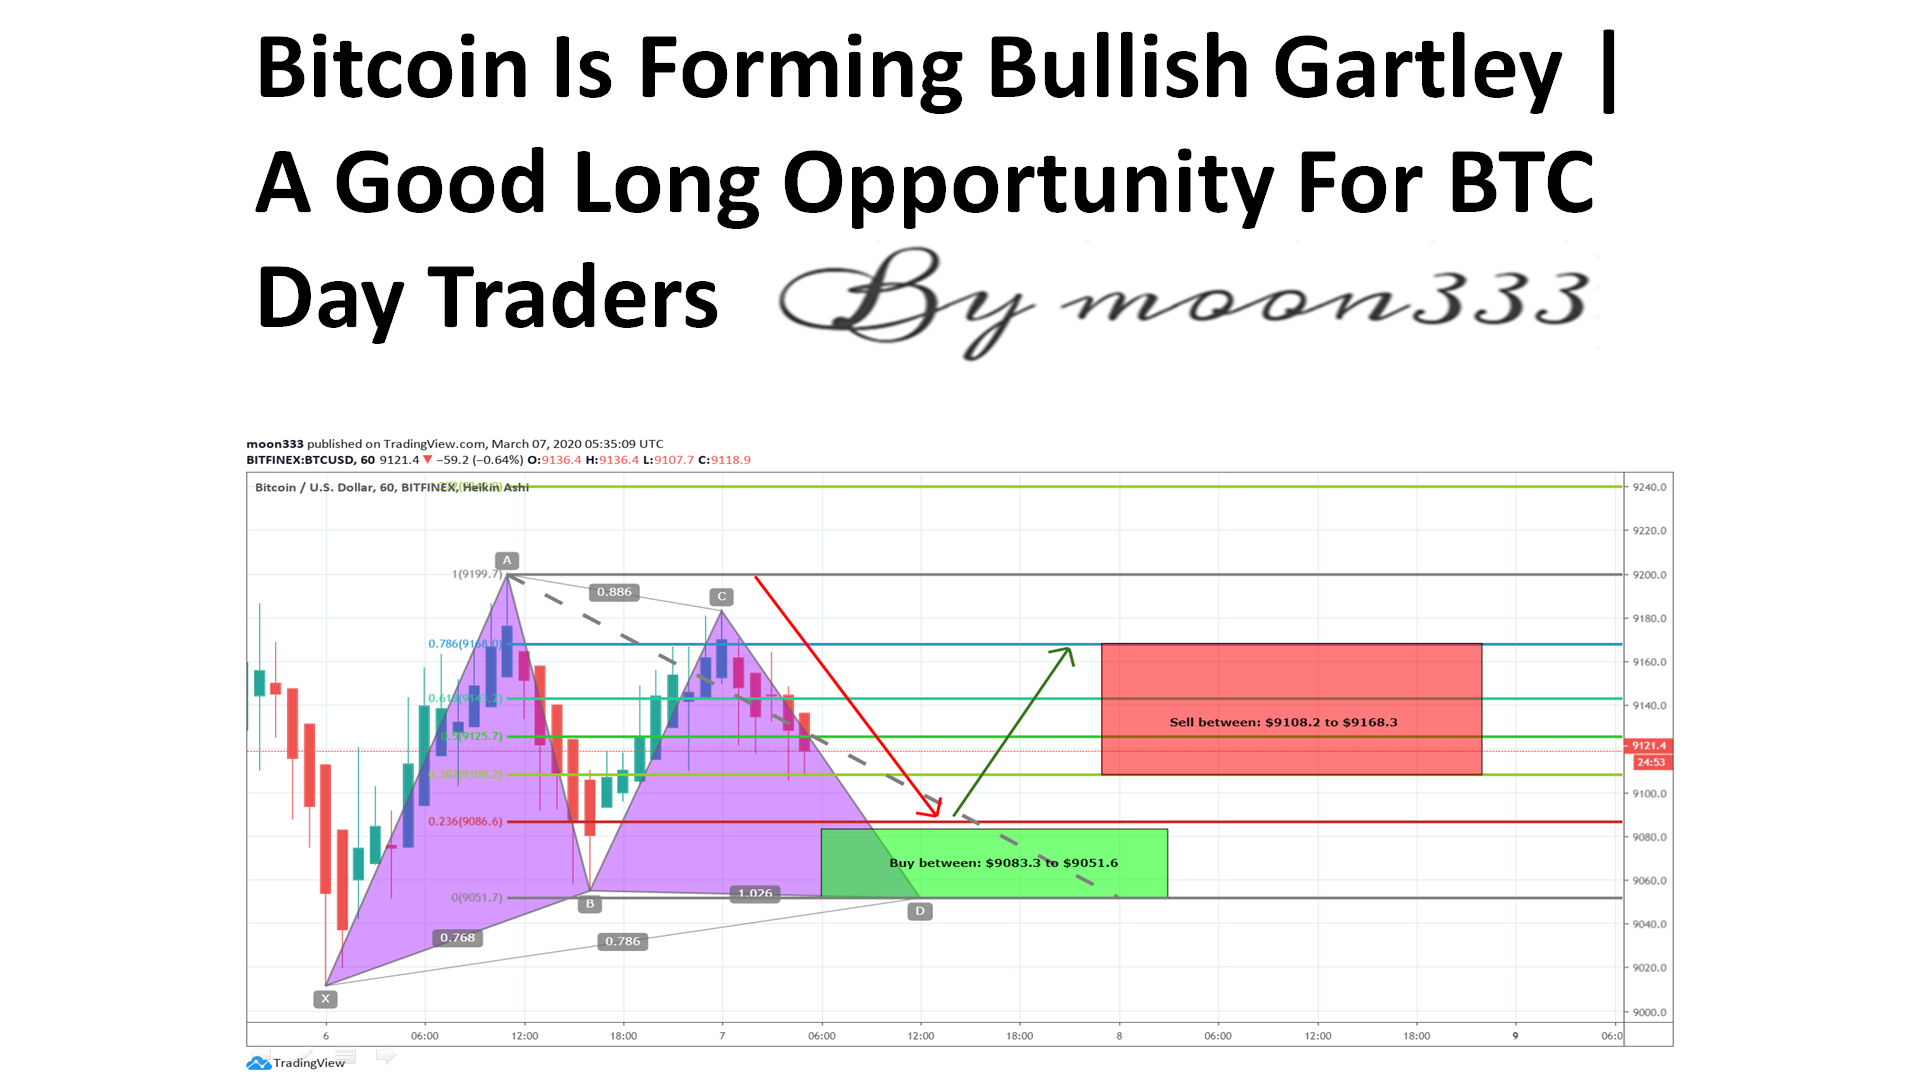
Bitcoin Is Forming Bullish Gartley | A Good Long Opportunity For BTC Day Traders
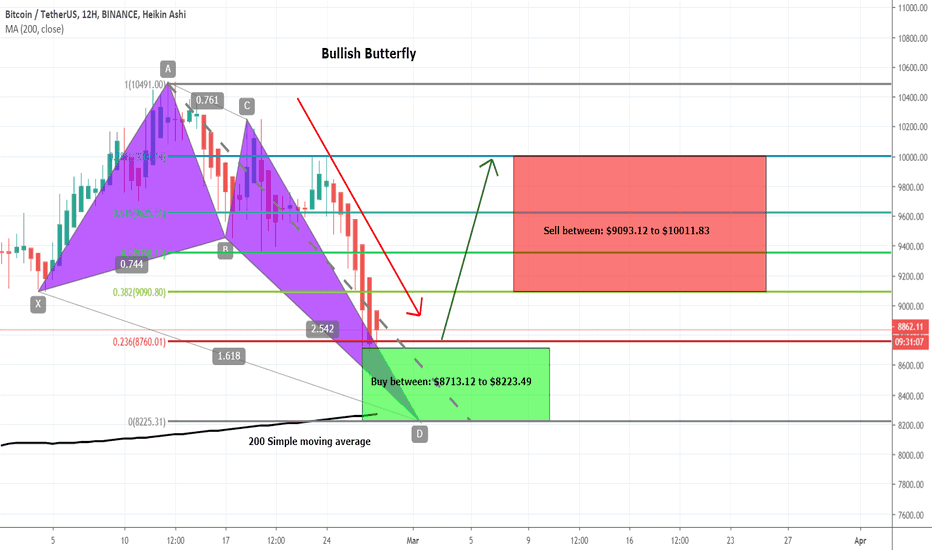
Hi fox hope you are well. In my previous article on 27 Feb we have seen that the Bitcoin formed a complete bullish Butterfly pattern. And on 2nd Mar the pricline started moving up and finally on 5th Mar BTC has hit the sell target zone area.
**A New Harmonic Move On Hourly Chart:** Now this time on 1 hour chart is forming another harmonic pattern and this time it is bullish Gartley. All legs are formed now the priceline is forming last leg. **The Pattern:** Lest’s dig the pattern deeper to see how perfect this pattern is formed:
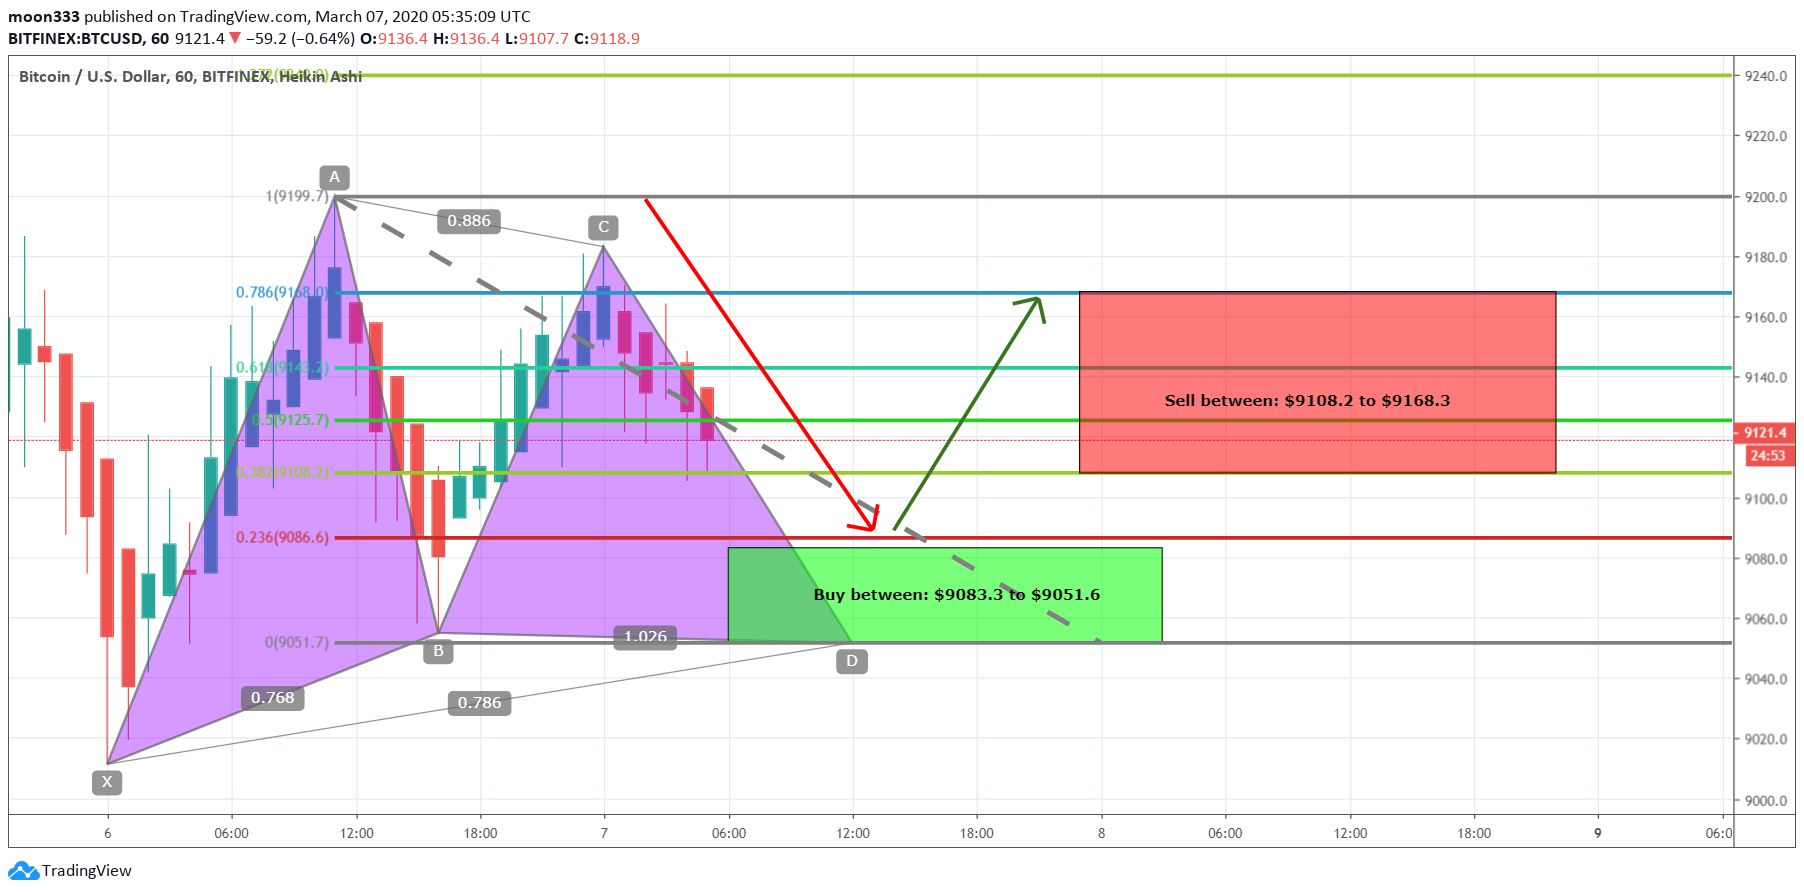
After initial leg (X to A) the A to B leg is retraced between 0.618 to 0.786 Fibonacci and then B to C leg is projected between 0.382 to 0.886 Fibonacci of A to B Fibonacci projection area and last leg (C to D) should be retraced between 0.618 to 0.786 Fibonacci then the priceline will be ready to take bullish or upwards move. **Buying And Sell Targets:** The buying and sell targets according to hrmonic Gartley pattern should be: Buy between: $9083.3 to $9051.6 Sell between: $9108.2 to $9168.3 **Stop Loss:** The potential reversal zone area which is up to to $9051.6 can be used as stop loss in case of complete candle stick closes below this level.
No comments yet