 @moon333
more from that month
@moon333
more from that month
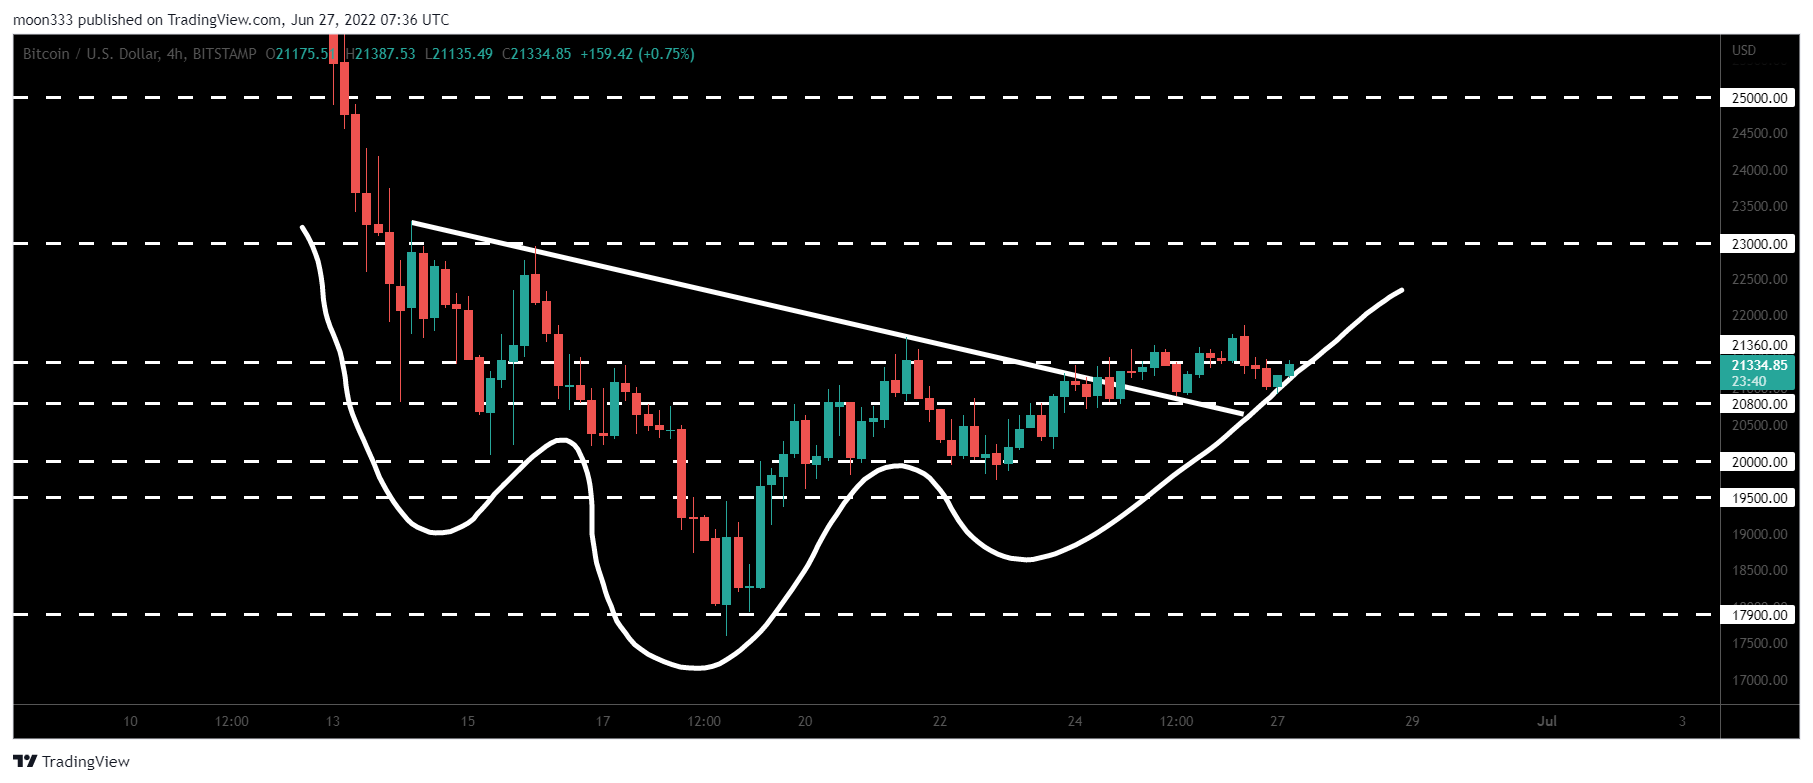
Historical MACD Signal Flashed On Bitcoin (BTC) Charts https://youtu.be/Wq6yiOYOm1E Hi friends hope you are well, and welcome to the new update on Bitcoin. **Inverse Head & Shoulder:** On a 4hr time frame, after breaking out inverse Head & Shoulder pattern, Bitcoin is still not able to break the next resistance of $21360.
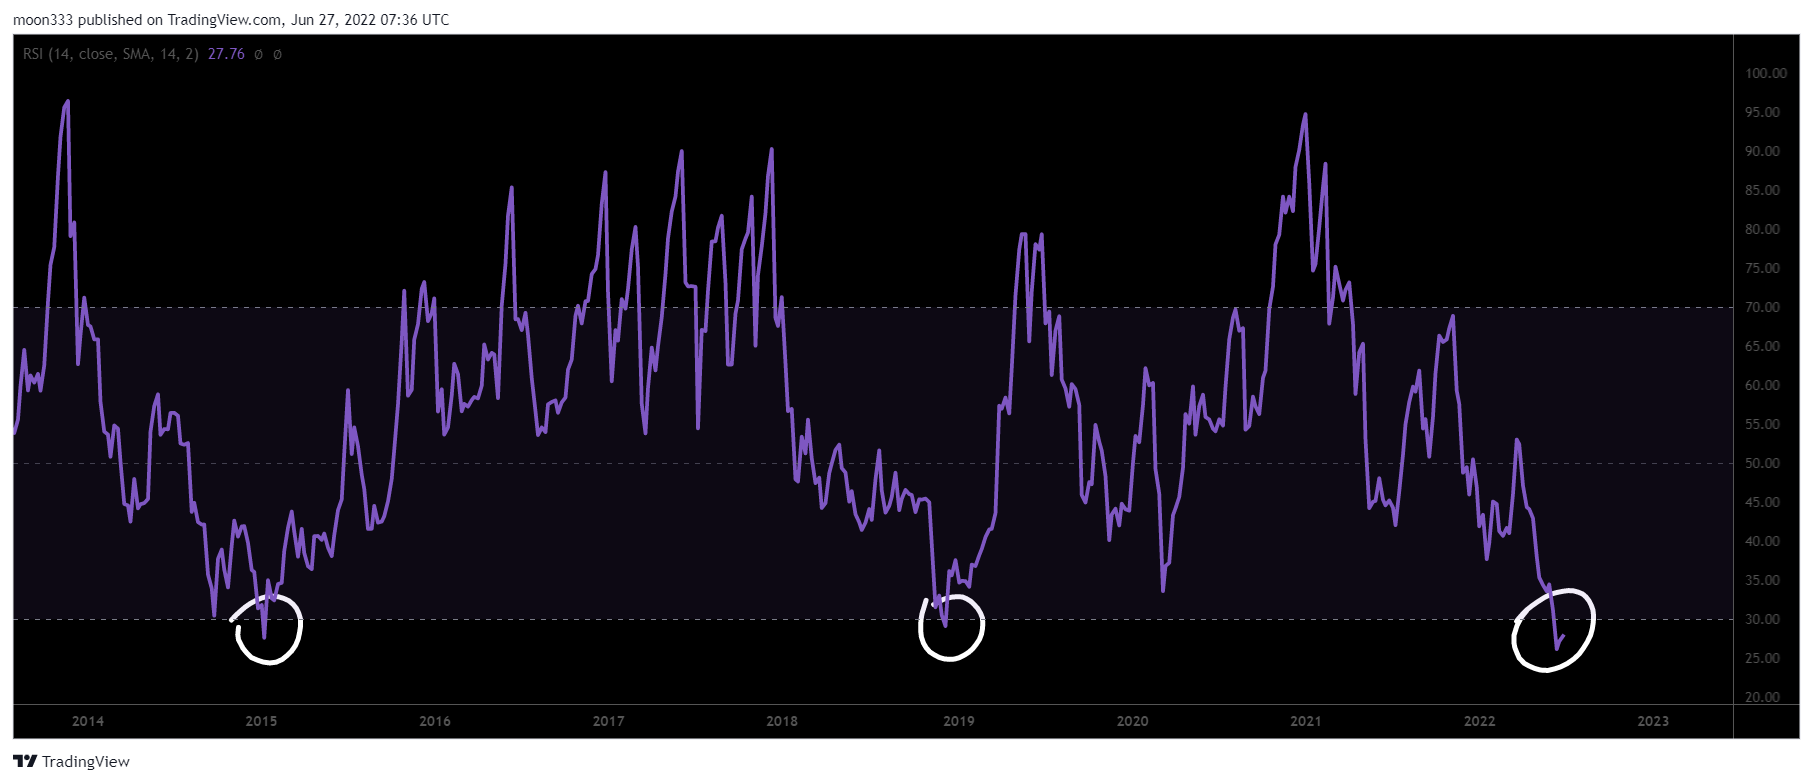
**RSI:** On a weekly time frame, 3rd time in history RSI has entered the oversold zone, and every time on a weekly time frame RSI just touches the oversold zone and moves up. This time after entering the oversold zone, on the very next week RSI has started moving up.
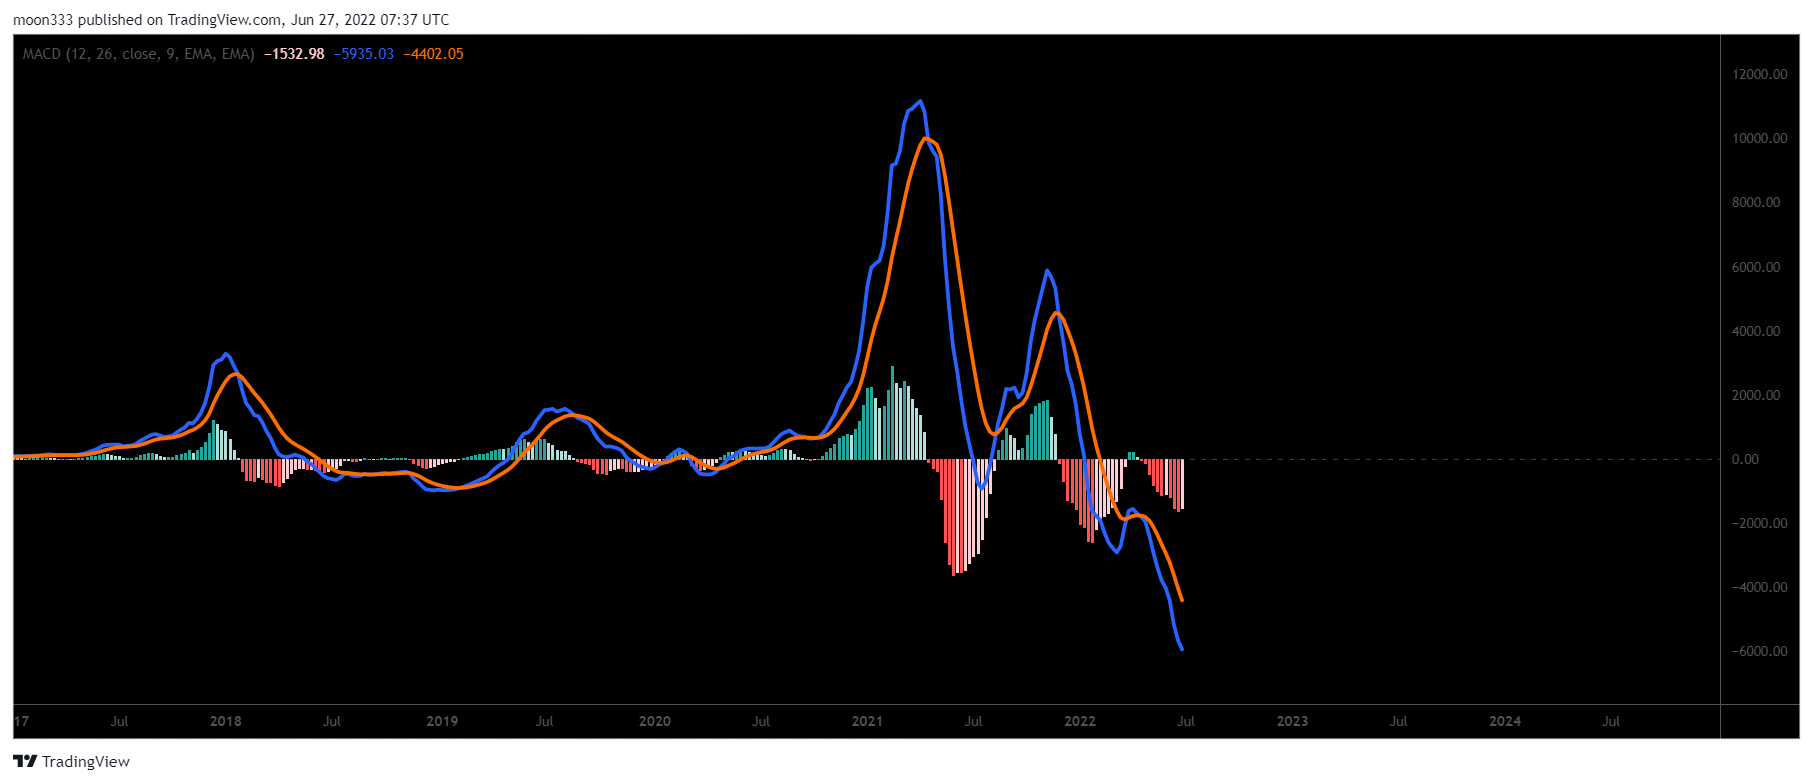
**MACD:** On the same weekly time frame, after RSI's oversold condition, now MACD has started turning bullish (it was strong bearish and now changing to weak bearish). Soon MACD can turn strong and bullish, and that will be a big confirmation that Bitcoin has bottomed out here.
For a detailed analysis, you can watch the video.
No comments yet