Stellar (XLM) makes its weekly move to receive bull support. The Bulls have started to move and the price is reiterating its desire to rise.
Bitcoin Cash is grappling with a lack of demand after ATH. The price pullback is hardening.
Stellar (XLM)
Stellar (XLM) had been feeling the lack of bulls since its peak of $ 0.61 and felt some bull presence again as the price rose during the day.
Although the asset saw an instant drop to $ 0.46, the hourly charts show that the situation has recovered. Stellar is experiencing a squeeze in the $ 0.47 and $ 0.51 band.
In particular, this compression has caused a contraction in the Bollinger bands, and there may be a break movement in the near future.
For XLM, this bullish move is an important sign. This indicator shows the desire to regain the bullish effect of the price. Especially in the daily chart, RSI and MACD data were looking for opportunities to rise. The fact that the price is stuck in a range, and the movement that suppresses each other in the candles, shows its willingness to jump. RSI data rose above the neutral level in hourly data.
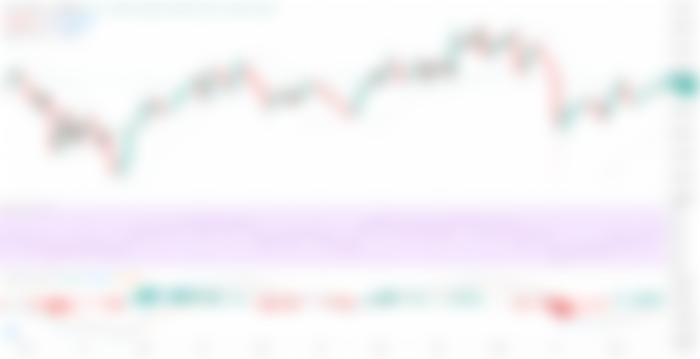

But it had fallen from the point of overbought in daily data. SAR data also prints sales pressure in 4-hour and daily charts. This may increase the likelihood that the price will be kept in the price range for some time, and the likelihood of a break in the coming days due to the lack of volatility.
If this bull move is successful, the asset will be able to test for exceeding the partial resistance point of $ 0.56. For the moment, its value on the moving average gives it a boost, and the probability that it will fall increases the probability that it will fall to $ 0.41. The weekly move could be strong, rising above the local peak of $ 0.61 to $ 0.7. Then the Bulls will set a target toward the $ 1 psychological limit.
Bitcoin Cash (BCH)
Although Bitcoin Cash (BCH) has been placed in the market value rankings many times with different altcoin effects and has been deprived of the interest of many investors, it has won a fairly successful move.
BCH, which was at the $ 400 limit earlier this month alone, broke its own record, rising as high as $ 775 the previous day. Downward pressures can increase for the asset, which is catching an increase of almost 100%.
RSI and MACD, which signal an increase in hourly charts, give a negative impression on daily and 4-hour charts. This situation, which worries the price, suggests that the price is far from a break, and the parameters that make this situation more critical are CMF and equilibrium volume data.
This data shows a decline in demand and, depending on the volume. The asset that entered oversold territory resulted in a decline in demand. This, in turn, is effective in breaking down the price.
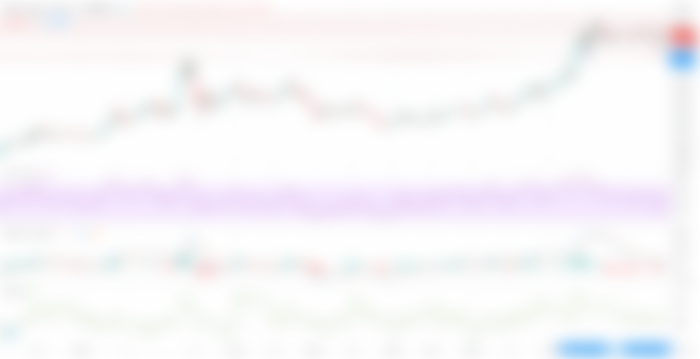

For now, the asset, which has been supported at $ 702, may fall below this level. The SAR data predicts sales, and in this case the pressure to go below that level again could come from the Bears.
Falling below the $ 639 limit value set in 14-day data can strengthen the likelihood that the asset will enter a downward trend.
The most important problem for BCH is the lack of volume and demand at the moment.
Bull movement must be seen. And if the weekly decline falls to $ 655, it could create opportunities for investment.
👍